How to Plot Two Histograms Together in Matplotlib
How to plot two histograms together in Matplotlib is a common task for data visualization enthusiasts and professionals alike. This article will provide a detailed exploration of the various methods and techniques to achieve this using Matplotlib, one of the most popular plotting libraries in Python. We’ll cover everything from basic histogram plotting to advanced customization options, ensuring you have all the tools necessary to create informative and visually appealing dual histograms.
Understanding the Basics of Histograms in Matplotlib
Before diving into how to plot two histograms together in Matplotlib, it’s essential to understand what histograms are and how they are created in Matplotlib. A histogram is a graphical representation of the distribution of numerical data. It estimates the probability distribution of a continuous variable and is often used to visualize the underlying frequency distribution of a dataset.
In Matplotlib, histograms can be created using the hist() function. Let’s start with a simple example of how to create a basic histogram:
import matplotlib.pyplot as plt
import numpy as np

# Generate some random data
data = np.random.normal(0, 1, 1000)

# Create a histogram
plt.hist(data, bins=30, edgecolor='black')
plt.title('How to plot two histograms together in Matplotlib: Basic Histogram')
plt.xlabel('Value')
plt.ylabel('Frequency')
plt.show()
Output:
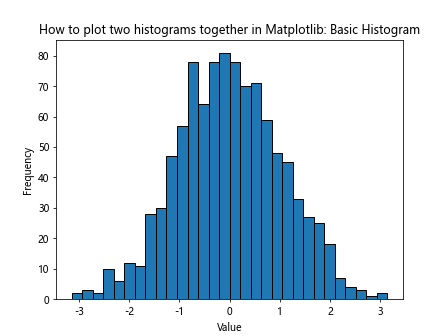
In this example, we generate random data from a normal distribution and create a histogram using plt.hist(). The bins parameter determines the number of bars in the histogram, and edgecolor adds a border to each bar for better visibility.
Plotting Two Histograms Together: The Basics
Now that we understand how to create a single histogram, let’s explore how to plot two histograms together in Matplotlib. There are several approaches to achieve this, each with its own advantages and use cases.
Method 1: Using plt.hist() Multiple Times
The simplest method to plot two histograms together is to call plt.hist() twice on the same axes. Here’s an example:
import matplotlib.pyplot as plt
import numpy as np

# Generate two sets of data
data1 = np.random.normal(0, 1, 1000)
data2 = np.random.normal(2, 1, 1000)

# Plot two histograms
plt.hist(data1, bins=30, alpha=0.5, label='Data 1')
plt.hist(data2, bins=30, alpha=0.5, label='Data 2')

plt.title('How to plot two histograms together in Matplotlib: Method 1')
plt.xlabel('Value')
plt.ylabel('Frequency')
plt.legend()
plt.show()
Output:
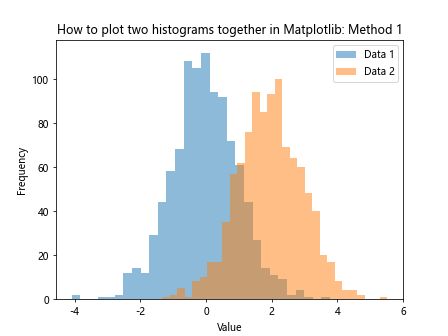
In this example, we generate two sets of data and plot them using separate plt.hist() calls. The alpha parameter is set to 0.5 to make the histograms semi-transparent, allowing us to see overlapping regions. We also add labels to distinguish between the two datasets.
Method 2: Using numpy.histogram() and plt.bar()
Another approach to plot two histograms together in Matplotlib is to use numpy.histogram() to calculate the histogram data separately, and then use plt.bar() to plot the results. This method gives you more control over the appearance of each histogram:
import matplotlib.pyplot as plt
import numpy as np

# Generate two sets of data
data1 = np.random.normal(0, 1, 1000)
data2 = np.random.normal(2, 1, 1000)

# Calculate histogram data
hist1, bins1 = np.histogram(data1, bins=30)
hist2, bins2 = np.histogram(data2, bins=30)

# Plot histograms using bar plots
width = (bins1[1] - bins1[0]) * 0.4
plt.bar(bins1[:-1], hist1, width=width, alpha=0.5, label='Data 1')
plt.bar(bins2[:-1] + width, hist2, width=width, alpha=0.5, label='Data 2')

plt.title('How to plot two histograms together in Matplotlib: Method 2')
plt.xlabel('Value')
plt.ylabel('Frequency')
plt.legend()
plt.show()
Output:
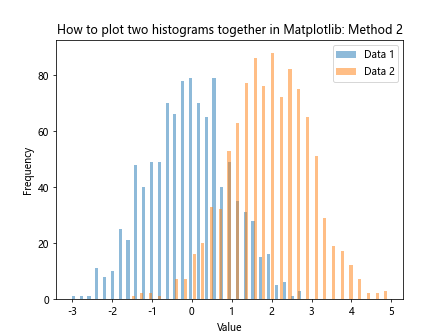
This method allows for more precise control over the positioning and width of the bars, which can be useful when comparing datasets with different scales or ranges.
Advanced Techniques for Plotting Two Histograms Together
Now that we’ve covered the basics of how to plot two histograms together in Matplotlib, let’s explore some more advanced techniques and customizations.
Stacked Histograms
Stacked histograms are useful when you want to show the cumulative distribution of two or more datasets. Here’s how to create a stacked histogram:
import matplotlib.pyplot as plt
import numpy as np

# Generate two sets of data
data1 = np.random.normal(0, 1, 1000)
data2 = np.random.normal(2, 1, 1000)

# Plot stacked histogram
plt.hist([data1, data2], bins=30, stacked=True, label=['Data 1', 'Data 2'])

plt.title('How to plot two histograms together in Matplotlib: Stacked Histogram')
plt.xlabel('Value')
plt.ylabel('Frequency')
plt.legend()
plt.show()
Output:
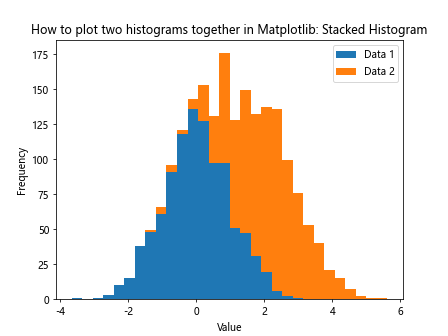
In this example, we pass both datasets as a list to plt.hist() and set stacked=True to create a stacked histogram.
Side-by-Side Histograms
Sometimes, it’s more appropriate to display histograms side by side rather than overlapping. Here’s how to achieve this:
import matplotlib.pyplot as plt
import numpy as np

# Generate two sets of data
data1 = np.random.normal(0, 1, 1000)
data2 = np.random.normal(2, 1, 1000)

# Create side-by-side histograms
fig, (ax1, ax2) = plt.subplots(1, 2, figsize=(12, 4))

ax1.hist(data1, bins=30, edgecolor='black')
ax1.set_title('Data 1')
ax1.set_xlabel('Value')
ax1.set_ylabel('Frequency')

ax2.hist(data2, bins=30, edgecolor='black')
ax2.set_title('Data 2')
ax2.set_xlabel('Value')
ax2.set_ylabel('Frequency')

plt.suptitle('How to plot two histograms together in Matplotlib: Side-by-Side')
plt.tight_layout()
plt.show()
Output:
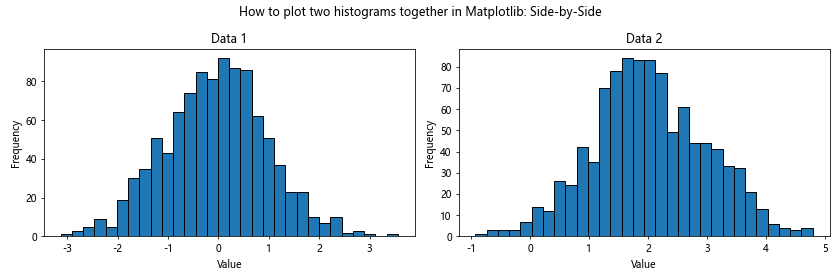
This approach uses plt.subplots() to create two separate axes for each histogram, allowing for easy comparison between the two datasets.
Normalized Histograms
When comparing datasets of different sizes, it’s often useful to normalize the histograms. This can be done by setting the density parameter to True:
import matplotlib.pyplot as plt
import numpy as np

# Generate two sets of data with different sizes
data1 = np.random.normal(0, 1, 1000)
data2 = np.random.normal(2, 1, 2000)

# Plot normalized histograms
plt.hist(data1, bins=30, alpha=0.5, density=True, label='Data 1')
plt.hist(data2, bins=30, alpha=0.5, density=True, label='Data 2')

plt.title('How to plot two histograms together in Matplotlib: Normalized')
plt.xlabel('Value')
plt.ylabel('Probability Density')
plt.legend()
plt.show()
Output:
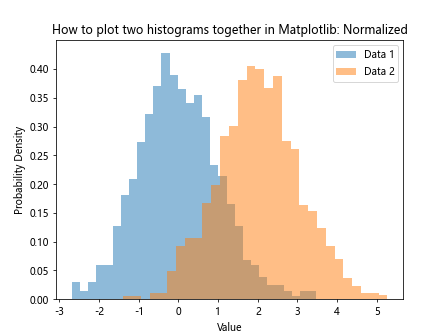
By setting density=True, the y-axis now represents probability density instead of frequency, allowing for a fair comparison between datasets of different sizes.
Customizing Histogram Appearance
When learning how to plot two histograms together in Matplotlib, it’s important to know how to customize the appearance of your plots to make them more informative and visually appealing.
Changing Colors and Styles
You can easily change the colors and styles of your histograms to make them more distinct:
import matplotlib.pyplot as plt
import numpy as np

# Generate two sets of data
data1 = np.random.normal(0, 1, 1000)
data2 = np.random.normal(2, 1, 1000)

# Plot histograms with custom colors and styles
plt.hist(data1, bins=30, alpha=0.7, color='skyblue', edgecolor='black', linewidth=1.2, label='Data 1')
plt.hist(data2, bins=30, alpha=0.7, color='lightgreen', edgecolor='black', linewidth=1.2, label='Data 2')

plt.title('How to plot two histograms together in Matplotlib: Custom Colors')
plt.xlabel('Value')
plt.ylabel('Frequency')
plt.legend()
plt.show()
Output:
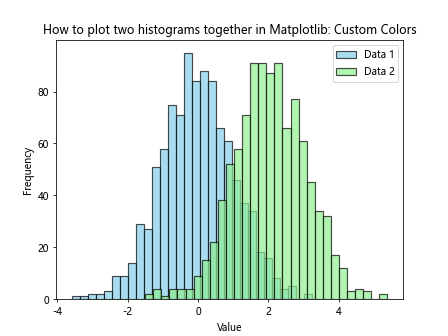
In this example, we use different colors for each histogram and add black edges to make the bars more distinct.
Adding Grid Lines
Grid lines can help readers more accurately interpret the values in your histogram:
import matplotlib.pyplot as plt
import numpy as np

# Generate two sets of data
data1 = np.random.normal(0, 1, 1000)
data2 = np.random.normal(2, 1, 1000)

# Plot histograms with grid lines
plt.hist(data1, bins=30, alpha=0.5, label='Data 1')
plt.hist(data2, bins=30, alpha=0.5, label='Data 2')

plt.title('How to plot two histograms together in Matplotlib: With Grid')
plt.xlabel('Value')
plt.ylabel('Frequency')
plt.legend()
plt.grid(True, linestyle='--', alpha=0.7)
plt.show()
Output:
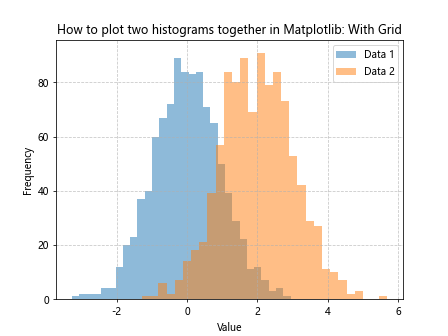
The plt.grid() function adds grid lines to the plot, with customizable style and transparency.
Customizing Axis Labels and Ticks
For a more professional look, you might want to customize the axis labels and ticks:
import matplotlib.pyplot as plt
import numpy as np

# Generate two sets of data
data1 = np.random.normal(0, 1, 1000)
data2 = np.random.normal(2, 1, 1000)

# Plot histograms with custom axis labels and ticks
fig, ax = plt.subplots(figsize=(10, 6))

ax.hist(data1, bins=30, alpha=0.5, label='Data 1')
ax.hist(data2, bins=30, alpha=0.5, label='Data 2')

ax.set_title('How to plot two histograms together in Matplotlib: Custom Axes', fontsize=16)
ax.set_xlabel('Value', fontsize=14)
ax.set_ylabel('Frequency', fontsize=14)

ax.tick_params(axis='both', which='major', labelsize=12)
ax.legend(fontsize=12)

plt.show()
Output:
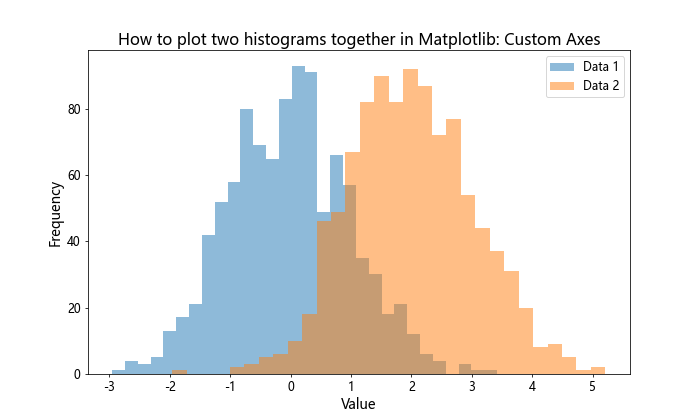
This example demonstrates how to adjust font sizes and tick parameters for a more polished appearance.
Handling Overlapping Histograms
When learning how to plot two histograms together in Matplotlib, you may encounter situations where the histograms overlap significantly, making it difficult to distinguish between them. Here are some techniques to handle this issue.
Using Step Histograms
Step histograms can be a good alternative when dealing with overlapping data:
import matplotlib.pyplot as plt
import numpy as np

# Generate two sets of data
data1 = np.random.normal(0, 1, 1000)
data2 = np.random.normal(0.5, 1, 1000)

# Plot step histograms
plt.hist(data1, bins=30, alpha=0.5, histtype='step', linewidth=2, label='Data 1')
plt.hist(data2, bins=30, alpha=0.5, histtype='step', linewidth=2, label='Data 2')

plt.title('How to plot two histograms together in Matplotlib: Step Histogram')
plt.xlabel('Value')
plt.ylabel('Frequency')
plt.legend()
plt.show()
Output:
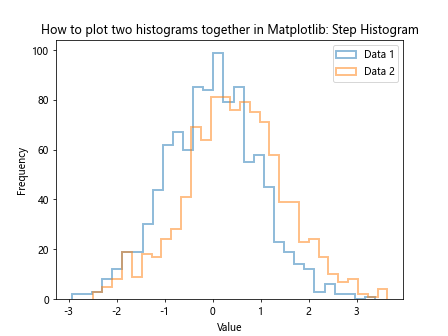
By setting histtype='step', we create outline histograms that are easier to distinguish when overlapping.
Using Different Bin Alignments
Another approach is to slightly offset the bins of one histogram:
import matplotlib.pyplot as plt
import numpy as np

# Generate two sets of data
data1 = np.random.normal(0, 1, 1000)
data2 = np.random.normal(0.5, 1, 1000)

# Calculate histogram data
hist1, bins1 = np.histogram(data1, bins=30)
hist2, bins2 = np.histogram(data2, bins=30)

# Plot histograms with offset bins
width = (bins1[1] - bins1[0]) * 0.4
plt.bar(bins1[:-1], hist1, width=width, alpha=0.5, label='Data 1')
plt.bar(bins2[:-1] + width/2, hist2, width=width, alpha=0.5, label='Data 2')

plt.title('How to plot two histograms together in Matplotlib: Offset Bins')
plt.xlabel('Value')
plt.ylabel('Frequency')
plt.legend()
plt.show()
Output:
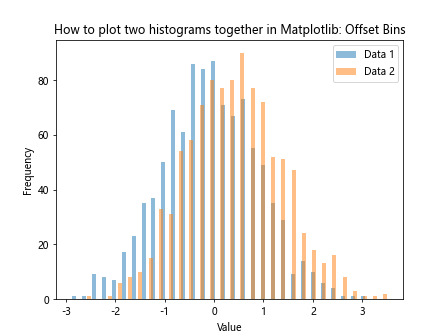
This technique offsets the bins of the second histogram by half the width of a bar, making it easier to see both distributions.
Advanced Visualization Techniques
As you become more proficient in how to plot two histograms together in Matplotlib, you may want to explore more advanced visualization techniques to enhance your plots.
Adding a Kernel Density Estimate (KDE)
A Kernel Density Estimate can provide a smooth estimate of the probability density function of your data:
import matplotlib.pyplot as plt
import numpy as np
from scipy import stats

# Generate two sets of data
data1 = np.random.normal(0, 1, 1000)
data2 = np.random.normal(2, 1, 1000)

# Plot histograms and KDE
plt.hist(data1, bins=30, alpha=0.5, density=True, label='Data 1')
plt.hist(data2, bins=30, alpha=0.5, density=True, label='Data 2')

kde1 = stats.gaussian_kde(data1)
kde2 = stats.gaussian_kde(data2)
x_range = np.linspace(-4, 6, 200)
plt.plot(x_range, kde1(x_range), label='KDE 1')
plt.plot(x_range, kde2(x_range), label='KDE 2')

plt.title('How to plot two histograms together in Matplotlib: With KDE')
plt.xlabel('Value')
plt.ylabel('Density')
plt.legend()
plt.show()
Output:
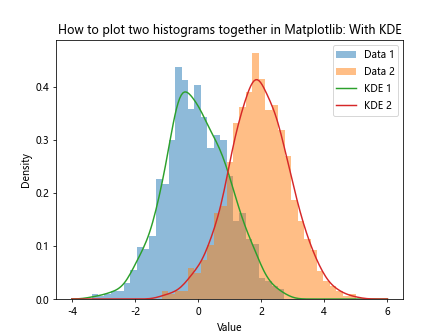
This example adds a KDE curve to each histogram, providing a smoother representation of the data distribution.
Creating a 2D Histogram
For datasets with two variables, a 2D histogram can be an effective visualization tool:
import matplotlib.pyplot as plt
import numpy as np

# Generate two sets of 2D data
x1 = np.random.normal(0, 1, 1000)
y1 = np.random.normal(0, 1, 1000)
x2 = np.random.normal(2, 1, 1000)
y2 = np.random.normal(2, 1, 1000)

# Create 2D histogram
plt.hist2d(np.concatenate([x1, x2]), np.concatenate([y1, y2]), bins=30, cmap='coolwarm')
plt.colorbar(label='Frequency')

plt.title('How to plot two histograms together in Matplotlib: 2D Histogram')
plt.xlabel('X Value')
plt.ylabel('Y Value')
plt.show()
Output:
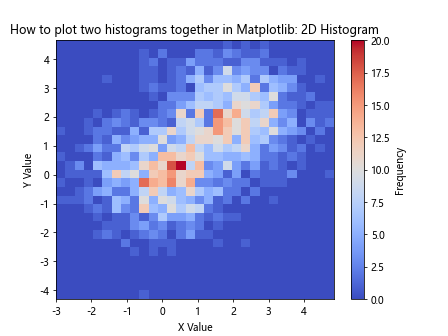
This 2D histogram combines two datasets into a single plot, with color intensity representing frequency.
Comparing Multiple Datasets
When working with multiple datasets, you may need to compare more than two histograms. Here’s how to plot multiple histograms together in Matplotlib:
import matplotlib.pyplot as plt
import numpy as np

# Generate# Generate multiple datasets
data1 = np.random.normal(0, 1, 1000)
data2 = np.random.normal(2, 1, 1000)
data3 = np.random.normal(4, 1, 1000)
data4 = np.random.normal(6, 1, 1000)

# Plot multiple histograms
plt.hist(data1, bins=30, alpha=0.5, label='Data 1')
plt.hist(data2, bins=30, alpha=0.5, label='Data 2')
plt.hist(data3, bins=30, alpha=0.5, label='Data 3')
plt.hist(data4, bins=30, alpha=0.5, label='Data 4')

plt.title('How to plot two histograms together in Matplotlib: Multiple Datasets')
plt.xlabel('Value')
plt.ylabel('Frequency')
plt.legend()
plt.show()
Output:
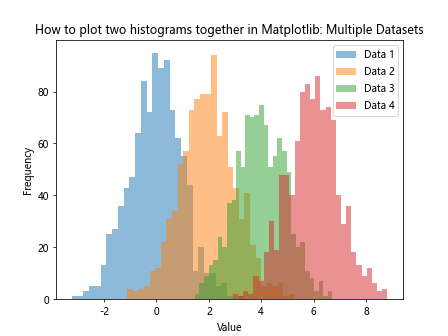
This example demonstrates how to plot four histograms together, but the same principle can be applied to any number of datasets.
Handling Large Datasets
When dealing with large datasets, plotting two histograms together in Matplotlib can become computationally intensive. Here are some strategies to handle large datasets efficiently:
Using bins parameter
Increasing the number of bins can help reveal more detail in large datasets:
import matplotlib.pyplot as plt
import numpy as np

# Generate large datasets
data1 = np.random.normal(0, 1, 1000000)
data2 = np.random.normal(2, 1, 1000000)

# Plot histograms with more bins
plt.hist(data1, bins=100, alpha=0.5, label='Data 1')
plt.hist(data2, bins=100, alpha=0.5, label='Data 2')

plt.title('How to plot two histograms together in Matplotlib: Large Datasets')
plt.xlabel('Value')
plt.ylabel('Frequency')
plt.legend()
plt.show()
Output:
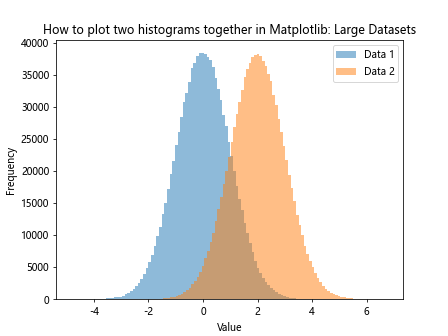
In this example, we use 100 bins to better represent the distribution of large datasets.
Using log scale
For datasets with a wide range of values, using a logarithmic scale can be helpful:
import matplotlib.pyplot as plt
import numpy as np

# Generate datasets with wide range
data1 = np.random.lognormal(0, 1, 1000000)
data2 = np.random.lognormal(0.5, 1, 1000000)

# Plot histograms with log scale
plt.hist(data1, bins=100, alpha=0.5, label='Data 1')
plt.hist(data2, bins=100, alpha=0.5, label='Data 2')

plt.title('How to plot two histograms together in Matplotlib: Log Scale')
plt.xlabel('Value')
plt.ylabel('Frequency')
plt.xscale('log')
plt.yscale('log')
plt.legend()
plt.show()
Output:
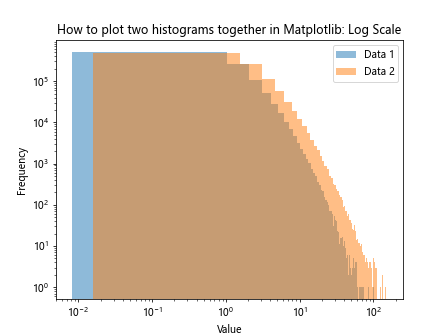
This example uses logarithmic scales on both axes to better visualize data with a wide range of values.
Saving and Exporting Histograms
After learning how to plot two histograms together in Matplotlib, you’ll want to know how to save and export your visualizations. Here’s how to save your histogram plots:
import matplotlib.pyplot as plt
import numpy as np

# Generate two sets of data
data1 = np.random.normal(0, 1, 1000)
data2 = np.random.normal(2, 1, 1000)

# Plot histograms
plt.hist(data1, bins=30, alpha=0.5, label='Data 1')
plt.hist(data2, bins=30, alpha=0.5, label='Data 2')

plt.title('How to plot two histograms together in Matplotlib: Saving Plot')
plt.xlabel('Value')
plt.ylabel('Frequency')
plt.legend()

# Save the plot
plt.savefig('how2matplotlib_com_two_histograms.png', dpi=300, bbox_inches='tight')
plt.show()
Output:
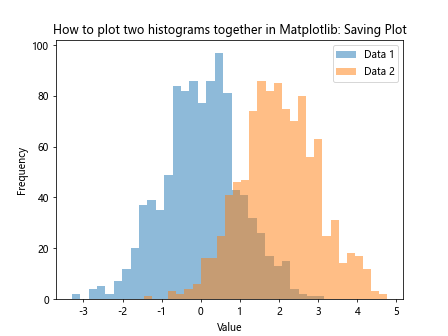
This example saves the plot as a PNG file with a resolution of 300 DPI. The bbox_inches='tight' parameter ensures that the entire plot, including labels, is saved without any unnecessary white space.
Best Practices for Plotting Two Histograms Together
When learning how to plot two histograms together in Matplotlib, it’s important to follow some best practices to ensure your visualizations are clear and informative:
- Choose appropriate bin sizes: The number of bins can significantly affect the appearance of your histograms. Too few bins may obscure important details, while too many can make the plot noisy.
Use transparency: Setting an alpha value less than 1 allows viewers to see overlapping regions clearly.
Use distinct colors: Choose colors that are easily distinguishable to make it clear which histogram represents which dataset.
Include a legend: Always include a legend to identify which histogram corresponds to which dataset.
Label axes clearly: Provide clear and informative labels for both the x and y axes.
Use a title: Include a descriptive title that summarizes what the plot is showing.
Consider normalization: If comparing datasets of different sizes, consider normalizing the histograms.
Use error bars: For statistical analysis, consider adding error bars to your histograms.
Here’s an example that incorporates many of these best practices: