How to Place Legend Outside of the Plot in Matplotlib
How to place legend outside of the plot in Matplotlib is a common task for data visualization enthusiasts. Matplotlib, a powerful plotting library in Python, offers various ways to customize the legend placement, including positioning it outside the plot area. This article will explore different methods and techniques to achieve this, providing detailed explanations and easy-to-understand code examples.
Understanding the Importance of Legend Placement
Before diving into the specifics of how to place legend outside of the plot in Matplotlib, it’s crucial to understand why legend placement is important. A well-placed legend can significantly enhance the readability and interpretation of your plots. When you place the legend outside of the plot, you can:
- Maximize the plot area for data visualization
- Improve clarity, especially for plots with multiple data series
- Avoid overlapping between the legend and important data points
- Create a more professional and polished look for your visualizations
Now, let’s explore various methods to place the legend outside of the plot in Matplotlib.
Method 1: Using the bbox_to_anchor Parameter
One of the most flexible ways to place legend outside of the plot in Matplotlib is by using the bbox_to_anchor parameter. This parameter allows you to specify the exact location of the legend relative to the plot area.
Here’s a simple example to demonstrate this method:
import matplotlib.pyplot as plt

# Create some sample data
x = range(10)
y1 = [i**2 for i in x]
y2 = [i**3 for i in x]

# Create the plot
plt.figure(figsize=(10, 6))
plt.plot(x, y1, label='Square')
plt.plot(x, y2, label='Cube')

# Place the legend outside the plot
plt.legend(bbox_to_anchor=(1.05, 1), loc='upper left', title='How2Matplotlib.com')

# Adjust the layout to prevent clipping
plt.tight_layout()

# Show the plot
plt.show()
Output:
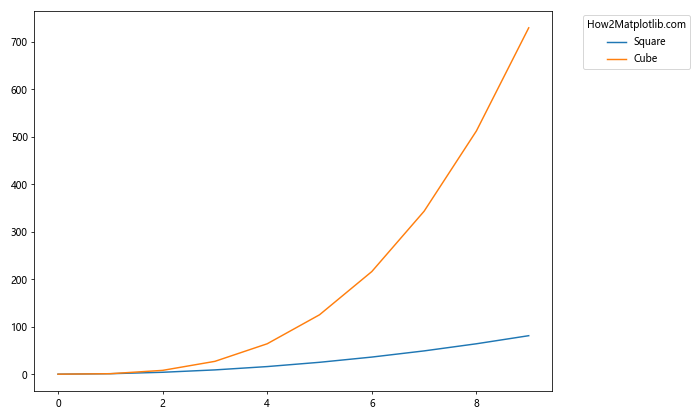
In this example, we use bbox_to_anchor=(1.05, 1) to position the legend outside the plot. The first value (1.05) moves the legend slightly to the right of the plot area, while the second value (1) aligns it with the top of the plot.
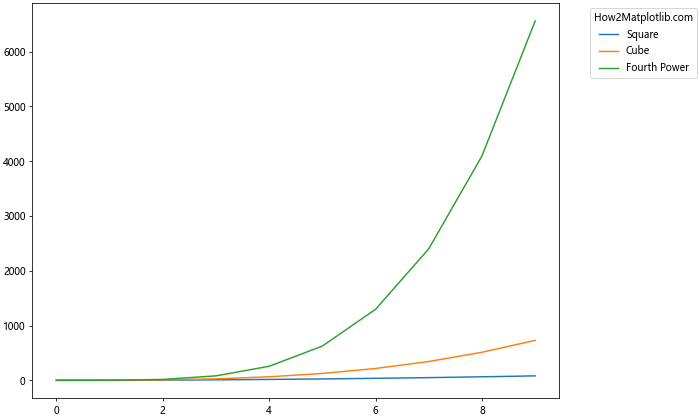
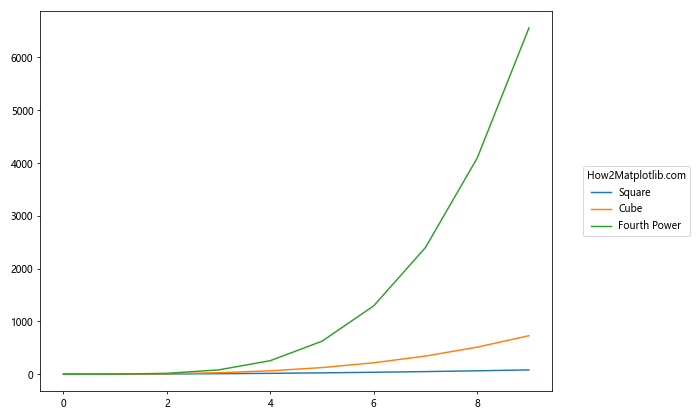
Method 2: Adjusting the Plot Area with subplots_adjust
Another approach to place legend outside of the plot in Matplotlib is by adjusting the plot area using subplots_adjust. This method allows you to create space for the legend by shrinking the plot area.
Here’s an example:
import matplotlib.pyplot as plt

# Create some sample data
x = range(5)
y1 = [i**2 for i in x]
y2 = [i**3 for i in x]
y3 = [i**4 for i in x]

# Create the plot
fig, ax = plt.subplots(figsize=(10, 6))
ax.plot(x, y1, label='Square')
ax.plot(x, y2, label='Cube')
ax.plot(x, y3, label='Fourth Power')

# Adjust the plot area
plt.subplots_adjust(right=0.75)

# Place the legend outside the plot
ax.legend(loc='center left', bbox_to_anchor=(1, 0.5), title='How2Matplotlib.com')

# Show the plot
plt.show()
Output:
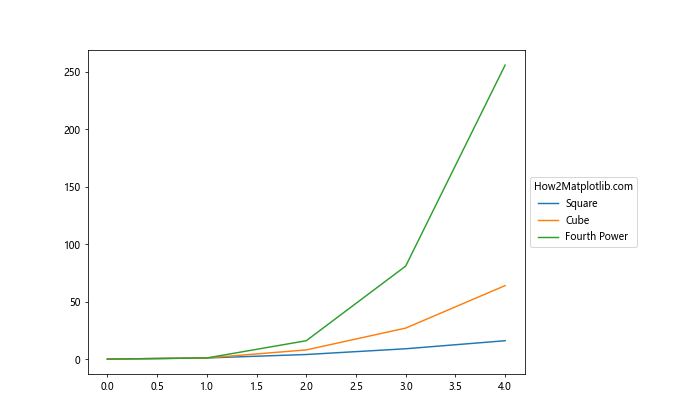
In this example, we use plt.subplots_adjust(right=0.75) to create space on the right side of the plot. Then, we place the legend in this space using bbox_to_anchor=(1, 0.5).
Method 3: Using fig.legend() for Figure-Level Legend
When working with multiple subplots, you might want to place a single legend outside of all the plots. In this case, you can use fig.legend() to create a figure-level legend.
Here’s an example of how to place legend outside of the plot in Matplotlib using this method:
import matplotlib.pyplot as plt

# Create some sample data
x = range(5)
y1 = [i**2 for i in x]
y2 = [i**3 for i in x]

# Create the plot with two subplots
fig, (ax1, ax2) = plt.subplots(2, 1, figsize=(10, 8))

# Plot data on both subplots
ax1.plot(x, y1, label='Square')
ax2.plot(x, y2, label='Cube')

# Remove individual legends
ax1.legend().remove()
ax2.legend().remove()

# Add a figure-level legend
fig.legend(loc='center left', bbox_to_anchor=(1, 0.5), title='How2Matplotlib.com')

# Adjust the layout
plt.tight_layout()

# Show the plot
plt.show()
Output:
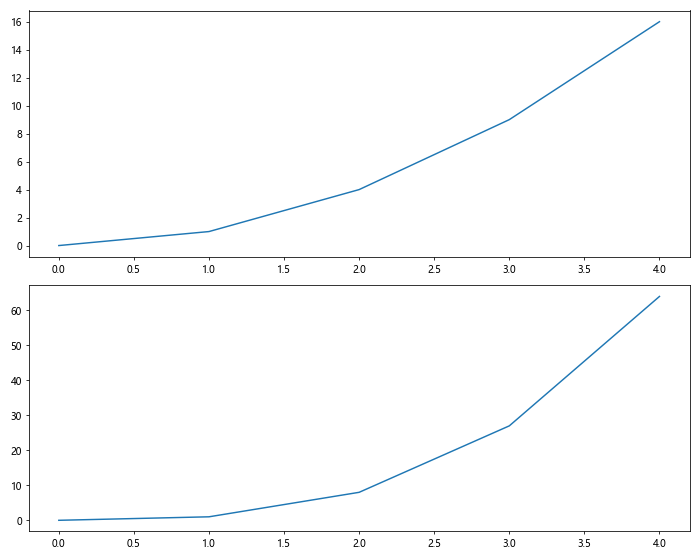
In this example, we create two subplots and then use fig.legend() to place a single legend outside of both plots.
Method 4: Using gridspec for Precise Control
For more precise control over the layout, including legend placement, you can use Matplotlib’s gridspec module. This method allows you to create a custom grid layout for your plots and legend.
Here’s an example of how to place legend outside of the plot in Matplotlib using gridspec:
import matplotlib.pyplot as plt
import matplotlib.gridspec as gridspec

# Create some sample data
x = range(10)
y1 = [i**2 for i in x]
y2 = [i**3 for i in x]
y3 = [i**4 for i in x]

# Create a figure with custom grid layout
fig = plt.figure(figsize=(12, 6))
gs = gridspec.GridSpec(1, 2, width_ratios=[3, 1])

# Create the main plot
ax = fig.add_subplot(gs[0])
ax.plot(x, y1, label='Square')
ax.plot(x, y2, label='Cube')
ax.plot(x, y3, label='Fourth Power')

# Create a separate axes for the legend
legend_ax = fig.add_subplot(gs[1])
legend_ax.axis('off')

# Add the legend to the separate axes
lines = ax.get_lines()
labels = [line.get_label() for line in lines]
legend_ax.legend(lines, labels, loc='center', title='How2Matplotlib.com')

# Show the plot
plt.tight_layout()
plt.show()
Output:
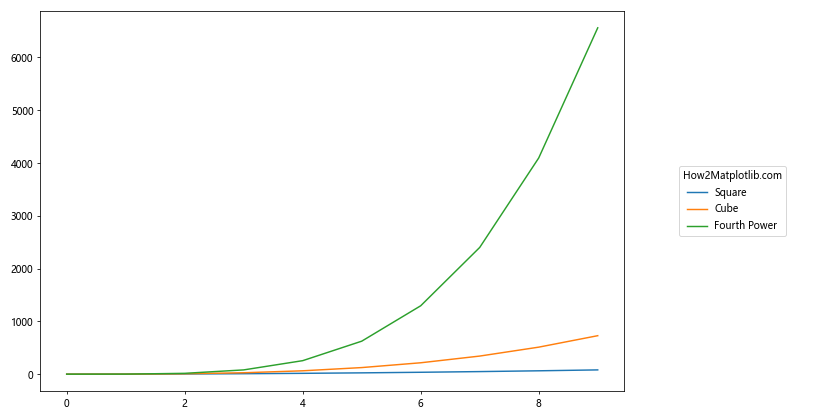
In this example, we create a custom grid layout with two columns: one for the main plot and one for the legend. This gives us precise control over the legend placement.
Method 5: Using constrained_layout
Matplotlib’s constrained_layout is another useful feature that can help you place legend outside of the plot while automatically adjusting the layout to prevent overlapping.
Here’s an example:
import matplotlib.pyplot as plt

# Enable constrained layout
plt.rcParams['figure.constrained_layout.use'] = True

# Create some sample data
x = range(10)
y1 = [i**2 for i in x]
y2 = [i**3 for i in x]
y3 = [i**4 for i in x]

# Create the plot
fig, ax = plt.subplots(figsize=(10, 6))
ax.plot(x, y1, label='Square')
ax.plot(x, y2, label='Cube')
ax.plot(x, y3, label='Fourth Power')

# Place the legend outside the plot
ax.legend(bbox_to_anchor=(1.05, 1), loc='upper left', title='How2Matplotlib.com')

# Show the plot
plt.show()
Output:
In this example, we enable constrained_layout using plt.rcParams['figure.constrained_layout.use'] = True. This automatically adjusts the layout to accommodate the legend placed outside the plot.
Customizing the Legend Appearance
When you place legend outside of the plot in Matplotlib, you might also want to customize its appearance. Matplotlib offers various options to style your legend.
Changing Legend Title
You can change the legend title using the title parameter:
import matplotlib.pyplot as plt

# Create some sample data
x = range(5)
y1 = [i**2 for i in x]
y2 = [i**3 for i in x]

# Create the plot
plt.figure(figsize=(10, 6))
plt.plot(x, y1, label='Square')
plt.plot(x, y2, label='Cube')

# Place the legend outside the plot with a custom title
plt.legend(bbox_to_anchor=(1.05, 1), loc='upper left', title='How2Matplotlib.com\nLegend')

# Adjust the layout
plt.tight_layout()

# Show the plot
plt.show()
Output:
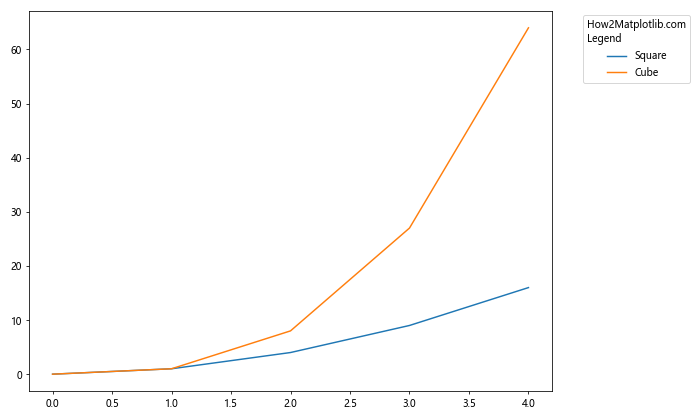
In this example, we set a custom title for the legend using the title parameter.
Styling Legend Text
You can customize the font, size, and color of the legend text:
import matplotlib.pyplot as plt

# Create some sample data
x = range(5)
y1 = [i**2 for i in x]
y2 = [i**3 for i in x]

# Create the plot
plt.figure(figsize=(10, 6))
plt.plot(x, y1, label='Square')
plt.plot(x, y2, label='Cube')

# Place the legend outside the plot with custom text styling
legend = plt.legend(bbox_to_anchor=(1.05, 1), loc='upper left', title='How2Matplotlib.com')
plt.setp(legend.get_texts(), fontsize='12', fontweight='bold')
plt.setp(legend.get_title(), fontsize='14', fontweight='bold')

# Adjust the layout
plt.tight_layout()

# Show the plot
plt.show()
Output:
In this example, we use plt.setp() to set custom font properties for the legend text and title.
Adding a Shadow to the Legend
You can add a shadow effect to make the legend stand out:
import matplotlib.pyplot as plt

# Create some sample data
x = range(5)
y1 = [i**2 for i in x]
y2 = [i**3 for i in x]

# Create the plot
plt.figure(figsize=(10, 6))
plt.plot(x, y1, label='Square')
plt.plot(x, y2, label='Cube')

# Place the legend outside the plot with a shadow
legend = plt.legend(bbox_to_anchor=(1.05, 1), loc='upper left', title='How2Matplotlib.com', shadow=True)

# Adjust the layout
plt.tight_layout()

# Show the plot
plt.show()
Output:
In this example, we add a shadow to the legend by setting shadow=True in the legend() function.
Handling Multiple Legends
Sometimes, you might need to place multiple legends outside of the plot in Matplotlib. This can be useful when you have different categories of data that require separate legends.
Here’s an example of how to handle multiple legends:
import matplotlib.pyplot as plt

# Create some sample data
x = range(5)
y1 = [i**2 for i in x]
y2 = [i**3 for i in x]
y3 = [i**4 for i in x]
y4 = [i**5 for i in x]

# Create the plot
fig, ax = plt.subplots(figsize=(12, 6))

# Plot the data
line1, = ax.plot(x, y1, 'r-', label='Square')
line2, = ax.plot(x, y2, 'b-', label='Cube')
line3, = ax.plot(x, y3, 'g--', label='Fourth Power')
line4, = ax.plot(x, y4, 'm--', label='Fifth Power')

# Create the first legend
first_legend = ax.legend(handles=[line1, line2], bbox_to_anchor=(1.05, 1), loc='upper left', title='How2Matplotlib.com\nPowers')

# Add the first legend to the plot
ax.add_artist(first_legend)

# Create the second legend
ax.legend(handles=[line3, line4], bbox_to_anchor=(1.05, 0.6), loc='center left', title='How2Matplotlib.com\nHigher Powers')

# Adjust the layout
plt.tight_layout()

# Show the plot
plt.show()
Output:
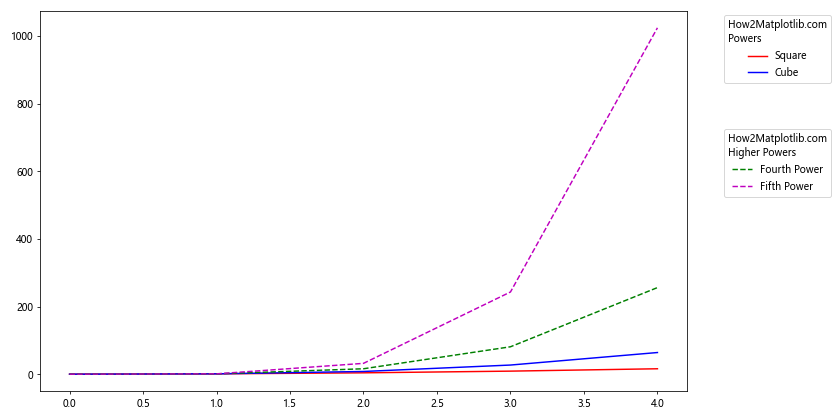
In this example, we create two separate legends and place them at different positions outside the plot.
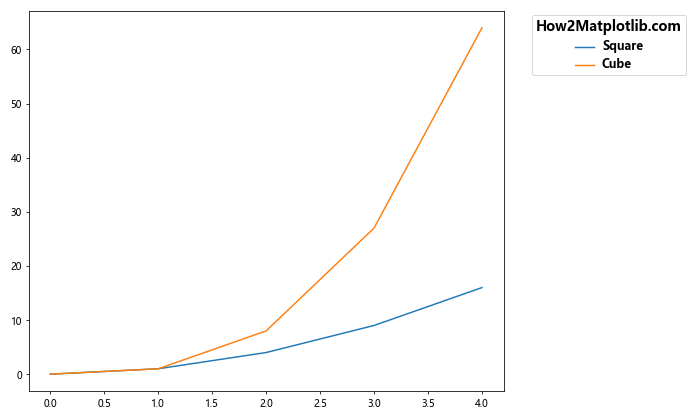
Troubleshooting Common Issues
When you place legend outside of the plot in Matplotlib, you might encounter some common issues. Here are some problems and their solutions:
Issue 1: Legend Gets Clipped
If your legend gets clipped when you place it outside the plot, you can use bbox_inches='tight' when saving the figure:
import matplotlib.pyplot as plt

# Create some sample data
x = range(5)
y1 = [i**2 for i in x]
y2 = [i**3 for i in x]

# Create the plot
plt.figure(figsize=(10, 6))
plt.plot(x, y1, label='Square')
plt.plot(x, y2, label='Cube')

# Place the legend outside the plot
plt.legend(bbox_to_anchor=(1.05, 1), loc='upper left', title='How2Matplotlib.com')

# Save the figure with tight bounding box
plt.savefig('legend_outside_plot.png', bbox_inches='tight')

# Show the plot
plt.show()
Output:
This ensures that the entire figure, including the external legend, is saved without clipping.
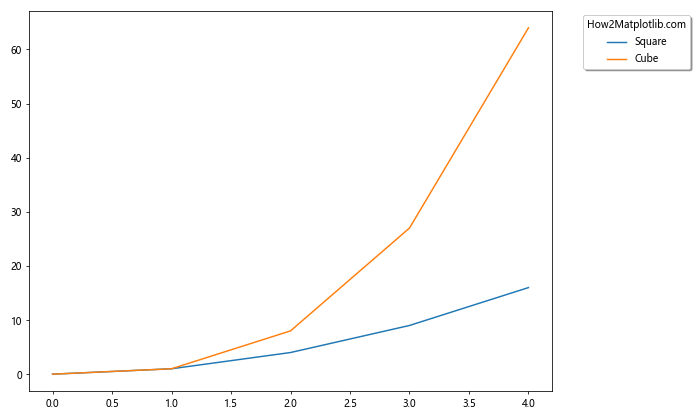
Issue 2: Legend Overlaps with Axis Labels
If the legend overlaps with axis labels when placed outside the plot, you can adjust the plot area:
import matplotlib.pyplot as plt

# Create some sample data
x = range(5)
y1 = [i**2 for i in x]
y2 = [i**3 for i in x]

# Create the plot
fig, ax = plt.subplots(figsize=(10, 6))
ax.plot(x, y1, label='Square')
ax.plot(x, y2, label='Cube')

# Place the legend outside the plot
ax.legend(bbox_to_anchor=(1.05, 1), loc='upper left', title='How2Matplotlib.com')

# Adjust the plot area
plt.subplots_adjust(right=0.75)

# Show the plot
plt.show()
Output:
This creates more space on the right side of the plot for the legend.
Issue 3: Legend Text is Too Small
If the legend text is too small when placed outside the plot, you can adjust its font size:
import matplotlib.pyplot as plt

# Create some sample data
x = range(5)
y1 = [i**2 for i in x]
y2 = [i**3 for i in x]

# Create the plot
plt.figure(figsize=(10, 6))
plt.plot(x, y1, label='Square')
plt.plot(x, y2, label='Cube')

# Place the legend outside the plot with larger font size
legend = plt.legend(bbox_to_anchor=(1.05, 1), loc='upper left', title='How2Matplotlib.com', fontsize=12)
legend.get_title().set_fontsize('14')

# Adjust the layout
plt.tight_layout()

# Show the plot
plt.show()
Output:
This increases the font size of both the legend text and title.
Advanced Techniques for Legend Placement
For more complex visualizations, you might need advanced techniques to place legend outside of the plot in Matplotlib. Here are some advanced methods:
Using inset_axes for Legend Placement
You can use inset_axes to create a separate axes for the legend:
import matplotlib.pyplot as plt
from mpl_toolkits.axes_grid1.inset_locator import inset_axes

# Create some sample data
x = range(10)
y1 = [i**2 for i in x]
y2 = [i**3 for i in x]
y3 = [i**4 for i in x]

# Create the plot
fig, ax = plt.subplots(figsize=(10, 6))
ax.plot(x, y1, label='Square')
ax.plot(x, y2, label='Cube')
ax.plot(x, y3, label='Fourth Power')

# Create an inset axes for the legend
axins = inset_axes(ax, width="30%", height="100%", loc='center left', bbox_to_anchor=(1.05, 0.5, 1, 1), bbox_transform=ax.transAxes)

# Add the legend to the inset axes
ax.legend(bbox_to_anchor=(1.05, 0.5), loc='center left', bbox_transform=ax.transAxes, title='How2Matplotlib.com')

# Remove the inset axes frame
axins.axis('off')

# Adjust the layout
plt.tight_layout()

# Show the plot
plt.show()
Output:
This method gives you more control over the legend’s size and position.
Creating a Custom Legend
For even more flexibility, you can create a custom legend:
import matplotlib.pyplot as plt
import matplotlib.patches as mpatches
# Create some sample data
x = range(5)
y1 = [i**2 for i in x]
y2 = [i**3 for i in x]
# Create the plot
fig, ax = plt.subplots(figsize=(10, 6))
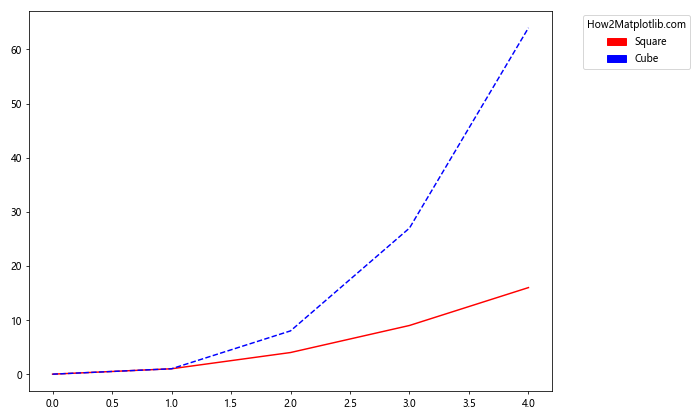
ax.plot(x, y1, 'r-', label='Square')
ax.plot(x, y2, 'b--', label='Cube')
# Create custom legend elements
red_line = mpatches.Patch(color='red', label='Square')
blue_line = mpatches.Patch(color='blue', label='Cube')
# Add the custom legend
ax.legend(handles=[red_line, blue_line], bbox_to_anchor=(1.05, 1), loc='upper left', title='How2Matplotlib.com')
# Adjust the layout
plt.tight_layout()
# Show the plot
plt.show()
Output:
This approach allows you to create legend elements that exactly match your plot elements.
Conclusion
Learning how to place legend outside of the plot in Matplotlib is an essential skill for creating clear and professional-looking visualizations. Throughout this article, we’ve explored various methods to achieve this, from simple techniques using bbox_to_anchor to more advanced approaches using gridspec and custom legend creation.
Remember, the key to effective legend placement is to balance readability with aesthetics. Your legend should enhance the understanding of your plot without detracting from the main data visualization. By following the techniques and best practices outlined in this guide, you’ll be well-equipped to create plots with perfectly placed legends that complement your data storytelling.