How to Plot Complex Numbers in Python Using Matplotlib
How to plot a complex number in Python using Matplotlib is an essential skill for data visualization and mathematical analysis. This article will provide a detailed exploration of various techniques and methods to effectively plot complex numbers using Matplotlib in Python. We’ll cover everything from basic plotting to advanced visualization techniques, ensuring you have a thorough understanding of how to plot complex numbers with Matplotlib.
Understanding Complex Numbers and Their Representation
Before diving into how to plot a complex number in Python using Matplotlib, it’s crucial to understand what complex numbers are and how they are represented. Complex numbers are numbers that consist of a real part and an imaginary part, typically written in the form a + bi, where a is the real part, b is the imaginary part, and i is the imaginary unit (√-1).
In Python, complex numbers are represented using the complex data type. Here’s a simple example of how to create a complex number in Python:
import matplotlib.pyplot as plt

# Creating a complex number
z = 3 + 4j

print(f"Complex number: {z}")
print(f"Real part: {z.real}")
print(f"Imaginary part: {z.imag}")

# Plotting the complex number
plt.figure(figsize=(8, 6))
plt.scatter(z.real, z.imag, color='red', s=100)
plt.axhline(y=0, color='k', linestyle='--')
plt.axvline(x=0, color='k', linestyle='--')
plt.xlabel('Real Part')
plt.ylabel('Imaginary Part')
plt.title('How to plot a complex number in Python using Matplotlib - how2matplotlib.com')
plt.grid(True)
plt.show()
Output:
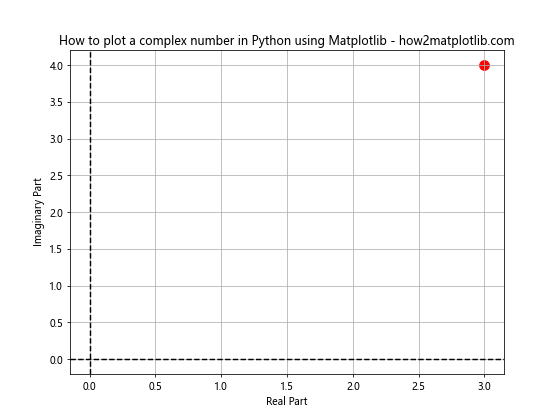
In this example, we create a complex number 3 + 4i and plot it on a 2D plane using Matplotlib. The real part is represented on the x-axis, and the imaginary part on the y-axis.
Basic Plotting of Complex Numbers with Matplotlib
Now that we understand how complex numbers are represented, let’s explore how to plot a complex number in Python using Matplotlib in more detail. Matplotlib provides various functions to visualize complex numbers effectively.
Scatter Plot of Complex Numbers
One of the simplest ways to plot complex numbers is using a scatter plot. Here’s an example of how to plot multiple complex numbers:
import matplotlib.pyplot as plt
import numpy as np

# Generate some complex numbers
complex_numbers = [1+2j, 2+3j, 3+1j, 4+5j, 2-3j]

# Extract real and imaginary parts
real_parts = [z.real for z in complex_numbers]
imag_parts = [z.imag for z in complex_numbers]

plt.figure(figsize=(10, 8))
plt.scatter(real_parts, imag_parts, color='blue', s=100)
plt.axhline(y=0, color='k', linestyle='--')
plt.axvline(x=0, color='k', linestyle='--')
plt.xlabel('Real Part')
plt.ylabel('Imaginary Part')
plt.title('How to plot a complex number in Python using Matplotlib - Scatter Plot - how2matplotlib.com')
plt.grid(True)
plt.show()
Output:
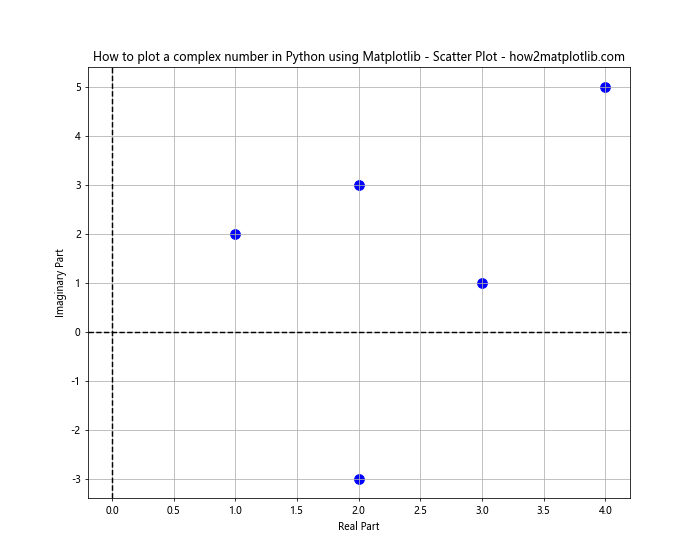
This code creates a scatter plot of multiple complex numbers, clearly showing their positions on the complex plane.
Line Plot of Complex Numbers
Another way to visualize complex numbers, especially when dealing with sequences or functions, is using a line plot. Here’s an example:
import matplotlib.pyplot as plt
import numpy as np

# Generate complex numbers along a path
t = np.linspace(0, 2*np.pi, 100)
z = np.exp(1j * t)

plt.figure(figsize=(10, 8))
plt.plot(z.real, z.imag)
plt.axhline(y=0, color='k', linestyle='--')
plt.axvline(x=0, color='k', linestyle='--')
plt.xlabel('Real Part')
plt.ylabel('Imaginary Part')
plt.title('How to plot a complex number in Python using Matplotlib - Line Plot - how2matplotlib.com')
plt.grid(True)
plt.axis('equal')
plt.show()
Output:
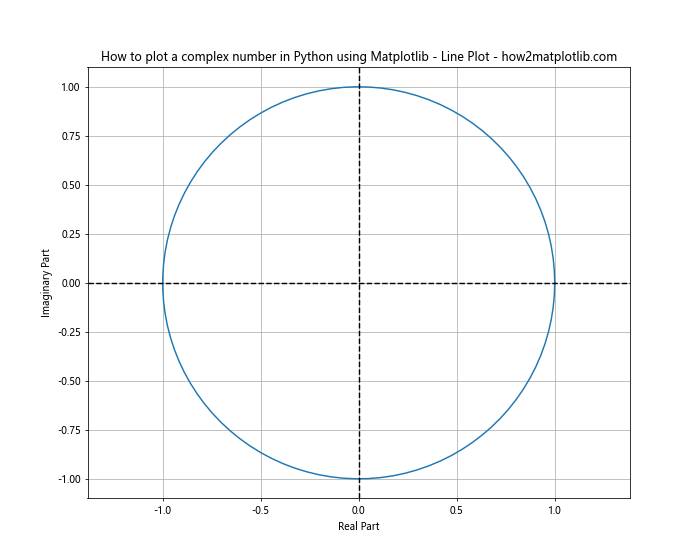
This example plots a unit circle in the complex plane, demonstrating how to visualize complex-valued functions.
Advanced Techniques for Plotting Complex Numbers
As we delve deeper into how to plot a complex number in Python using Matplotlib, let’s explore some more advanced techniques that can enhance our visualizations.
Quiver Plot for Complex Numbers
A quiver plot can be useful for visualizing complex numbers as vectors. Here’s how to create a quiver plot of complex numbers:
import matplotlib.pyplot as plt
import numpy as np

# Generate some complex numbers
complex_numbers = [1+2j, 2+3j, 3+1j, 4+5j, 2-3j]

# Extract real and imaginary parts
real_parts = [z.real for z in complex_numbers]
imag_parts = [z.imag for z in complex_numbers]

plt.figure(figsize=(10, 8))
plt.quiver([0]*len(complex_numbers), [0]*len(complex_numbers), real_parts, imag_parts,
           angles='xy', scale_units='xy', scale=1, color='red')
plt.xlim(-1, 5)
plt.ylim(-4, 6)
plt.axhline(y=0, color='k', linestyle='--')
plt.axvline(x=0, color='k', linestyle='--')
plt.xlabel('Real Part')
plt.ylabel('Imaginary Part')
plt.title('How to plot a complex number in Python using Matplotlib - Quiver Plot - how2matplotlib.com')
plt.grid(True)
plt.show()
Output:
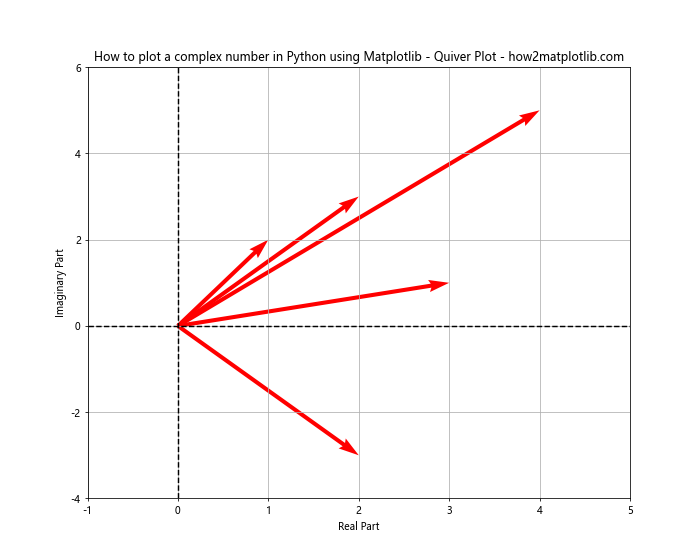
This quiver plot represents each complex number as a vector, providing a clear visualization of both magnitude and direction.
3D Visualization of Complex Functions
For more advanced applications, we can create 3D visualizations of complex functions. Here’s an example of how to plot the absolute value of a complex function:
import matplotlib.pyplot as plt
import numpy as np
from mpl_toolkits.mplot3d import Axes3D

def complex_function(x, y):
    return np.exp(-((x+1j*y)**2))

x = np.linspace(-2, 2, 100)
y = np.linspace(-2, 2, 100)
X, Y = np.meshgrid(x, y)
Z = np.abs(complex_function(X, Y))

fig = plt.figure(figsize=(12, 10))
ax = fig.add_subplot(111, projection='3d')
surf = ax.plot_surface(X, Y, Z, cmap='viridis')
ax.set_xlabel('Real Part')
ax.set_ylabel('Imaginary Part')
ax.set_zlabel('|f(z)|')
ax.set_title('How to plot a complex number in Python using Matplotlib - 3D Plot - how2matplotlib.com')
plt.colorbar(surf)
plt.show()
Output:
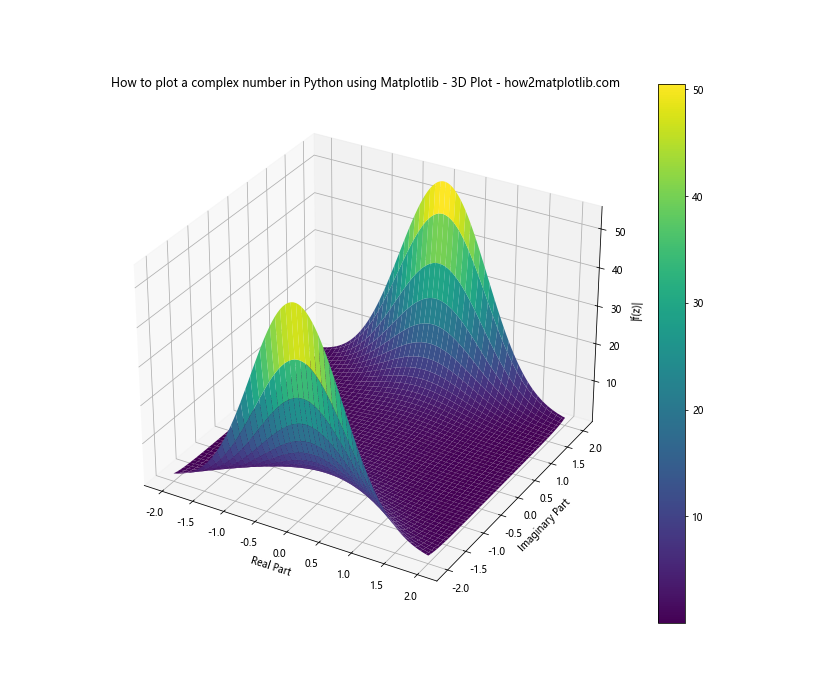
This 3D plot visualizes the absolute value of a complex function, providing insights into its behavior across the complex plane.
Customizing Complex Number Plots
When learning how to plot a complex number in Python using Matplotlib, it’s important to know how to customize your plots for better clarity and aesthetics.
Adding Annotations to Complex Number Plots
Annotations can greatly enhance the readability of your complex number plots. Here’s an example:
import matplotlib.pyplot as plt
import numpy as np

# Generate some complex numbers
complex_numbers = [1+2j, 2+3j, 3+1j, 4+5j, 2-3j]

# Extract real and imaginary parts
real_parts = [z.real for z in complex_numbers]
imag_parts = [z.imag for z in complex_numbers]

plt.figure(figsize=(10, 8))
plt.scatter(real_parts, imag_parts, color='blue', s=100)
for i, z in enumerate(complex_numbers):
    plt.annotate(f'z{i+1}={z:.2f}', (z.real, z.imag), xytext=(5, 5), textcoords='offset points')
plt.axhline(y=0, color='k', linestyle='--')
plt.axvline(x=0, color='k', linestyle='--')
plt.xlabel('Real Part')
plt.ylabel('Imaginary Part')
plt.title('How to plot a complex number in Python using Matplotlib - Annotated Plot - how2matplotlib.com')
plt.grid(True)
plt.show()
Output:
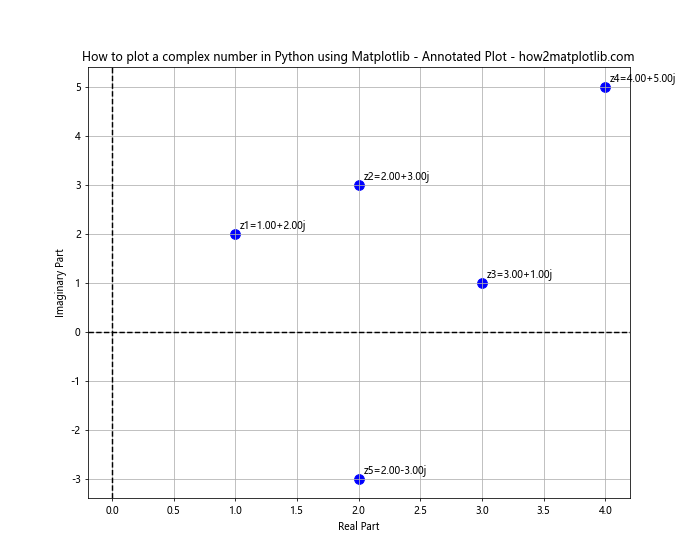
This plot includes annotations for each complex number, making it easier to identify specific points.
Customizing Colors and Styles
Customizing colors and styles can make your complex number plots more visually appealing and easier to interpret. Here’s an example:
import matplotlib.pyplot as plt
import numpy as np

# Generate complex numbers along a spiral
t = np.linspace(0, 4*np.pi, 100)
z = t * np.exp(1j * t)

plt.figure(figsize=(10, 8))
plt.plot(z.real, z.imag, color='purple', linewidth=2, linestyle='--')
plt.scatter(z.real, z.imag, c=t, cmap='viridis', s=50)
plt.axhline(y=0, color='k', linestyle=':')
plt.axvline(x=0, color='k', linestyle=':')
plt.xlabel('Real Part', fontsize=12)
plt.ylabel('Imaginary Part', fontsize=12)
plt.title('How to plot a complex number in Python using Matplotlib - Customized Plot - how2matplotlib.com', fontsize=14)
plt.colorbar(label='t')
plt.grid(True, linestyle=':', alpha=0.7)
plt.show()
Output:
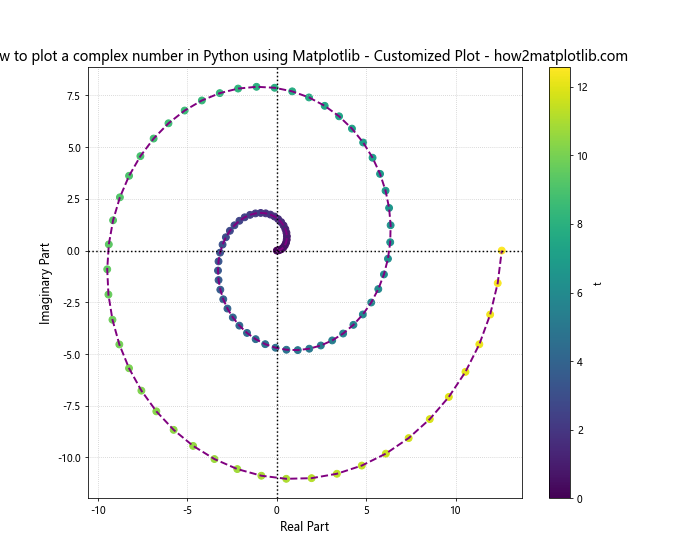
This example demonstrates how to use custom colors, line styles, and additional elements like colorbars to enhance the visualization of complex numbers.
Plotting Complex Number Sequences and Series
Understanding how to plot a complex number in Python using Matplotlib also involves visualizing sequences and series of complex numbers. This can be particularly useful in studying complex-valued functions and their behavior.
Plotting Complex Number Sequences
Here’s an example of how to plot a sequence of complex numbers:
import matplotlib.pyplot as plt
import numpy as np

def complex_sequence(n):
    return [(1 + 1j)**k for k in range(n)]

n = 20
sequence = complex_sequence(n)

plt.figure(figsize=(10, 8))
plt.plot([z.real for z in sequence], [z.imag for z in sequence], 'bo-')
plt.scatter([z.real for z in sequence], [z.imag for z in sequence], c=range(n), cmap='viridis', s=100)
plt.axhline(y=0, color='k', linestyle='--')
plt.axvline(x=0, color='k', linestyle='--')
plt.xlabel('Real Part')
plt.ylabel('Imaginary Part')
plt.title('How to plot a complex number in Python using Matplotlib - Sequence Plot - how2matplotlib.com')
plt.colorbar(label='n')
plt.grid(True)
plt.show()
Output:
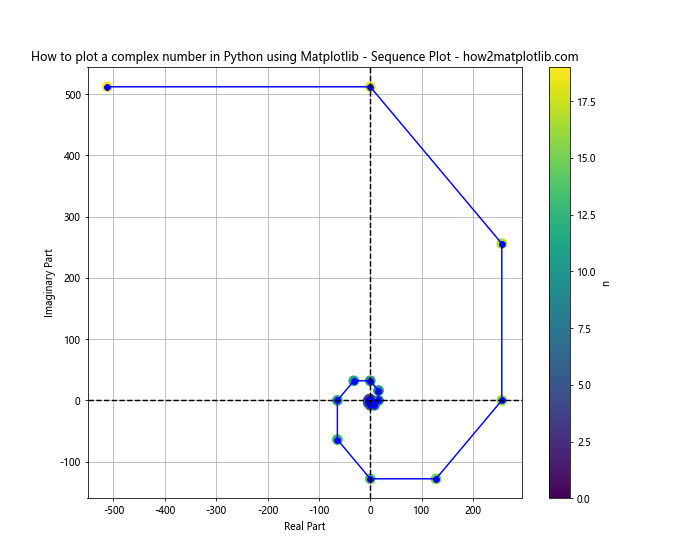
This plot visualizes a sequence of complex numbers, with color indicating the order of the sequence.
Plotting Complex Power Series
Complex power series can also be visualized using Matplotlib. Here’s an example:
import matplotlib.pyplot as plt
import numpy as np

def complex_power_series(z, n):
    return [z**k for k in range(n)]

z = 0.8 + 0.5j
n = 20
series = complex_power_series(z, n)

plt.figure(figsize=(10, 8))
plt.plot([s.real for s in series], [s.imag for s in series], 'ro-')
plt.scatter([s.real for s in series], [s.imag for s in series], c=range(n), cmap='coolwarm', s=100)
plt.axhline(y=0, color='k', linestyle='--')
plt.axvline(x=0, color='k', linestyle='--')
plt.xlabel('Real Part')
plt.ylabel('Imaginary Part')
plt.title('How to plot a complex number in Python using Matplotlib - Power Series Plot - how2matplotlib.com')
plt.colorbar(label='Power')
plt.grid(True)
plt.show()
Output:
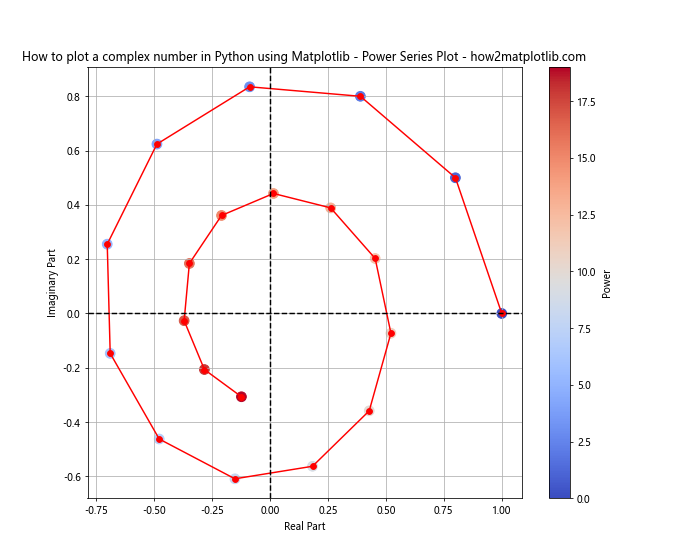
This visualization shows the behavior of a complex number raised to increasing powers, which can be useful in understanding convergence and divergence of complex series.
Visualizing Complex Functions
When exploring how to plot a complex number in Python using Matplotlib, it’s important to consider visualizing entire complex functions. This can provide insights into the behavior of complex-valued functions across the complex plane.
Domain Coloring
Domain coloring is a powerful technique for visualizing complex functions. Here’s an example:
import matplotlib.pyplot as plt
import numpy as np

def complex_function(z):
    return z**2 + 1

x = np.linspace(-2, 2, 500)
y = np.linspace(-2, 2, 500)
X, Y = np.meshgrid(x, y)
Z = X + 1j*Y

W = complex_function(Z)
phase = np.angle(W)
magnitude = np.abs(W)

plt.figure(figsize=(12, 10))
plt.imshow(phase, extent=[-2, 2, -2, 2], cmap='hsv', aspect='equal')
plt.title('How to plot a complex number in Python using Matplotlib - Domain Coloring - how2matplotlib.com')
plt.xlabel('Real Part')
plt.ylabel('Imaginary Part')
plt.colorbar(label='Phase')
plt.show()
Output:
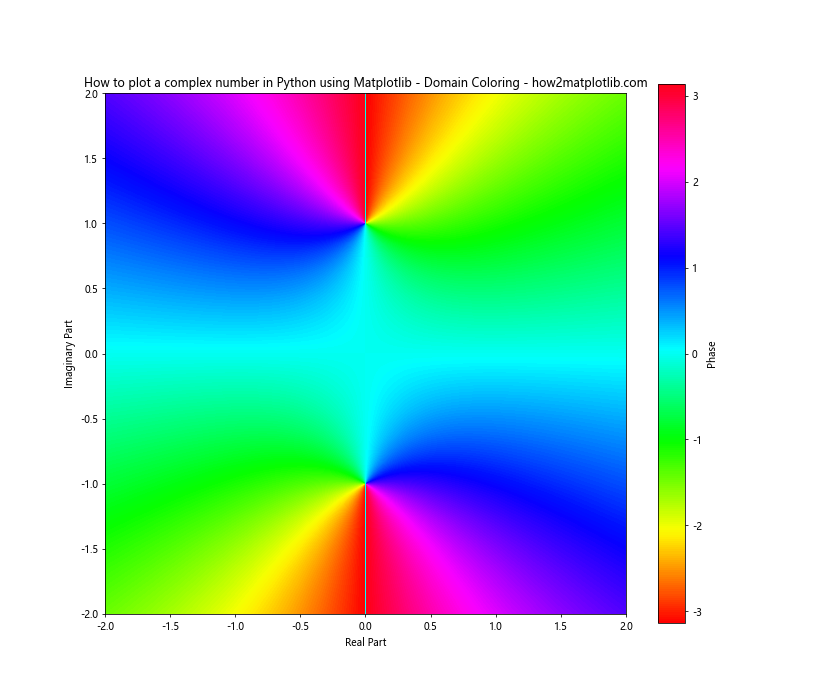
This plot uses color to represent the phase of the complex function, providing a comprehensive view of its behavior across the complex plane.
Contour Plot of Complex Functions
Contour plots can be useful for visualizing the magnitude of complex functions. Here’s an example:
import matplotlib.pyplot as plt
import numpy as np

def complex_function(z):
    return np.sin(z)

x = np.linspace(-5, 5, 200)
y = np.linspace(-5, 5, 200)
X, Y = np.meshgrid(x, y)
Z = X + 1j*Y

W = complex_function(Z)
magnitude = np.abs(W)

plt.figure(figsize=(12, 10))
contour = plt.contourf(X, Y, magnitude, levels=20, cmap='viridis')
plt.colorbar(contour, label='Magnitude')
plt.title('How to plot a complex number in Python using Matplotlib - Contour Plot - how2matplotlib.com')
plt.xlabel('Real Part')
plt.ylabel('Imaginary Part')
plt.show()
Output:
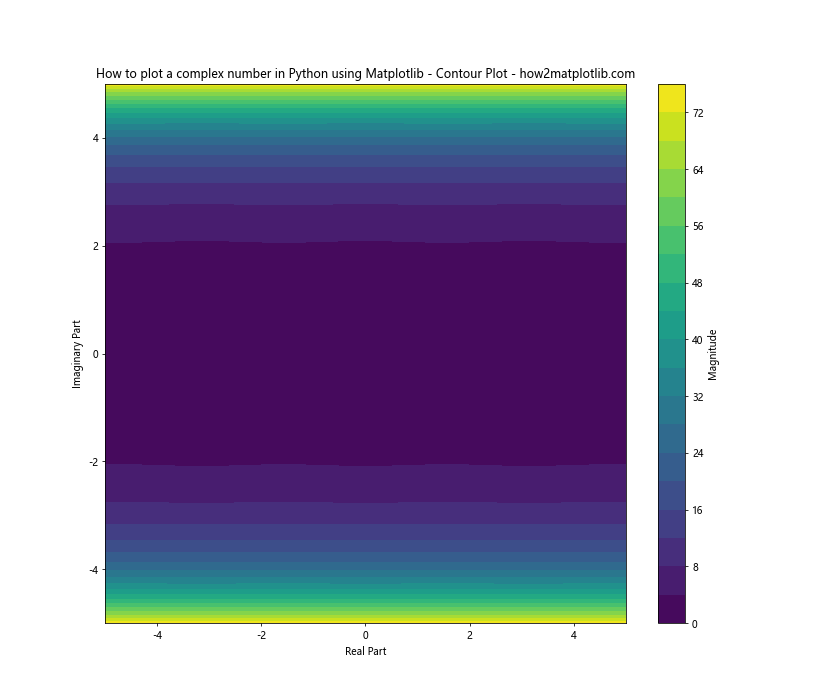
This contour plot visualizes the magnitude of a complex function, allowing us to see how it varies across the complex plane.
Advanced Applications of Complex Number Plotting
As we continue to explore how to plot a complex number in Python using Matplotlib, let’s look at some advanced applications that demonstrate the power and versatility of these visualization techniques.
Plotting Complex Dynamical Systems
Complex dynamical systems, such as the Mandelbrot set, can be visualized using complex number plotting techniques. Here’s an example of how to plot the Mandelbrot set:
import matplotlib.pyplot as plt
import numpy as np

def mandelbrot(h, w, max_iter):
    y, x = np.ogrid[-1.4:1.4:h*1j, -2:0.8:w*1j]
    c = x + y*1j
    z = c
    divtime = max_iter + np.zeros(z.shape, dtype=int)

    for i in range(max_iter):
        z = z**2 + c
        diverge = z*np.conj(z) > 2**2
        div_now = diverge & (divtime == max_iter)
        divtime[div_now] = i
        z[diverge] = 2

    return divtime

h, w = 1000, 1500
max_iter = 100

plt.figure(figsize=(12, 8))
plt.imshow(mandelbrot(h, w, max_iter), cmap='hot', extent=[-2, 0.8, -1.4, 1.4])
plt.title('How to plot a complex number in Python using Matplotlib - Mandelbrot Set - how2matplotlib.com')
plt.xlabel('Real Part')
plt.ylabel('Imaginary Part')
plt.colorbar(label='Iteration count')
plt.show()
Output:
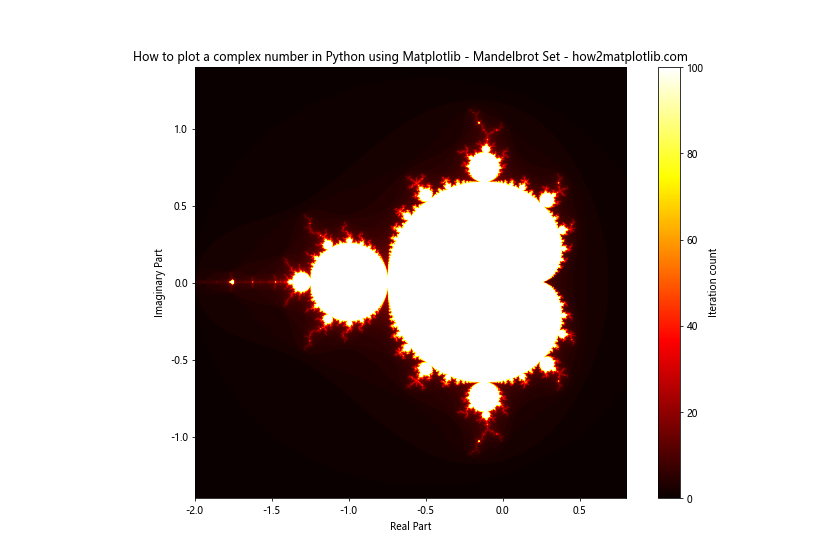
This visualization of the Mandelbrot set demonstrates how complex number plotting can be used to explore fascinating mathematical structures.
Combining Real and Complex Plots
Sometimes, it’s useful to combine plots of real and complex numbers to show relationships between them. Here’s an example of how to create a subplot with both real and complex parts:
import matplotlib.pyplot as plt
import numpy as np

def complex_function(t):
    return np.exp(1j * t)

t = np.linspace(0, 2*np.pi, 100)
z = complex_function(t)

fig, (ax1, ax2) = plt.subplots(1, 2, figsize=(15, 6))

# Real part plot
ax1.plot(t, z.real, label='Real Part')
ax1.plot(t, z.imag, label='Imaginary Part')
ax1.set_xlabel('t')
ax1.set_ylabel('Value')
ax1.set_title('Real and Imaginary Parts')
ax1.legend()
ax1.grid(True)

# Complex plane plot
ax2.plot(z.real, z.imag)
ax2.set_xlabel('Real Part')
ax2.set_ylabel('Imaginary Part')
ax2.set_title('Complex Plane')
ax2.grid(True)
ax2.axis('equal')

plt.suptitle('How to plot a complex number in Python using Matplotlib - Combined Plot - how2matplotlib.com')
plt.tight_layout()
plt.show()
Output:
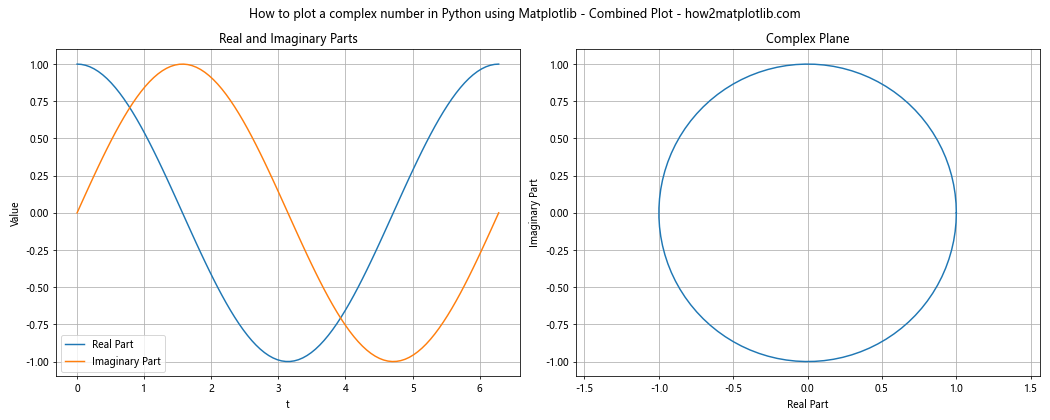
This combined plot shows both the real and imaginary parts of a complex function over time, as well as its path in the complex plane.
Animating Complex Number Plots
Animation can be a powerful tool for understanding the behavior of complex numbers and functions. Here’s an example of how to create an animated plot of a rotating complex number:
import matplotlib.pyplot as plt
import numpy as np
from matplotlib.animation import FuncAnimation

fig, ax = plt.subplots(figsize=(8, 8))
ax.set_xlim(-1.5, 1.5)
ax.set_ylim(-1.5, 1.5)
ax.set_xlabel('Real Part')
ax.set_ylabel('Imaginary Part')
ax.set_title('How to plot a complex number in Python using Matplotlib - Animation - how2matplotlib.com')
ax.grid(True)

line, = ax.plot([], [], 'ro-', lw=2)
point, = ax.plot([], [], 'bo', markersize=10)

def init():
    line.set_data([], [])
    point.set_data([], [])
    return line, point

def animate(i):
    t = i * 0.1
    z = np.exp(1j * t)
    x = [0, z.real]
    y = [0, z.imag]
    line.set_data(x, y)
    point.set_data(z.real, z.imag)
    return line, point

anim = FuncAnimation(fig, animate, init_func=init, frames=63, interval=50, blit=True)
plt.show()
Output:
This animation shows a complex number rotating around the unit circle, providing a dynamic visualization of complex number behavior.
Best Practices for Plotting Complex Numbers
When learning how to plot a complex number in Python using Matplotlib, it’s important to follow some best practices to ensure your visualizations are clear and informative:
- Always label your axes clearly, indicating which axis represents the real part and which represents the imaginary part.
- Use appropriate scales for your plots. The
plt.axis('equal')command can be useful to ensure that the real and imaginary axes have the same scale. - Use color and size to convey additional information about your complex numbers, such as magnitude or order in a sequence.
- Include a legend when plotting multiple sets of complex numbers or functions.
- Use appropriate plot types for your data. Scatter plots are good for discrete complex numbers, while line plots work well for continuous complex functions.
- Consider using 3D plots or color mapping techniques for visualizing complex functions over a region of the complex plane.
- Add gridlines to your plots to make it easier to read the values of complex numbers.
- Use annotations to highlight specific points of interest in your complex number plots.
Conclusion
Learning how to plot a complex number in Python using Matplotlib opens up a world of possibilities for visualizing and understanding complex-valued data and functions. From basic scatter plots to advanced techniques like domain coloring and animated visualizations, Matplotlib provides a powerful toolkit for exploring the complex plane.
By mastering these techniques, you’ll be able to create insightful visualizations that can help in various fields, including signal processing, control systems, quantum mechanics, and many areas of pure and applied mathematics.
Remember that the key to effective visualization of complex numbers is to choose the right technique for your specific data and to present the information clearly and intuitively. With practice and experimentation, you’ll develop the skills to create compelling and informative visualizations of complex numbers and functions.