How to Plot a Smooth Curve in Matplotlib
How to Plot a Smooth Curve in Matplotlib is an essential skill for data visualization enthusiasts and professionals alike. Matplotlib, a powerful Python library for creating static, animated, and interactive visualizations, offers various techniques to plot smooth curves. This article will delve deep into the methods and best practices for creating visually appealing and accurate smooth curves using Matplotlib.
Understanding the Importance of Smooth Curves in Data Visualization
Before we dive into the specifics of how to plot a smooth curve in Matplotlib, it’s crucial to understand why smooth curves are important in data visualization. Smooth curves help in:
- Reducing visual noise
- Highlighting trends and patterns
- Improving the overall aesthetics of the plot
- Making data more interpretable
When dealing with scattered data points or noisy measurements, plotting a smooth curve can help reveal underlying patterns that might not be immediately apparent from raw data points.
Basic Concepts for Plotting Smooth Curves in Matplotlib
To effectively plot a smooth curve in Matplotlib, you need to understand some fundamental concepts:
- Interpolation: The process of estimating values between known data points.
- Splines: Mathematical functions used to create smooth curves.
- Curve fitting: The process of finding a curve that best fits a set of data points.
Let’s start with a simple example of how to plot a smooth curve in Matplotlib using basic interpolation:
import numpy as np
import matplotlib.pyplot as plt

# Generate some sample data
x = np.linspace(0, 10, 20)
y = np.sin(x) + np.random.random(20) * 0.2

# Create a smooth curve using more points
x_smooth = np.linspace(0, 10, 200)
y_smooth = np.interp(x_smooth, x, y)

# Plot the original data and the smooth curve
plt.figure(figsize=(10, 6))
plt.scatter(x, y, label='Original Data')
plt.plot(x_smooth, y_smooth, 'r-', label='Smooth Curve')
plt.title('How to Plot a Smooth Curve in Matplotlib - Basic Interpolation')
plt.xlabel('X-axis')
plt.ylabel('Y-axis')
plt.legend()
plt.text(5, 0.5, 'how2matplotlib.com', fontsize=12, alpha=0.7)
plt.show()
Output:
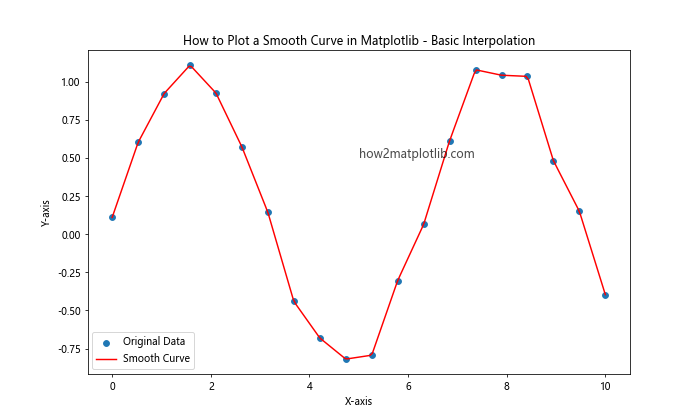
In this example, we use NumPy’s interp function to create a smooth curve from scattered data points. The linspace function generates evenly spaced points for a smoother appearance.
Using Splines to Plot Smooth Curves in Matplotlib
Splines are a popular method for creating smooth curves in Matplotlib. They offer more flexibility and control over the curve’s shape compared to simple interpolation. Let’s explore how to use splines to plot a smooth curve:
import numpy as np
import matplotlib.pyplot as plt
from scipy.interpolate import make_interp_spline

# Generate sample data
x = np.array([0, 1, 2, 3, 4, 5])
y = np.array([0, 2, 1, 3, 7, 4])

# Create a B-spline representation of the curve
x_smooth = np.linspace(x.min(), x.max(), 300)
spl = make_interp_spline(x, y, k=3)
y_smooth = spl(x_smooth)

# Plot the original data and the smooth curve
plt.figure(figsize=(10, 6))
plt.scatter(x, y, color='blue', label='Original Data')
plt.plot(x_smooth, y_smooth, 'r-', label='Smooth Curve (Spline)')
plt.title('How to Plot a Smooth Curve in Matplotlib - Using Splines')
plt.xlabel('X-axis')
plt.ylabel('Y-axis')
plt.legend()
plt.text(2.5, 3.5, 'how2matplotlib.com', fontsize=12, alpha=0.7)
plt.show()
Output:
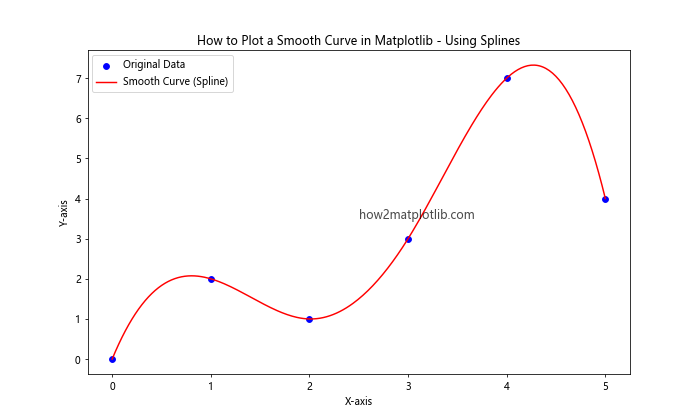
In this example, we use SciPy’s make_interp_spline function to create a B-spline representation of the curve. The k parameter determines the degree of the spline (3 for cubic splines).
Curve Fitting Techniques for Smooth Curves in Matplotlib
Another approach to plot a smooth curve in Matplotlib is through curve fitting. This method is particularly useful when you want to find a mathematical function that best represents your data. Let’s look at an example using polynomial curve fitting:
import numpy as np
import matplotlib.pyplot as plt

# Generate sample data
x = np.linspace(0, 10, 20)
y = 3 * x**2 + 2 * x + 5 + np.random.normal(0, 10, 20)

# Fit a polynomial curve
coeffs = np.polyfit(x, y, 2)
poly = np.poly1d(coeffs)

# Generate points for the smooth curve
x_smooth = np.linspace(0, 10, 200)
y_smooth = poly(x_smooth)

# Plot the original data and the smooth curve
plt.figure(figsize=(10, 6))
plt.scatter(x, y, label='Original Data')
plt.plot(x_smooth, y_smooth, 'r-', label='Smooth Curve (Polynomial Fit)')
plt.title('How to Plot a Smooth Curve in Matplotlib - Polynomial Curve Fitting')
plt.xlabel('X-axis')
plt.ylabel('Y-axis')
plt.legend()
plt.text(5, 200, 'how2matplotlib.com', fontsize=12, alpha=0.7)
plt.show()
Output:
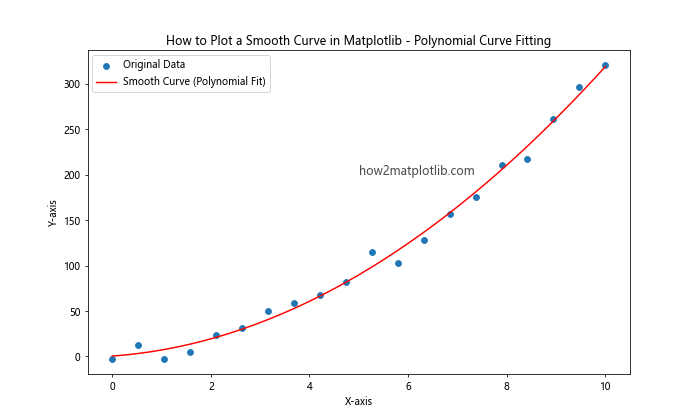
This example demonstrates how to use NumPy’s polyfit and poly1d functions to create a smooth curve that fits the original data points.
Advanced Techniques for Plotting Smooth Curves in Matplotlib
As we delve deeper into how to plot a smooth curve in Matplotlib, let’s explore some advanced techniques that can help you create more sophisticated and visually appealing curves.
Using Bezier Curves
Bezier curves are parametric curves frequently used in computer graphics and data visualization. They can create smooth, aesthetically pleasing curves. Here’s how to implement a Bezier curve in Matplotlib:
import numpy as np
import matplotlib.pyplot as plt

def bezier_curve(points, num=200):
    t = np.linspace(0, 1, num)
    n = len(points) - 1
    curve = np.zeros((num, 2))
    for i in range(n + 1):
        curve += np.outer(np.power(1 - t, n - i) * np.power(t, i) *
                          (np.math.factorial(n) / (np.math.factorial(i) * np.math.factorial(n - i))),
                          points[i])
    return curve

# Define control points
points = np.array([(0, 0), (1, 4), (3, 2), (4, 6)])

# Generate Bezier curve
curve = bezier_curve(points)

# Plot the curve and control points
plt.figure(figsize=(10, 6))
plt.plot(curve[:, 0], curve[:, 1], 'r-', label='Bezier Curve')
plt.scatter(points[:, 0], points[:, 1], color='blue', label='Control Points')
plt.title('How to Plot a Smooth Curve in Matplotlib - Bezier Curve')
plt.xlabel('X-axis')
plt.ylabel('Y-axis')
plt.legend()
plt.text(2, 3, 'how2matplotlib.com', fontsize=12, alpha=0.7)
plt.show()
Output:
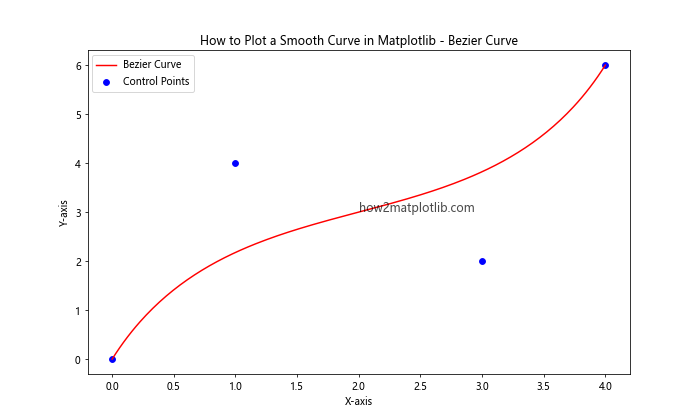
This example demonstrates how to create a Bezier curve using control points. The bezier_curve function calculates the points on the curve based on the given control points.
Smoothing with Moving Averages
Moving averages can be an effective way to smooth out noisy data and plot a smooth curve. Here’s an example of how to use a simple moving average to create a smooth curve:
import numpy as np
import matplotlib.pyplot as plt

def moving_average(data, window_size):
    return np.convolve(data, np.ones(window_size), 'valid') / window_size

# Generate noisy data
x = np.linspace(0, 10, 100)
y = np.sin(x) + np.random.normal(0, 0.2, 100)

# Apply moving average
window_size = 10
y_smooth = moving_average(y, window_size)
x_smooth = x[window_size-1:]

# Plot original data and smoothed curve
plt.figure(figsize=(10, 6))
plt.plot(x, y, 'b-', alpha=0.5, label='Original Data')
plt.plot(x_smooth, y_smooth, 'r-', label='Smooth Curve (Moving Average)')
plt.title('How to Plot a Smooth Curve in Matplotlib - Moving Average')
plt.xlabel('X-axis')
plt.ylabel('Y-axis')
plt.legend()
plt.text(5, 0.5, 'how2matplotlib.com', fontsize=12, alpha=0.7)
plt.show()
Output:
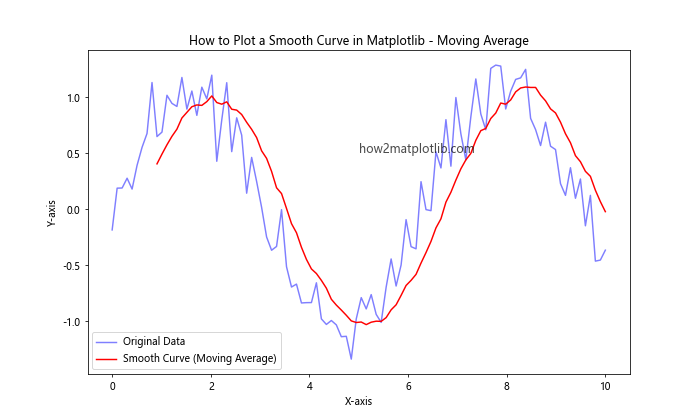
This example uses a simple moving average to smooth out noisy data. The moving_average function applies the smoothing, and we plot both the original and smoothed data.
Customizing Smooth Curves in Matplotlib
When learning how to plot a smooth curve in Matplotlib, it’s important to understand how to customize the appearance of your curves. Matplotlib offers a wide range of options for customization.
Adjusting Line Styles and Colors
You can easily change the style and color of your smooth curves to make them more visually appealing or to distinguish between multiple curves:
import numpy as np
import matplotlib.pyplot as plt

# Generate data
x = np.linspace(0, 10, 100)
y1 = np.sin(x)
y2 = np.cos(x)

# Plot smooth curves with different styles and colors
plt.figure(figsize=(10, 6))
plt.plot(x, y1, 'r-', linewidth=2, label='Sine Curve')
plt.plot(x, y2, 'b--', linewidth=2, label='Cosine Curve')
plt.title('How to Plot a Smooth Curve in Matplotlib - Custom Styles')
plt.xlabel('X-axis')
plt.ylabel('Y-axis')
plt.legend()
plt.text(5, 0, 'how2matplotlib.com', fontsize=12, alpha=0.7)
plt.grid(True, linestyle=':', alpha=0.7)
plt.show()
Output:
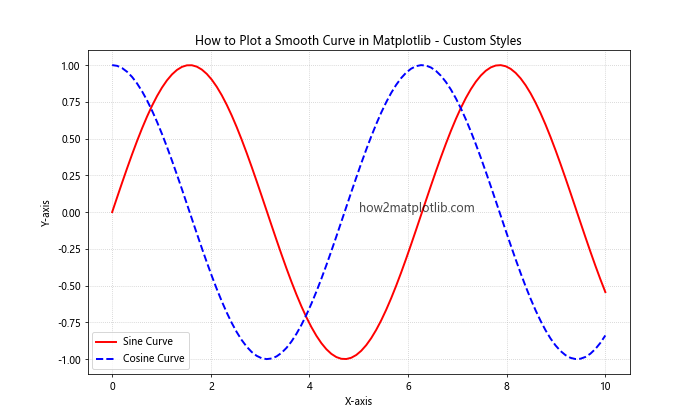
In this example, we use different colors and line styles for two smooth curves. The linewidth parameter controls the thickness of the lines.
Adding Markers to Smooth Curves
Sometimes, you may want to highlight specific points on your smooth curve. You can do this by adding markers:
import numpy as np
import matplotlib.pyplot as plt

# Generate data
x = np.linspace(0, 2*np.pi, 20)
y = np.sin(x)

# Plot smooth curve with markers
plt.figure(figsize=(10, 6))
plt.plot(x, y, 'g-', marker='o', markersize=8, markerfacecolor='white', markeredgecolor='green', label='Sine Curve')
plt.title('How to Plot a Smooth Curve in Matplotlib - With Markers')
plt.xlabel('X-axis')
plt.ylabel('Y-axis')
plt.legend()
plt.text(3, 0, 'how2matplotlib.com', fontsize=12, alpha=0.7)
plt.grid(True, linestyle='--', alpha=0.5)
plt.show()
Output:
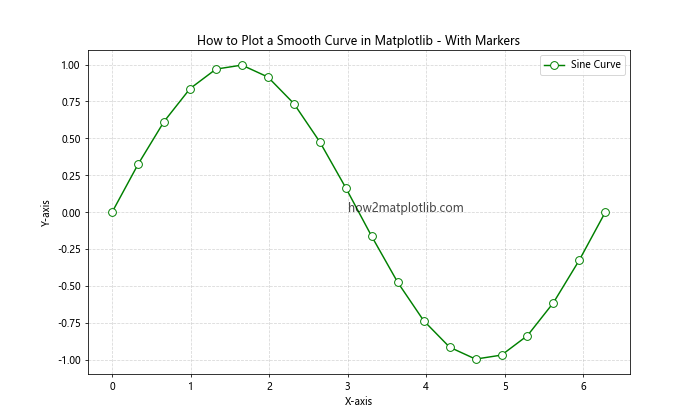
This example shows how to add markers to a smooth curve. The marker parameter specifies the marker shape, while markersize, markerfacecolor, and markeredgecolor control its appearance.
Handling Multiple Smooth Curves in Matplotlib
Often, you’ll need to plot multiple smooth curves on the same graph. Matplotlib makes this easy and provides various ways to distinguish between different curves.
Plotting Multiple Curves with Different Colors
Here’s an example of how to plot multiple smooth curves with different colors:
import numpy as np
import matplotlib.pyplot as plt

# Generate data
x = np.linspace(0, 10, 100)
y1 = np.sin(x)
y2 = np.cos(x)
y3 = np.tan(x)

# Plot multiple smooth curves
plt.figure(figsize=(10, 6))
plt.plot(x, y1, 'r-', label='Sine')
plt.plot(x, y2, 'g-', label='Cosine')
plt.plot(x, y3, 'b-', label='Tangent')
plt.title('How to Plot a Smooth Curve in Matplotlib - Multiple Curves')
plt.xlabel('X-axis')
plt.ylabel('Y-axis')
plt.legend()
plt.text(5, 0, 'how2matplotlib.com', fontsize=12, alpha=0.7)
plt.ylim(-2, 2)  # Limit y-axis for better visibility
plt.grid(True, linestyle=':', alpha=0.7)
plt.show()
Output:
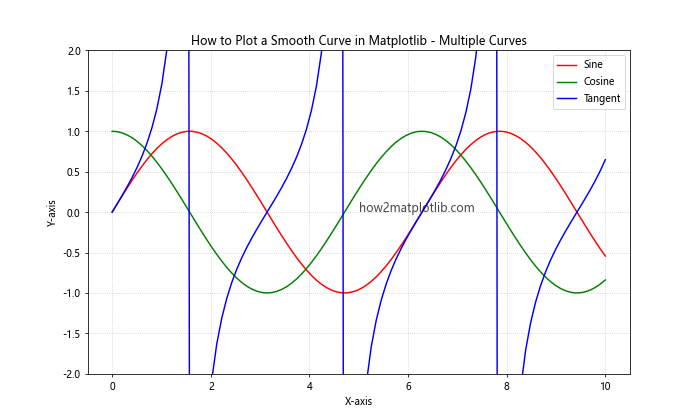
This example demonstrates how to plot three different trigonometric functions as smooth curves, each with a different color.
Using a Colormap for Multiple Curves
For a large number of curves, using a colormap can be an effective way to distinguish between them:
import numpy as np
import matplotlib.pyplot as plt

# Generate data
x = np.linspace(0, 10, 100)
curves = [np.sin(x + phase) for phase in np.linspace(0, 2*np.pi, 10)]

# Plot multiple smooth curves using a colormap
plt.figure(figsize=(10, 6))
cm = plt.get_cmap('viridis')
for i, curve in enumerate(curves):
    plt.plot(x, curve, color=cm(i/len(curves)), label=f'Curve {i+1}')

plt.title('How to Plot a Smooth Curve in Matplotlib - Colormap')
plt.xlabel('X-axis')
plt.ylabel('Y-axis')
plt.legend(loc='center left', bbox_to_anchor=(1, 0.5))
plt.text(5, 0, 'how2matplotlib.com', fontsize=12, alpha=0.7)
plt.tight_layout()
plt.show()
Output:
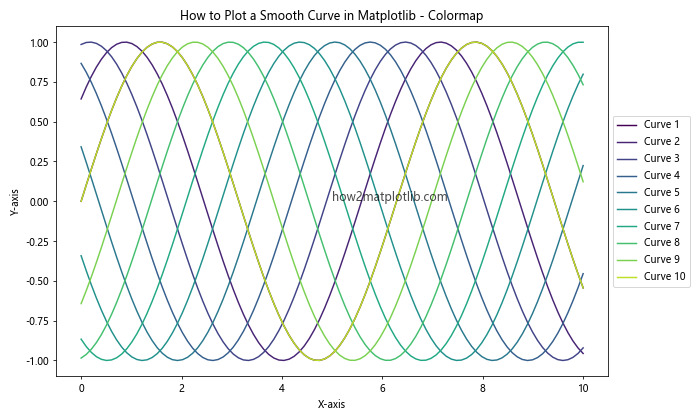
This example shows how to use a colormap to assign colors to multiple smooth curves, making it easier to distinguish between them.
Advanced Smoothing Techniques in Matplotlib
As we continue to explore how to plot a smooth curve in Matplotlib, let’s look at some more advanced smoothing techniques that can be particularly useful for complex or noisy data.
Savitzky-Golay Filter
The Savitzky-Golay filter is a digital filter that can be applied to a set of digital data points to smooth the data without greatly distorting the signal. It’s particularly useful for smoothing noisy data with a large number of data points. Here’s how to use it in Matplotlib:
import numpy as np
import matplotlib.pyplot as plt
from scipy.signal import savgol_filter

# Generate noisy data
x = np.linspace(0, 10, 100)
y = np.sin(x) + np.random.normal(0, 0.2, 100)

# Apply Savitzky-Golay filter
window_length = 51  # must be odd
poly_order = 3
y_smooth = savgol_filter(y, window_length, poly_order)

# Plot original and smoothed data
plt.figure(figsize=(10, 6))
plt.plot(x, y, 'b-', alpha=0.5, label='Original Data')
plt.plot(x, y_smooth, 'r-', label='Smooth Curve (Savitzky-Golay)')
plt.title('How to Plot a Smooth Curve in Matplotlib - Savitzky-Golay Filter')
plt.xlabel('X-axis')
plt.ylabel('Y-axis')
plt.legend()
plt.text(5, 0.5, 'how2matplotlib.com', fontsize=12, alpha=0.7)
plt.show()
Output:
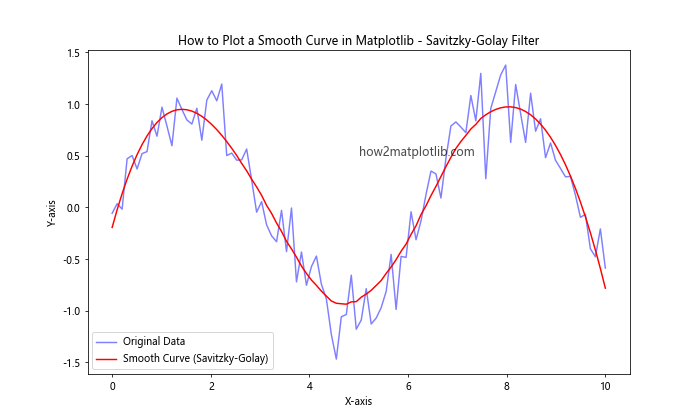
In this example, we use the Savitzky-Golay filter from SciPy to smooth noisy data. The window_length and poly_order parameters control the smoothing process.
Locally Weighted Scatterplot Smoothing (LOWESS)
LOWESS is a non-parametric regression method that combines multiple regression models in a k-nearest-neighbor-based meta-model. It’s particularly useful for smoothing scatter plots. Here’s how to implement LOWESS smoothing in Matplotlib:
import numpy as np
import matplotlib.pyplot as plt
from statsmodels.nonparametric.smoothers_lowess import lowess

# Generate noisy data
x = np.linspace(0, 10, 100)
y = np.sin(x) + np.random.normal(0, 0.2, 100)

# Apply LOWESS smoothing
smoothed = lowess(y, x, frac=0.3)

# Plot original and smoothed data
plt.figure(figsize=(10, 6))
plt.scatter(x, y, alpha=0.5, label='Original Data')
plt.plot(smoothed[:, 0], smoothed[:, 1], 'r-', label='Smooth Curve (LOWESS)')
plt.title('How to Plot a Smooth Curve in Matplotlib - LOWESS Smoothing')
plt.xlabel('X-axis')
plt.ylabel('Y-axis')
plt.legend()
plt.text(5, 0.5, 'how2matplotlib.com', fontsize=12, alpha=0.7)
plt.show()
Output:
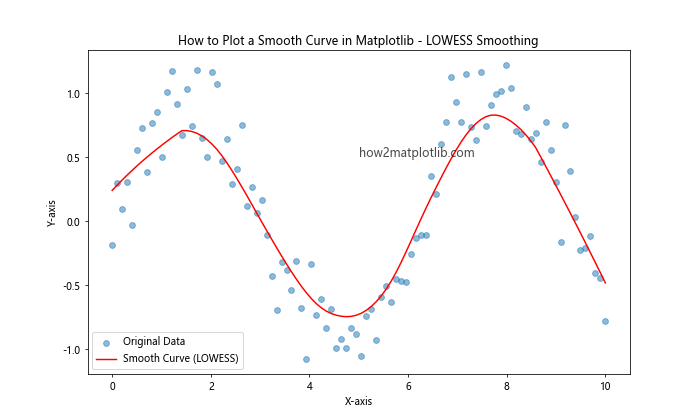
This example demonstrates how to use the LOWESS function from the statsmodels library to create a smooth curve from scattered data points.
Handling Discontinuities When Plotting Smooth Curves
Sometimes, you may need to plot a smooth curve that has discontinuities or sharp changes. In such cases, standard smoothing techniques might not work well. Let’s explore how to handle these situations.
Piecewise Smooth Curves
For functions with discontinuities, you can plot separate smooth curves for each continuous segment:
import numpy as np
import matplotlib.pyplot as plt

def piecewise_function(x):
    return np.piecewise(x, [x < 0, (x >= 0) & (x < 1), x >= 1],
                        [lambda x: x**2, lambda x: np.sqrt(x), lambda x: np.log(x)])

# Generate data
x = np.linspace(-2, 3, 1000)
y = piecewise_function(x)

# Plot the piecewise smooth curve
plt.figure(figsize=(10, 6))
plt.plot(x, y, 'b-', label='Piecewise Smooth Curve')
plt.title('How to Plot a Smooth Curve in Matplotlib - Piecewise Function')
plt.xlabel('X-axis')
plt.ylabel('Y-axis')
plt.legend()
plt.text(0, 1, 'how2matplotlib.com', fontsize=12, alpha=0.7)
plt.grid(True, linestyle=':', alpha=0.7)
plt.show()
Output:
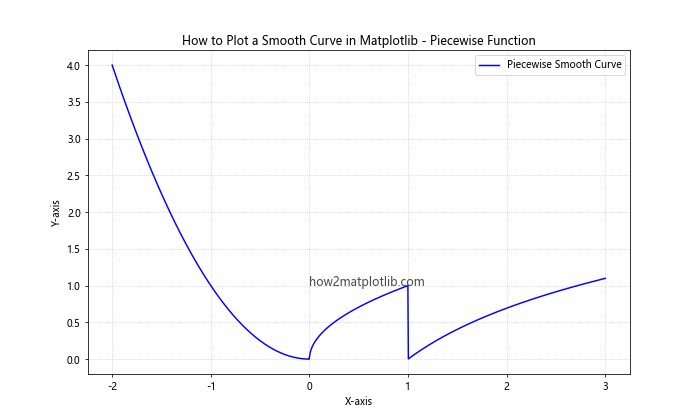
This example shows how to plot a piecewise function as a smooth curve, handling the discontinuities at x=0 and x=1.
Using NaN Values for Discontinuities
Another approach to handle discontinuities is to use NaN (Not a Number) values:
import numpy as np
import matplotlib.pyplot as plt

# Generate data with a discontinuity
x = np.linspace(-5, 5, 1000)
y = 1 / (1 + np.exp(-x))
y[np.abs(x) < 0.1] = np.nan  # Create a discontinuity

# Plot the smooth curve with a discontinuity
plt.figure(figsize=(10, 6))
plt.plot(x, y, 'g-', label='Smooth Curve with Discontinuity')
plt.title('How to Plot a Smooth Curve in Matplotlib - Handling Discontinuities')
plt.xlabel('X-axis')
plt.ylabel('Y-axis')
plt.legend()
plt.text(0, 0.5, 'how2matplotlib.com', fontsize=12, alpha=0.7)
plt.grid(True, linestyle='--', alpha=0.5)
plt.show()
Output:
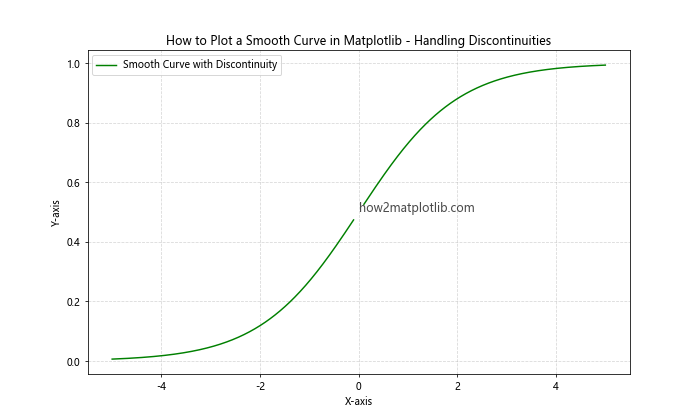
In this example, we create a smooth curve with a discontinuity by setting values to NaN in a specific range.
Optimizing Smooth Curves for Large Datasets
When dealing with large datasets, plotting smooth curves can become computationally expensive. Here are some techniques to optimize the process:
Downsampling Data
For very large datasets, you can downsample the data before plotting:
import numpy as np
import matplotlib.pyplot as plt

# Generate a large dataset
x = np.linspace(0, 100, 10000)
y = np.sin(x) + np.random.normal(0, 0.1, 10000)

# Downsample the data
downsample_factor = 10
x_downsampled = x[::downsample_factor]
y_downsampled = y[::downsample_factor]

# Plot original and downsampled data
plt.figure(figsize=(12, 6))
plt.plot(x, y, 'b-', alpha=0.3, label='Original Data')
plt.plot(x_downsampled, y_downsampled, 'r-', label='Downsampled Smooth Curve')
plt.title('How to Plot a Smooth Curve in Matplotlib - Downsampling Large Datasets')
plt.xlabel('X-axis')
plt.ylabel('Y-axis')
plt.legend()
plt.text(50, 0, 'how2matplotlib.com', fontsize=12, alpha=0.7)
plt.show()
Output:
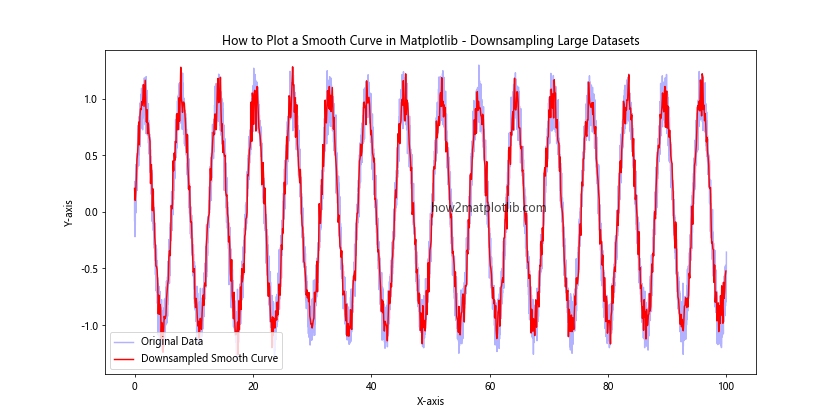
This example demonstrates how to downsample a large dataset before plotting, which can significantly improve performance while still maintaining a smooth appearance.
Using Vectorized Operations
Vectorized operations in NumPy can greatly speed up the process of creating smooth curves:
import numpy as np
import matplotlib.pyplot as plt

def vectorized_smooth(x, y, window_size):
    weights = np.ones(window_size) / window_size
    return np.convolve(y, weights, mode='valid')

# Generate data
x = np.linspace(0, 10, 1000)
y = np.sin(x) + np.random.normal(0, 0.1, 1000)

# Apply vectorized smoothing
window_size = 50
y_smooth = vectorized_smooth(x, y, window_size)
x_smooth = x[window_size-1:]

# Plot original and smoothed data
plt.figure(figsize=(10, 6))
plt.plot(x, y, 'b-', alpha=0.5, label='Original Data')
plt.plot(x_smooth, y_smooth, 'r-', label='Vectorized Smooth Curve')
plt.title('How to Plot a Smooth Curve in Matplotlib - Vectorized Smoothing')
plt.xlabel('X-axis')
plt.ylabel('Y-axis')
plt.legend()
plt.text(5, 0.5, 'how2matplotlib.com', fontsize=12, alpha=0.7)
plt.show()
Output:
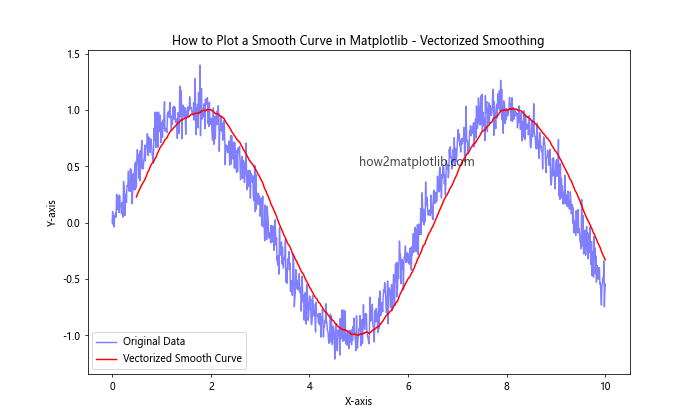
This example uses a vectorized smoothing function to efficiently create a smooth curve from a large dataset.
Best Practices for Plotting Smooth Curves in Matplotlib
As we conclude our exploration of how to plot a smooth curve in Matplotlib, let's review some best practices:
- Choose the appropriate smoothing technique based on your data and requirements.
- Be mindful of overfitting or oversmoothing, which can hide important features in your data.
- Always plot the original data alongside the smooth curve for comparison.
- Use appropriate axis labels and titles to clearly communicate what the smooth curve represents.
- Consider using different colors or styles to distinguish between original data and smooth curves.
- When dealing with multiple curves, use legends to identify each curve.
- Optimize your code for large datasets using techniques like downsampling or vectorized operations.
Here's a final example incorporating these best practices:
import numpy as np
import matplotlib.pyplot as plt
from scipy.interpolate import make_interp_spline

# Generate sample data
x = np.linspace(0, 10, 50)
y = np.sin(x) + np.random.normal(0, 0.2, 50)

# Create a smooth curve
x_smooth = np.linspace(x.min(), x.max(), 300)
spl = make_interp_spline(x, y, k=3)
y_smooth = spl(x_smooth)

# Plot the data and smooth curve
plt.figure(figsize=(12, 6))
plt.scatter(x, y, color='blue', alpha=0.5, label='Original Data')
plt.plot(x_smooth, y_smooth, 'r-', label='Smooth Curve')
plt.title('How to Plot a Smooth Curve in Matplotlib - Best Practices')
plt.xlabel('X-axis')
plt.ylabel('Y-axis')
plt.legend()
plt.text(5, 0, 'how2matplotlib.com', fontsize=12, alpha=0.7)
plt.grid(True, linestyle=':', alpha=0.7)
plt.tight_layout()
plt.show()
Output:
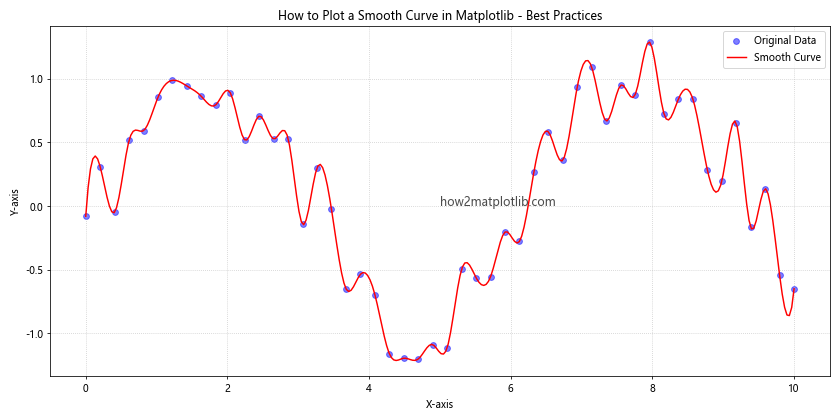
This final example demonstrates many of the best practices we've discussed throughout this article on how to plot a smooth curve in Matplotlib.
In conclusion, plotting smooth curves in Matplotlib is a powerful technique for data visualization that can help reveal trends and patterns in your data. By understanding the various methods available and following best practices, you can create informative and visually appealing plots that effectively communicate your data insights. Whether you're working with simple datasets or complex, noisy data, Matplotlib provides the tools you need to create smooth, professional-looking curves.