How to Plot a Normal Distribution with Matplotlib in Python
How to plot a normal distribution with Matplotlib in Python is an essential skill for data visualization and statistical analysis. This comprehensive guide will walk you through various methods and techniques to create normal distribution plots using Matplotlib, one of the most popular plotting libraries in Python. We’ll cover everything from basic concepts to advanced customization options, providing you with the knowledge and tools to effectively visualize normal distributions in your data science projects.
Understanding Normal Distribution and Its Importance
Before diving into the plotting techniques, it’s crucial to understand what a normal distribution is and why it’s important in data analysis. A normal distribution, also known as a Gaussian distribution, is a symmetric probability distribution that follows a bell-shaped curve. It’s characterized by its mean (μ) and standard deviation (σ), which determine the center and spread of the distribution, respectively.
Normal distributions are ubiquitous in nature and play a significant role in various fields, including statistics, physics, and social sciences. They’re often used to model real-world phenomena and are the foundation for many statistical tests and analyses.
Setting Up Your Python Environment
To plot a normal distribution with Matplotlib in Python, you’ll need to have the following libraries installed:
- Matplotlib
- NumPy
- SciPy (optional, but useful for generating normal distribution data)
You can install these libraries using pip:
pip install matplotlib numpy scipy
Once you have the necessary libraries installed, you’re ready to start plotting normal distributions with Matplotlib.
Basic Normal Distribution Plot
Let’s begin with a simple example of how to plot a normal distribution with Matplotlib in Python. We’ll use NumPy to generate the data and Matplotlib to create the plot.
import numpy as np
import matplotlib.pyplot as plt

# Generate data for the normal distribution
mu, sigma = 0, 1  # mean and standard deviation
x = np.linspace(mu - 3*sigma, mu + 3*sigma, 100)
y = 1/(sigma * np.sqrt(2 * np.pi)) * np.exp(-(x - mu)**2 / (2 * sigma**2))

# Create the plot
plt.figure(figsize=(10, 6))
plt.plot(x, y, label='Normal Distribution')
plt.title('How to Plot a Normal Distribution with Matplotlib in Python')
plt.xlabel('X-axis')
plt.ylabel('Probability Density')
plt.legend()
plt.grid(True)
plt.text(0, 0.1, 'how2matplotlib.com', fontsize=12, alpha=0.7)
plt.show()
Output:
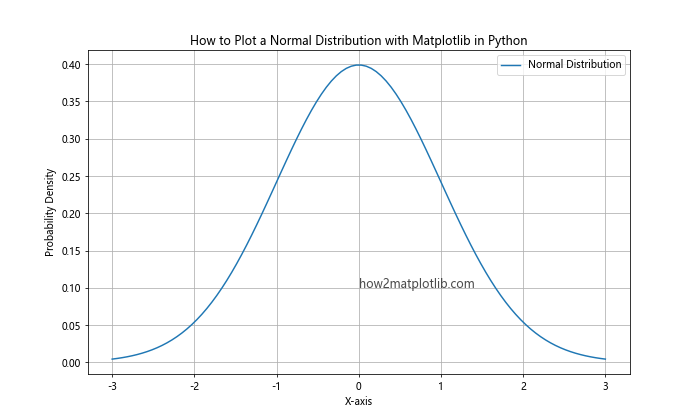
In this example, we first generate the data for a standard normal distribution (mean = 0, standard deviation = 1) using NumPy’s linspace function to create evenly spaced x-values and the probability density function formula to calculate the corresponding y-values. Then, we use Matplotlib’s plot function to create the line plot, add labels, a title, and a legend, and finally display the plot using plt.show().
Histogram with Normal Distribution Overlay
Another common way to visualize a normal distribution is by creating a histogram of the data and overlaying a normal distribution curve. This method is particularly useful when working with real-world data that approximates a normal distribution.
import numpy as np
import matplotlib.pyplot as plt
from scipy import stats

# Generate random data
np.random.seed(42)
data = np.random.normal(loc=0, scale=1, size=1000)

# Create the histogram
plt.figure(figsize=(10, 6))
plt.hist(data, bins=30, density=True, alpha=0.7, color='skyblue', edgecolor='black')

# Generate points for the normal distribution curve
x = np.linspace(data.min(), data.max(), 100)
y = stats.norm.pdf(x, loc=data.mean(), scale=data.std())

# Plot the normal distribution curve
plt.plot(x, y, 'r-', lw=2, label='Normal Distribution')

plt.title('How to Plot a Normal Distribution with Matplotlib in Python: Histogram with Overlay')
plt.xlabel('Value')
plt.ylabel('Density')
plt.legend()
plt.text(0, 0.1, 'how2matplotlib.com', fontsize=12, alpha=0.7)
plt.show()
Output:
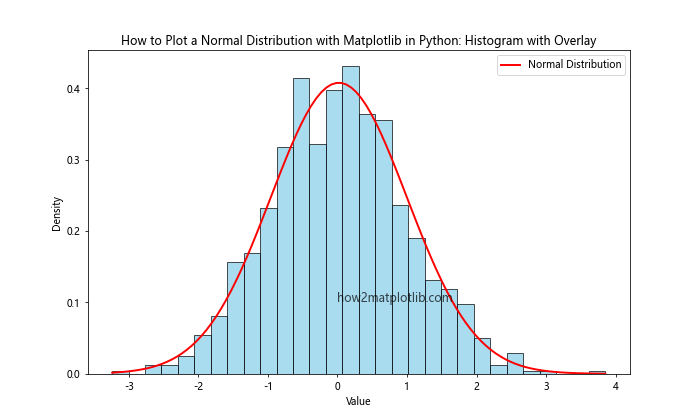
In this example, we generate random data from a normal distribution using NumPy’s random.normal function. We then create a histogram of the data using Matplotlib’s hist function with the density=True parameter to normalize the histogram. Finally, we overlay a normal distribution curve using SciPy’s stats.norm.pdf function to generate the curve points and Matplotlib’s plot function to draw the line.
Customizing Normal Distribution Plots
Matplotlib offers a wide range of customization options to enhance your normal distribution plots. Let’s explore some of these options:
Changing Colors and Styles
You can easily modify the colors and styles of your plots to make them more visually appealing or to match your project’s theme.
import numpy as np
import matplotlib.pyplot as plt

mu, sigma = 0, 1
x = np.linspace(mu - 3*sigma, mu + 3*sigma, 100)
y = 1/(sigma * np.sqrt(2 * np.pi)) * np.exp(-(x - mu)**2 / (2 * sigma**2))

plt.figure(figsize=(10, 6))
plt.plot(x, y, color='purple', linestyle='--', linewidth=2, label='Normal Distribution')
plt.fill_between(x, y, alpha=0.3, color='lavender')
plt.title('How to Plot a Normal Distribution with Matplotlib in Python: Custom Colors')
plt.xlabel('X-axis')
plt.ylabel('Probability Density')
plt.legend()
plt.text(0, 0.1, 'how2matplotlib.com', fontsize=12, alpha=0.7)
plt.show()
Output:
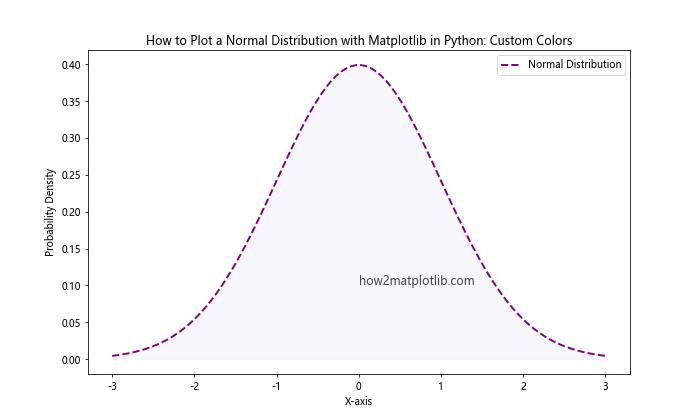
In this example, we’ve changed the line color to purple, used a dashed line style, increased the line width, and added a light fill color under the curve using plt.fill_between().
Adding Multiple Normal Distributions
You can plot multiple normal distributions on the same graph to compare different parameters or datasets.
import numpy as np
import matplotlib.pyplot as plt

x = np.linspace(-5, 5, 100)
y1 = 1/(1 * np.sqrt(2 * np.pi)) * np.exp(-(x - 0)**2 / (2 * 1**2))
y2 = 1/(1.5 * np.sqrt(2 * np.pi)) * np.exp(-(x - 1)**2 / (2 * 1.5**2))

plt.figure(figsize=(10, 6))
plt.plot(x, y1, label='μ=0, σ=1')
plt.plot(x, y2, label='μ=1, σ=1.5')
plt.title('How to Plot a Normal Distribution with Matplotlib in Python: Multiple Distributions')
plt.xlabel('X-axis')
plt.ylabel('Probability Density')
plt.legend()
plt.grid(True, linestyle=':', alpha=0.7)
plt.text(0, 0.1, 'how2matplotlib.com', fontsize=12, alpha=0.7)
plt.show()
Output:
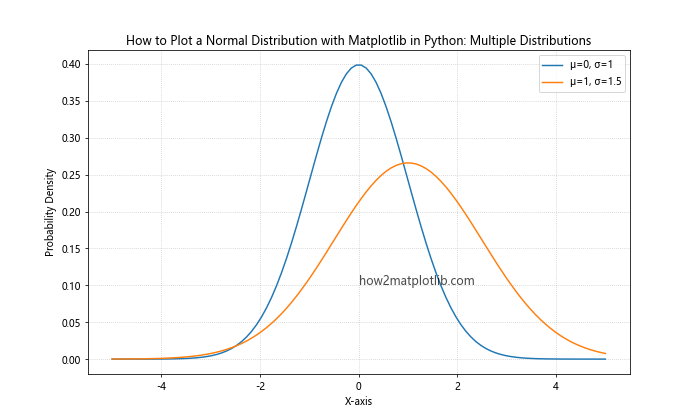
This example demonstrates how to plot two normal distributions with different means and standard deviations on the same graph, allowing for easy comparison.
Using Subplots
Subplots are useful when you want to display multiple related plots side by side or in a grid layout.
import numpy as np
import matplotlib.pyplot as plt

x = np.linspace(-5, 5, 100)
y1 = 1/(1 * np.sqrt(2 * np.pi)) * np.exp(-(x - 0)**2 / (2 * 1**2))
y2 = 1/(2 * np.sqrt(2 * np.pi)) * np.exp(-(x - 0)**2 / (2 * 2**2))

fig, (ax1, ax2) = plt.subplots(1, 2, figsize=(12, 5))

ax1.plot(x, y1, label='σ=1')
ax1.set_title('Normal Distribution (μ=0, σ=1)')
ax1.set_xlabel('X-axis')
ax1.set_ylabel('Probability Density')
ax1.legend()
ax1.text(0, 0.1, 'how2matplotlib.com', fontsize=10, alpha=0.7)

ax2.plot(x, y2, label='σ=2')
ax2.set_title('Normal Distribution (μ=0, σ=2)')
ax2.set_xlabel('X-axis')
ax2.set_ylabel('Probability Density')
ax2.legend()
ax2.text(0, 0.05, 'how2matplotlib.com', fontsize=10, alpha=0.7)

plt.suptitle('How to Plot a Normal Distribution with Matplotlib in Python: Subplots')
plt.tight_layout()
plt.show()
Output:
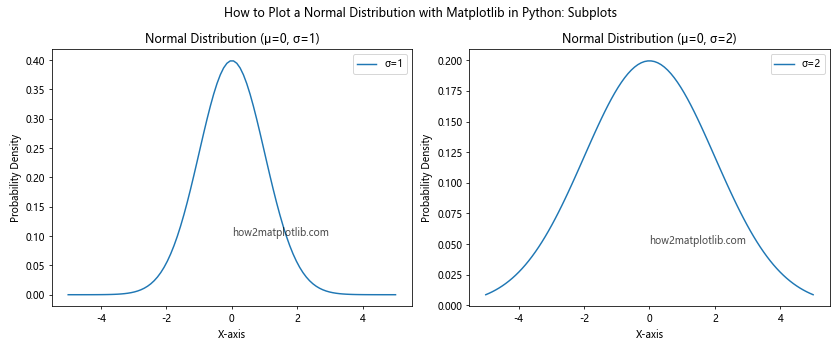
This example creates two subplots side by side, each showing a normal distribution with different standard deviations.
Advanced Techniques for Normal Distribution Plots
Now that we’ve covered the basics, let’s explore some advanced techniques for plotting normal distributions with Matplotlib in Python.
3D Normal Distribution Plot
You can create a 3D surface plot of a bivariate normal distribution to visualize the relationship between two variables.
import numpy as np
import matplotlib.pyplot as plt
from mpl_toolkits.mplot3d import Axes3D

def bivariate_normal(X, Y, sigmax=1.0, sigmay=1.0, mux=0.0, muy=0.0, sigmaxy=0.0):
    Xmu = X-mux
    Ymu = Y-muy
    rho = sigmaxy/(sigmax*sigmay)
    z = Xmu**2/sigmax**2 + Ymu**2/sigmay**2 - 2*rho*Xmu*Ymu/(sigmax*sigmay)
    denom = 2*np.pi*sigmax*sigmay*np.sqrt(1-rho**2)
    return np.exp(-z/(2*(1-rho**2))) / denom

x = np.linspace(-3, 3, 100)
y = np.linspace(-3, 3, 100)
X, Y = np.meshgrid(x, y)
Z = bivariate_normal(X, Y, sigmax=1, sigmay=1, mux=0, muy=0, sigmaxy=0)

fig = plt.figure(figsize=(10, 8))
ax = fig.add_subplot(111, projection='3d')
surf = ax.plot_surface(X, Y, Z, cmap='viridis')
ax.set_xlabel('X')
ax.set_ylabel('Y')
ax.set_zlabel('Probability Density')
ax.set_title('How to Plot a Normal Distribution with Matplotlib in Python: 3D Bivariate')
fig.colorbar(surf, shrink=0.5, aspect=5)
ax.text(0, 0, 0, 'how2matplotlib.com', fontsize=10, alpha=0.7)
plt.show()
Output:
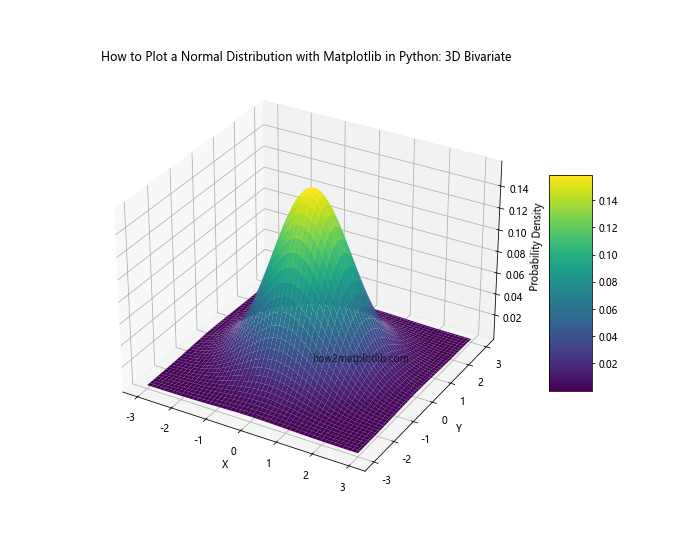
This example creates a 3D surface plot of a bivariate normal distribution using Matplotlib’s 3D plotting capabilities.
Cumulative Distribution Function (CDF) Plot
The cumulative distribution function (CDF) is another important visualization of a normal distribution.
import numpy as np
import matplotlib.pyplot as plt
from scipy import stats

x = np.linspace(-4, 4, 100)
y = stats.norm.cdf(x)

plt.figure(figsize=(10, 6))
plt.plot(x, y, label='CDF')
plt.title('How to Plot a Normal Distribution with Matplotlib in Python: CDF')
plt.xlabel('X-axis')
plt.ylabel('Cumulative Probability')
plt.legend()
plt.grid(True, linestyle=':', alpha=0.7)
plt.text(0, 0.5, 'how2matplotlib.com', fontsize=12, alpha=0.7)
plt.show()
Output:
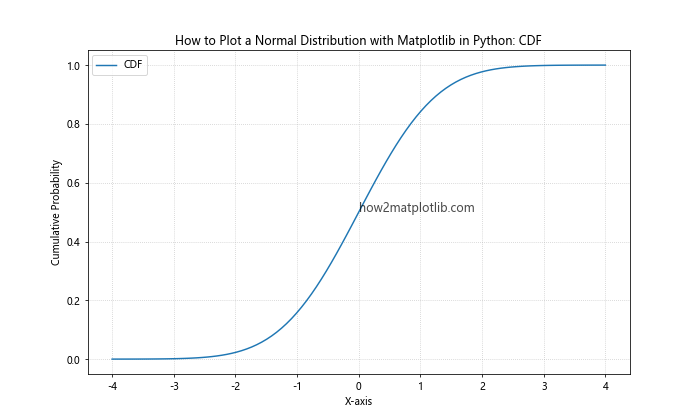
This example plots the cumulative distribution function of a standard normal distribution using SciPy’s stats.norm.cdf function.
Q-Q Plot
A Q-Q (Quantile-Quantile) plot is used to assess whether a dataset follows a normal distribution.
import numpy as np
import matplotlib.pyplot as plt
from scipy import stats

# Generate sample data
np.random.seed(42)
data = np.random.normal(loc=0, scale=1, size=1000)

# Create Q-Q plot
fig, ax = plt.subplots(figsize=(10, 6))
stats.probplot(data, dist="norm", plot=ax)
ax.set_title("How to Plot a Normal Distribution with Matplotlib in Python: Q-Q Plot")
ax.text(0, 0, 'how2matplotlib.com', fontsize=12, alpha=0.7)
plt.show()
Output:
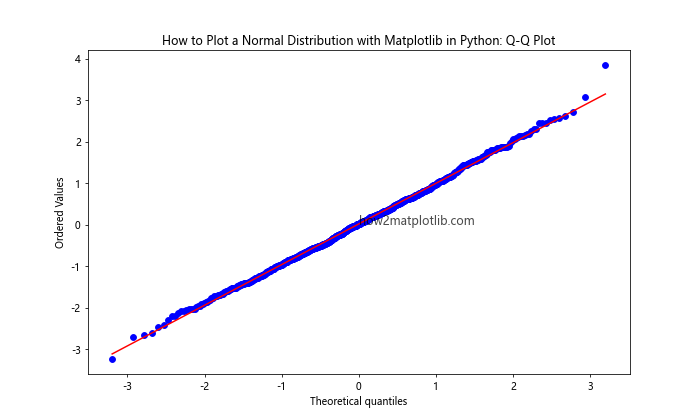
This example creates a Q-Q plot using SciPy’s stats.probplot function, which compares the quantiles of the sample data to the quantiles of a theoretical normal distribution.
Visualizing Normal Distribution Properties
Understanding and visualizing the properties of a normal distribution is crucial for data analysis. Let’s explore some ways to visualize these properties using Matplotlib.
Standard Deviations and Percentiles
You can visualize the standard deviations and percentiles of a normal distribution to better understand its spread and central tendency.
import numpy as np
import matplotlib.pyplot as plt
from scipy import stats

x = np.linspace(-4, 4, 1000)
y = stats.norm.pdf(x)

plt.figure(figsize=(12, 6))
plt.plot(x, y, 'b-', label='Normal Distribution')
plt.fill_between(x, y, where=(x >= -1) & (x <= 1), color='red', alpha=0.3, label='68% (1σ)')
plt.fill_between(x, y, where=(x >= -2) & (x <= 2), color='green', alpha=0.2, label='95% (2σ)')
plt.fill_between(x, y, where=(x >= -3) & (x <= 3), color='blue', alpha=0.1, label='99.7% (3σ)')

plt.title('How to Plot a Normal Distribution with Matplotlib in Python: Standard Deviations')
plt.xlabel('X-axis (Standard Deviations)')
plt.ylabel('Probability Density')
plt.legend()
plt.grid(True, linestyle=':', alpha=0.7)
plt.text(0, 0.1, 'how2matplotlib.com', fontsize=12, alpha=0.7)
plt.show()
Output:
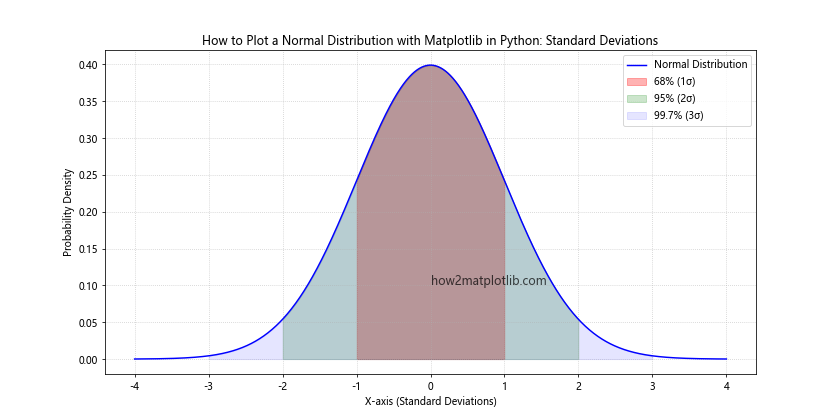
This example visualizes the 68-95-99.7 rule (also known as the empirical rule) by shading the areas within one, two, and three standard deviations of the mean.
Comparing Empirical Data to Normal Distribution
When working with real-world data, it's often useful to compare your empirical data to a theoretical normal distribution. Here are some techniques to do this using Matplotlib.
Overlay Empirical Data on Theoretical Normal Distribution
import numpy as np
import matplotlib.pyplot as plt
from scipy import stats

# Generate sample data
np.random.seed(42)
data = np.random.normal(loc=0, scale=1, size=1000)

# Calculate mean and standard deviation of the data
mu, std = np.mean(data), np.std(data)

# Create the plot
plt.figure(figsize=(10, 6))

# Plot histogram of empirical data
plt.hist(data, bins=30, density=True, alpha=0.7, color='skyblue', edgecolor='black', label='Empirical Data')

# Plot theoretical normal distribution
x = np.linspace(mu - 3*std, mu + 3*std, 100)
y = stats.norm.pdf(x, mu, std)
plt.plot(x, y, 'r-', lw=2, label='Theoretical Normal')

plt.title('How to Plot a Normal Distribution with Matplotlib in Python: Empirical vs Theoretical')
plt.xlabel('Value')
plt.ylabel('Density')
plt.legend()
plt.text(0, 0.1, 'how2matplotlib.com', fontsize=12, alpha=0.7)
plt.show()
Output:
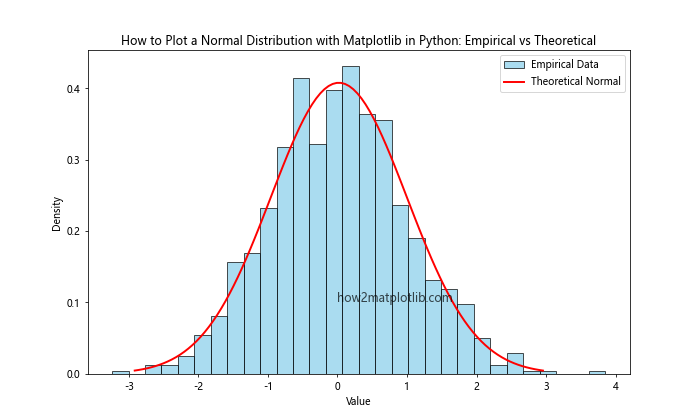
This example generates sample data, creates a histogram of the empirical data, and overlays a theoretical normal distribution with the same mean and standard deviation as the sample data.
Probability Plot (P-P Plot)
A probability plot, or P-P plot, is another useful tool for comparing empirical data to a theoretical normal distribution.
import numpy as np
import matplotlib.pyplot as plt
from scipy import stats

# Generate sample data
np.random.seed(42)
data = np.random.normal(loc=0, scale=1, size=1000)

# Create P-P plot
fig, ax = plt.subplots(figsize=(10, 6))
stats.probplot(data, dist="norm", plot=ax)
ax.get_lines()[0].set_markerfacecolor('skyblue')
ax.get_lines()[0].set_markeredgecolor('blue')

ax.set_title("How to Plot a Normal Distribution with Matplotlib in Python: P-P Plot")
ax.set_xlabel("Theoretical Quantiles")
ax.set_ylabel("Sample Quantiles")
ax.text(0, 0, 'how2matplotlib.com', fontsize=12, alpha=0.7)
plt.show()
Output:
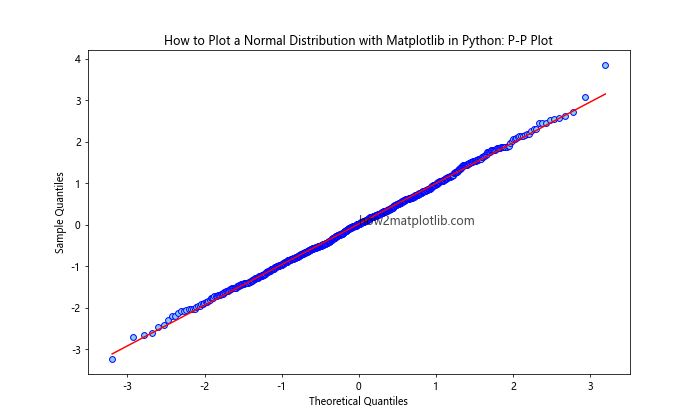
This example creates a P-P plot, which compares the cumulative distribution of the sample data to that of a theoretical normal distribution.
Advanced Customization Techniques
Matplotlib offers a wide range of advanced customization options to create publication-quality plots. Let's explore some of these techniques.
Custom Styling with Seaborn
Seaborn is a statistical data visualization library built on top of Matplotlib that provides a high-level interface for drawing attractive statistical graphics. You can use Seaborn to easily apply custom styles to your normal distribution plots.
import numpy as np
import matplotlib.pyplot as plt
import seaborn as sns

# Set Seaborn style
sns.set_style("whitegrid")
sns.set_palette("deep")

# Generate data
x = np.linspace(-4, 4, 100)
y = 1/(1 * np.sqrt(2 * np.pi)) * np.exp(-(x - 0)**2 / (2 * 1**2))

# Create the plot
plt.figure(figsize=(10, 6))
sns.lineplot(x=x, y=y, label='Normal Distribution')
sns.despine()

plt.title('How to Plot a Normal Distribution with Matplotlib and Seaborn in Python')
plt.xlabel('X-axis')
plt.ylabel('Probability Density')
plt.legend()
plt.text(0, 0.1, 'how2matplotlib.com', fontsize=12, alpha=0.7)
plt.show()
Output:
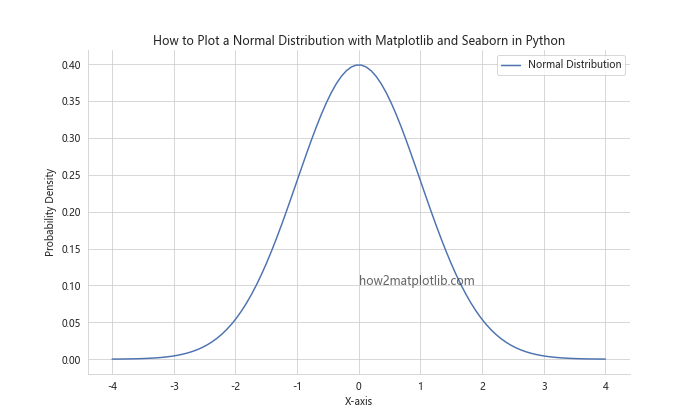
This example uses Seaborn to apply a custom style to the normal distribution plot, resulting in a more visually appealing graph.
Animation of Normal Distribution
You can create animated plots to visualize how changes in parameters affect the normal distribution.
import numpy as np
import matplotlib.pyplot as plt
from matplotlib.animation import FuncAnimation

fig, ax = plt.subplots(figsize=(10, 6))
line, = ax.plot([], [], lw=2)
ax.set_xlim(-5, 5)
ax.set_ylim(0, 0.5)
ax.set_title('How to Plot a Normal Distribution with Matplotlib in Python: Animation')
ax.set_xlabel('X-axis')
ax.set_ylabel('Probability Density')
ax.text(0, 0.1, 'how2matplotlib.com', fontsize=12, alpha=0.7)

def init():
    line.set_data([], [])
    return line,

def animate(i):
    x = np.linspace(-5, 5, 100)
    y = 1/(i * np.sqrt(2 * np.pi)) * np.exp(-(x - 0)**2 / (2 * i**2))
    line.set_data(x, y)
    ax.set_title(f'Normal Distribution (σ = {i:.2f})')
    return line,

anim = FuncAnimation(fig, animate, init_func=init, frames=np.linspace(0.5, 2, 100), interval=50, blit=True)
plt.show()
Output:
This example creates an animation that shows how the normal distribution changes as the standard deviation increases.
Practical Applications of Normal Distribution Plots
Understanding how to plot a normal distribution with Matplotlib in Python is crucial for various real-world applications. Let's explore some practical examples.
Quality Control in Manufacturing
In manufacturing, normal distribution plots are often used to analyze product specifications and quality control measures.
import numpy as np
import matplotlib.pyplot as plt
from scipy import stats

# Generate sample data for product measurements
np.random.seed(42)
measurements = np.random.normal(loc=100, scale=2, size=1000)

# Calculate mean and standard deviation
mean = np.mean(measurements)
std = np.std(measurements)

# Create the plot
plt.figure(figsize=(12, 6))

# Plot histogram of measurements
plt.hist(measurements, bins=30, density=True, alpha=0.7, color='skyblue', edgecolor='black', label='Product Measurements')

# Plot theoretical normal distribution
x = np.linspace(mean - 4*std, mean + 4*std, 100)
y = stats.norm.pdf(x, mean, std)
plt.plot(x, y, 'r-', lw=2, label='Theoretical Normal')

# Add specification limits
lower_limit, upper_limit = 95, 105
plt.axvline(lower_limit, color='g', linestyle='--', label='Specification Limits')
plt.axvline(upper_limit, color='g', linestyle='--')

plt.title('How to Plot a Normal Distribution with Matplotlib in Python: Quality Control')
plt.xlabel('Measurement')
plt.ylabel('Density')
plt.legend()
plt.text(100, 0.05, 'how2matplotlib.com', fontsize=12, alpha=0.7)
plt.show()
Output:
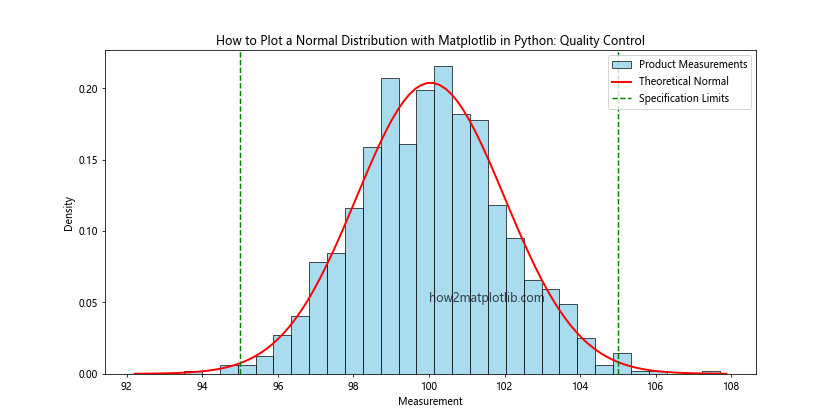
This example simulates product measurements and plots them against a theoretical normal distribution, along with specification limits, to visualize quality control in a manufacturing process.
Financial Risk Analysis
Normal distribution plots are widely used in finance for risk analysis and portfolio management.
import numpy as np
import matplotlib.pyplot as plt
from scipy import stats

# Generate sample returns data
np.random.seed(42)
returns = np.random.normal(loc=0.05, scale=0.1, size=1000)

# Calculate Value at Risk (VaR) at 95% confidence level
var_95 = np.percentile(returns, 5)

# Create the plot
plt.figure(figsize=(12, 6))

# Plot histogram of returns
plt.hist(returns, bins=30, density=True, alpha=0.7, color='skyblue', edgecolor='black', label='Returns Distribution')

# Plot theoretical normal distribution
x = np.linspace(min(returns), max(returns), 100)
y = stats.norm.pdf(x, np.mean(returns), np.std(returns))
plt.plot(x, y, 'r-', lw=2, label='Theoretical Normal')

# Add VaR line
plt.axvline(var_95, color='g', linestyle='--', label=f'95% VaR: {var_95:.2f}')

plt.title('How to Plot a Normal Distribution with Matplotlib in Python: Financial Risk Analysis')
plt.xlabel('Returns')
plt.ylabel('Density')
plt.legend()
plt.text(0, 1, 'how2matplotlib.com', fontsize=12, alpha=0.7)
plt.show()
Output:
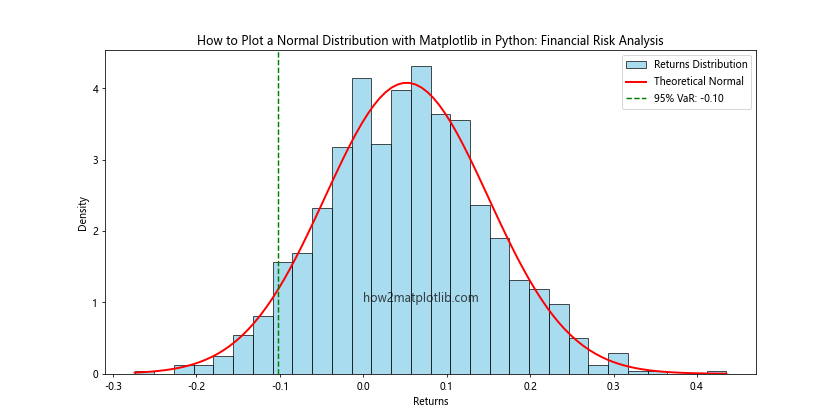
This example simulates financial returns and visualizes their distribution along with the Value at Risk (VaR) at a 95% confidence level.
Conclusion
In this comprehensive guide, we've explored how to plot a normal distribution with Matplotlib in Python, covering a wide range of techniques and applications. From basic plots to advanced customization and real-world examples, you now have the tools and knowledge to effectively visualize normal distributions in your data science projects.
Remember that while the normal distribution is a powerful and widely used model, it's essential to always check your data's actual distribution and not assume normality. The visualization techniques we've covered can help you assess whether your data follows a normal distribution and make informed decisions about your statistical analyses.