How to Plot a Pandas DataFrame with Matplotlib
How to plot a Pandas DataFrame with Matplotlib is an essential skill for data visualization in Python. This comprehensive guide will walk you through various techniques and best practices for creating stunning visualizations using Pandas DataFrames and Matplotlib. We’ll cover everything from basic line plots to advanced customization options, ensuring you have a solid foundation for plotting your data effectively.
Understanding the Basics of Plotting Pandas DataFrames with Matplotlib
Before diving into specific plotting techniques, it’s crucial to understand the relationship between Pandas DataFrames and Matplotlib. Pandas provides a convenient interface to Matplotlib, allowing you to create plots directly from your DataFrames. This integration simplifies the process of visualizing data stored in tabular format.
To get started with plotting a Pandas DataFrame using Matplotlib, you’ll need to import the necessary libraries:
import pandas as pd
import matplotlib.pyplot as plt

# Create a sample DataFrame
data = {'Date': ['2023-01-01', '2023-01-02', '2023-01-03', '2023-01-04', '2023-01-05'],
        'Value': [10, 15, 13, 17, 20]}
df = pd.DataFrame(data)
df['Date'] = pd.to_datetime(df['Date'])
df.set_index('Date', inplace=True)

# Plot the DataFrame
plt.figure(figsize=(10, 6))
df.plot(kind='line', marker='o')
plt.title('How to plot a Pandas DataFrame with Matplotlib - how2matplotlib.com')
plt.xlabel('Date')
plt.ylabel('Value')
plt.grid(True)
plt.show()
Output:
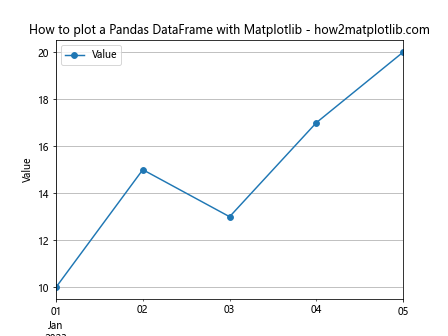
In this example, we create a simple DataFrame with date and value columns, set the date as the index, and then use the plot() method to create a line plot. The kind='line' parameter specifies that we want a line plot, and marker='o' adds markers to each data point.
Line Plots: The Foundation of DataFrame Visualization
Line plots are one of the most common ways to visualize time series data or any data with a continuous x-axis. When plotting a Pandas DataFrame with Matplotlib, line plots are often the default choice for visualizing trends over time.
Here’s an example of how to create a more advanced line plot using a Pandas DataFrame:
import pandas as pd
import matplotlib.pyplot as plt
import numpy as np

# Create a sample DataFrame with multiple columns
dates = pd.date_range(start='2023-01-01', end='2023-12-31', freq='D')
df = pd.DataFrame({
    'Temperature': np.random.randn(len(dates)) * 5 + 20,
    'Humidity': np.random.randn(len(dates)) * 10 + 60,
    'Pressure': np.random.randn(len(dates)) * 50 + 1000
}, index=dates)

# Plot the DataFrame
plt.figure(figsize=(12, 6))
df.plot(linewidth=2, alpha=0.7)
plt.title('How to plot a Pandas DataFrame with Matplotlib - Multiple Lines - how2matplotlib.com')
plt.xlabel('Date')
plt.ylabel('Value')
plt.legend(loc='best')
plt.grid(True)
plt.show()
Output:
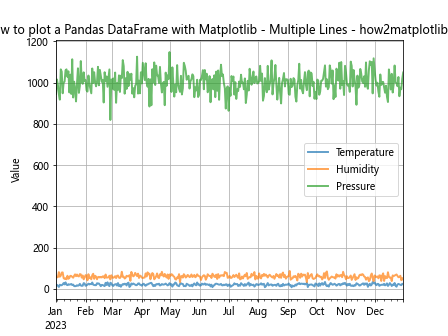
In this example, we create a DataFrame with multiple columns representing different weather metrics. The plot() method automatically creates a line for each column, using different colors to distinguish between them. We’ve also added some styling options like linewidth and alpha to enhance the visual appeal.
Bar Plots: Comparing Categorical Data
Bar plots are excellent for comparing categorical data or showing the distribution of values across different categories. When plotting a Pandas DataFrame with Matplotlib, bar plots can be easily created using the kind='bar' parameter.
Here’s an example of how to create a bar plot from a Pandas DataFrame:
import pandas as pd
import matplotlib.pyplot as plt

# Create a sample DataFrame
data = {'Category': ['A', 'B', 'C', 'D', 'E'],
        'Value1': [10, 15, 13, 17, 20],
        'Value2': [8, 12, 15, 10, 18]}
df = pd.DataFrame(data)

# Plot the DataFrame as a bar plot
plt.figure(figsize=(10, 6))
df.set_index('Category').plot(kind='bar', width=0.8)
plt.title('How to plot a Pandas DataFrame with Matplotlib - Bar Plot - how2matplotlib.com')
plt.xlabel('Category')
plt.ylabel('Value')
plt.legend(loc='best')
plt.grid(axis='y')
plt.show()
Output:
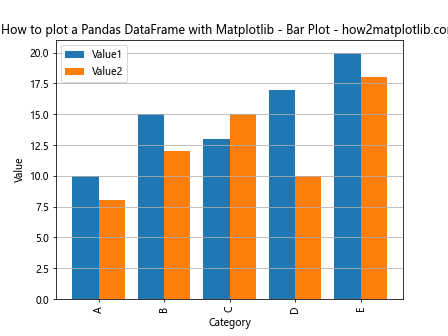
In this example, we create a DataFrame with categories and two sets of values. By setting the ‘Category’ column as the index and using kind='bar', we create a grouped bar plot that compares the two value columns across categories.
Scatter Plots: Visualizing Relationships
Scatter plots are useful for visualizing the relationship between two variables in your DataFrame. When plotting a Pandas DataFrame with Matplotlib, scatter plots can help identify correlations or patterns in your data.
Here’s an example of how to create a scatter plot from a Pandas DataFrame:
import pandas as pd
import matplotlib.pyplot as plt
import numpy as np

# Create a sample DataFrame
np.random.seed(42)
df = pd.DataFrame({
    'X': np.random.rand(100) * 10,
    'Y': np.random.rand(100) * 10,
    'Size': np.random.rand(100) * 100,
    'Color': np.random.rand(100)
})

# Plot the DataFrame as a scatter plot
plt.figure(figsize=(10, 8))
scatter = plt.scatter(df['X'], df['Y'], s=df['Size'], c=df['Color'], alpha=0.6, cmap='viridis')
plt.colorbar(scatter, label='Color Value')
plt.title('How to plot a Pandas DataFrame with Matplotlib - Scatter Plot - how2matplotlib.com')
plt.xlabel('X Value')
plt.ylabel('Y Value')
plt.grid(True)
plt.show()
Output:
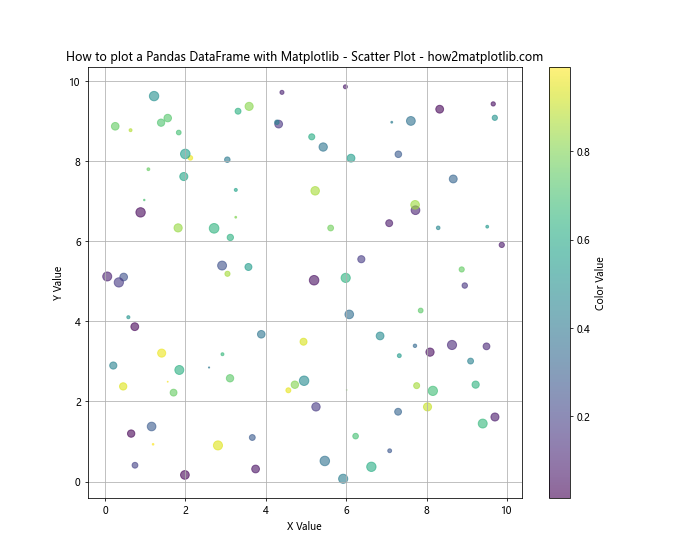
In this example, we create a DataFrame with X and Y coordinates, as well as size and color values for each point. We then use plt.scatter() to create a scatter plot, where the size and color of each point are determined by the corresponding columns in the DataFrame.
Histograms: Analyzing Data Distribution
Histograms are essential for understanding the distribution of your data. When plotting a Pandas DataFrame with Matplotlib, histograms can reveal important insights about the frequency and spread of your values.
Here’s an example of how to create a histogram from a Pandas DataFrame:
import pandas as pd
import matplotlib.pyplot as plt
import numpy as np

# Create a sample DataFrame
np.random.seed(42)
df = pd.DataFrame({
    'Normal': np.random.normal(loc=0, scale=1, size=1000),
    'Uniform': np.random.uniform(low=-3, high=3, size=1000),
    'Exponential': np.random.exponential(scale=1, size=1000)
})

# Plot histograms
plt.figure(figsize=(12, 6))
df.plot(kind='hist', bins=30, alpha=0.7, density=True)
plt.title('How to plot a Pandas DataFrame with Matplotlib - Histogram - how2matplotlib.com')
plt.xlabel('Value')
plt.ylabel('Density')
plt.legend(loc='best')
plt.grid(True)
plt.show()
Output:
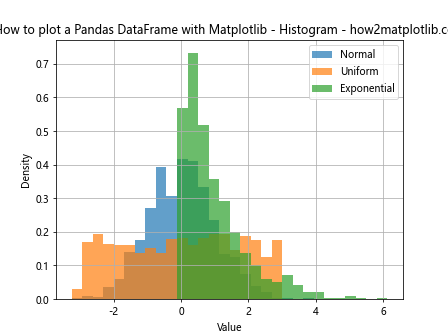
In this example, we create a DataFrame with three columns containing different distributions of data. We then use the plot() method with kind='hist' to create overlapping histograms for each column. The density=True parameter normalizes the histograms to show probability density instead of raw counts.
Box Plots: Summarizing Data Distribution
Box plots, also known as box-and-whisker plots, are excellent for summarizing the distribution of data across categories. When plotting a Pandas DataFrame with Matplotlib, box plots can help you visualize the median, quartiles, and potential outliers in your data.
Here’s an example of how to create a box plot from a Pandas DataFrame:
import pandas as pd
import matplotlib.pyplot as plt
import numpy as np

# Create a sample DataFrame
np.random.seed(42)
df = pd.DataFrame({
    'Group A': np.random.normal(loc=0, scale=1, size=100),
    'Group B': np.random.normal(loc=2, scale=1.5, size=100),
    'Group C': np.random.normal(loc=-1, scale=2, size=100)
})

# Plot box plot
plt.figure(figsize=(10, 6))
df.plot(kind='box', whis=1.5)
plt.title('How to plot a Pandas DataFrame with Matplotlib - Box Plot - how2matplotlib.com')
plt.ylabel('Value')
plt.grid(axis='y')
plt.show()
Output:
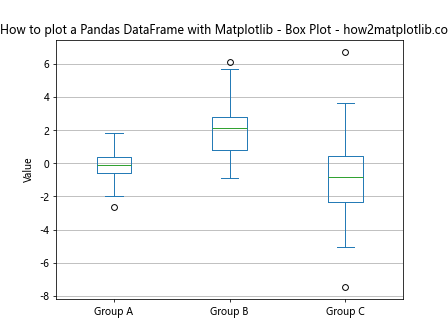
In this example, we create a DataFrame with three columns representing different groups of data. We then use the plot() method with kind='box' to create a box plot for each group. The whis parameter controls the extent of the whiskers, which are set to 1.5 times the interquartile range by default.
Heatmaps: Visualizing 2D Data
Heatmaps are useful for visualizing 2D data, such as correlation matrices or any data that can be represented in a grid format. When plotting a Pandas DataFrame with Matplotlib, heatmaps can reveal patterns and relationships in your data that might not be apparent in other plot types.
Here’s an example of how to create a heatmap from a Pandas DataFrame:
import pandas as pd
import matplotlib.pyplot as plt
import numpy as np
import seaborn as sns

# Create a sample DataFrame
np.random.seed(42)
df = pd.DataFrame(np.random.rand(10, 10), columns=[f'Col{i}' for i in range(10)])

# Calculate correlation matrix
corr_matrix = df.corr()

# Plot heatmap
plt.figure(figsize=(10, 8))
sns.heatmap(corr_matrix, annot=True, cmap='coolwarm', vmin=-1, vmax=1, center=0)
plt.title('How to plot a Pandas DataFrame with Matplotlib - Heatmap - how2matplotlib.com')
plt.show()
Output:
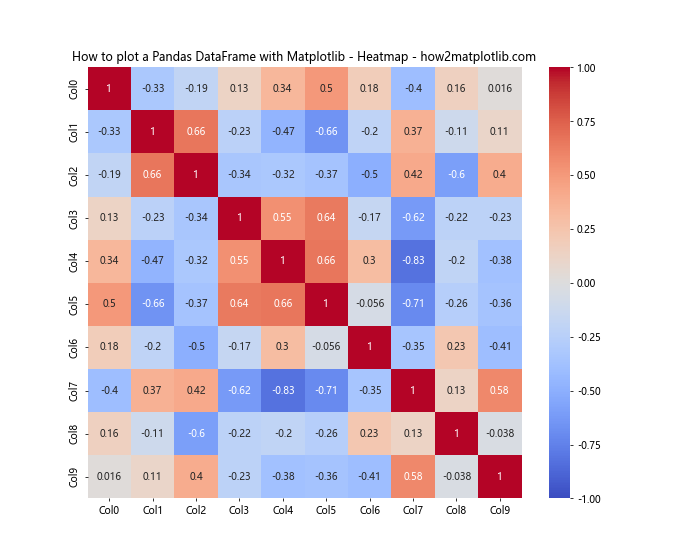
In this example, we create a DataFrame with random data and calculate its correlation matrix. We then use Seaborn’s heatmap() function, which is built on top of Matplotlib, to create a heatmap of the correlation matrix. The annot=True parameter adds numeric annotations to each cell.
Subplots: Combining Multiple Visualizations
When working with complex datasets, you often need to create multiple plots to fully explore your data. Matplotlib’s subplot functionality allows you to combine multiple plots into a single figure when plotting a Pandas DataFrame.
Here’s an example of how to create subplots using a Pandas DataFrame:
import pandas as pd
import matplotlib.pyplot as plt
import numpy as np

# Create a sample DataFrame
np.random.seed(42)
df = pd.DataFrame({
    'A': np.random.normal(loc=0, scale=1, size=1000),
    'B': np.random.normal(loc=2, scale=1.5, size=1000),
    'C': np.random.exponential(scale=2, size=1000)
})

# Create subplots
fig, axes = plt.subplots(2, 2, figsize=(12, 10))
fig.suptitle('How to plot a Pandas DataFrame with Matplotlib - Subplots - how2matplotlib.com', fontsize=16)

# Histogram
df.plot(kind='hist', bins=30, alpha=0.7, ax=axes[0, 0])
axes[0, 0].set_title('Histogram')
axes[0, 0].set_xlabel('Value')
axes[0, 0].set_ylabel('Frequency')

# Box plot
df.plot(kind='box', ax=axes[0, 1])
axes[0, 1].set_title('Box Plot')
axes[0, 1].set_ylabel('Value')

# Scatter plot
df.plot(kind='scatter', x='A', y='B', ax=axes[1, 0])
axes[1, 0].set_title('Scatter Plot')
axes[1, 0].set_xlabel('A')
axes[1, 0].set_ylabel('B')

# KDE plot
df.plot(kind='kde', ax=axes[1, 1])
axes[1, 1].set_title('KDE Plot')
axes[1, 1].set_xlabel('Value')
axes[1, 1].set_ylabel('Density')

plt.tight_layout()
plt.show()
Output:
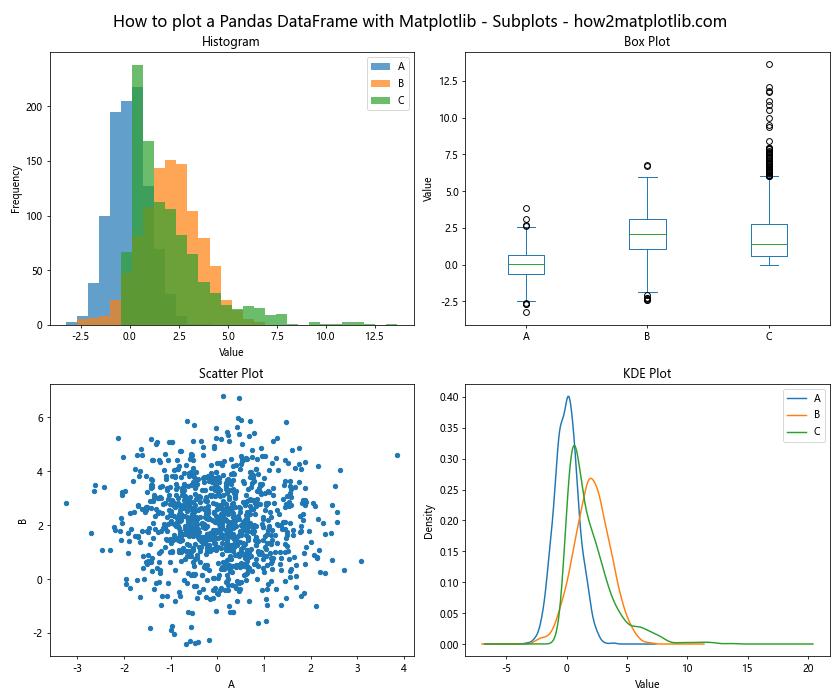
In this example, we create a DataFrame with three columns of different distributions. We then use plt.subplots() to create a 2×2 grid of subplots. Each subplot displays a different type of visualization: histogram, box plot, scatter plot, and KDE plot. This approach allows you to compare different aspects of your data in a single figure.
Handling Missing Data in Plots
When plotting a Pandas DataFrame with Matplotlib, you may encounter missing data. Matplotlib provides several options for handling these gaps in your data visualization.
Here’s an example of how to plot a DataFrame with missing data:
import pandas as pd
import matplotlib.pyplot as plt
import numpy as np

# Create a sample DataFrame with missing data
np.random.seed(42)
dates = pd.date_range(start='2023-01-01', end='2023-12-31', freq='D')
values = np.random.randn(len(dates))
values[50:100] = np.nan  # Introduce missing data
df = pd.DataFrame({'Date': dates, 'Value': values})
df.set_index('Date', inplace=True)

# Plot the DataFrame with missing data
plt.figure(figsize=(12, 6))
df['Value'].plot(linewidth=2, color='#1e88e5', label='Original Data')
df['Value'].interpolate().plot(linewidth=2, color='#43a047', linestyle='--', label='Interpolated Data')

plt.title('How to plot a Pandas DataFrame with Matplotlib - Handling Missing Data - how2matplotlib.com', fontsize=16)
plt.xlabel('Date', fontsize=12)
plt.ylabel('Value', fontsize=12)
plt.legend(loc='best')
plt.grid(True, alpha=0.3)
plt.show()
Output:
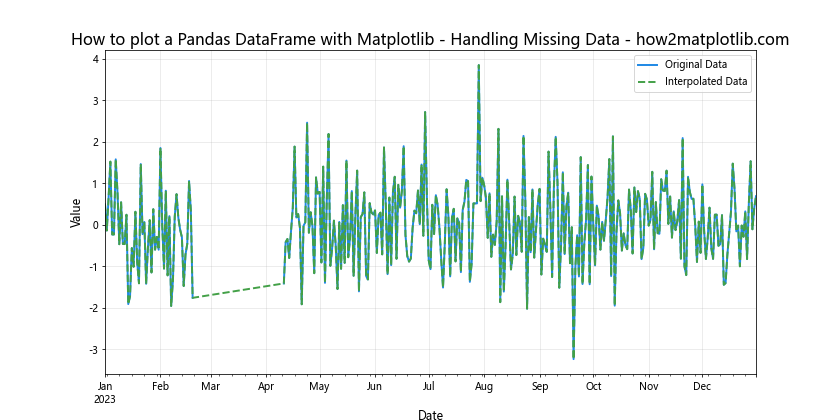
In this example, we create a DataFrame with a time series that includes a period of missing data. We then plot both the original data (with gaps) and an interpolated version to show how missing data can be handled visually.
Plotting Multiple DataFrames Together
Sometimes you may need to plot data from multiple DataFrames on the same graph. This can be useful for comparing different datasets or showing relationships between separate data sources.
Here’s an example of how to plot multiple DataFrames together:
import pandas as pd
import matplotlib.pyplot as plt
import numpy as np

# Create sample DataFrames
np.random.seed(42)
dates = pd.date_range(start='2023-01-01', end='2023-12-31', freq='D')
df1 = pd.DataFrame({'Date': dates, 'Value1': np.cumsum(np.random.randn(len(dates)))})
df2 = pd.DataFrame({'Date': dates, 'Value2': np.cumsum(np.random.randn(len(dates)))})

# Plot multiple DataFrames
plt.figure(figsize=(12, 6))
plt.plot(df1['Date'], df1['Value1'], label='Dataset 1', linewidth=2, color='#1e88e5')
plt.plot(df2['Date'], df2['Value2'], label='Dataset 2', linewidth=2, color='#43a047')

plt.title('How to plot a Pandas DataFrame with Matplotlib - Multiple DataFrames - how2matplotlib.com', fontsize=16)
plt.xlabel('Date', fontsize=12)
plt.ylabel('Cumulative Value', fontsize=12)
plt.legend(loc='best')
plt.grid(True, alpha=0.3)
plt.show()
Output:
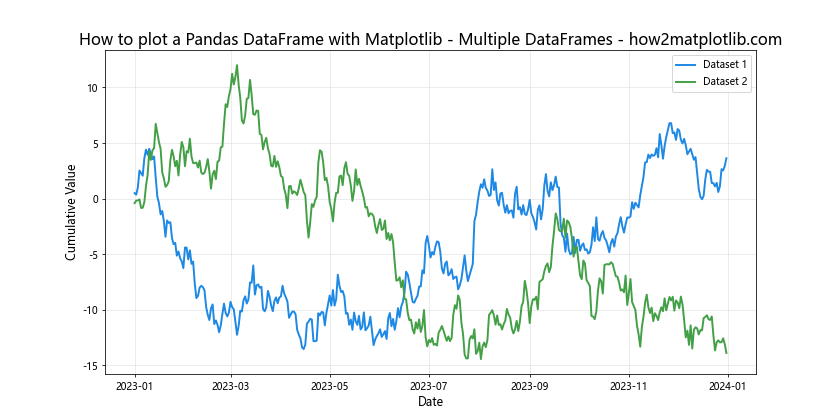
In this example, we create two separate DataFrames with different cumulative random walks. We then plot both datasets on the same graph, using different colors to distinguish between them.
Creating Stacked Area Plots
Stacked area plots are useful for visualizing how different components contribute to a total over time. When plotting a Pandas DataFrame with Matplotlib, stacked area plots can help show the composition of your data.
Here’s an example of how to create a stacked area plot from a Pandas DataFrame:
import pandas as pd
import matplotlib.pyplot as plt
import numpy as np

# Create a sample DataFrame
np.random.seed(42)
dates = pd.date_range(start='2023-01-01', end='2023-12-31', freq='D')
df = pd.DataFrame({
    'Date': dates,
    'A': np.cumsum(np.random.rand(len(dates))),
    'B': np.cumsum(np.random.rand(len(dates))),
    'C': np.cumsum(np.random.rand(len(dates)))
})
df.set_index('Date', inplace=True)

# Create a stacked area plot
plt.figure(figsize=(12, 6))
df.plot.area(stacked=True, alpha=0.7)

plt.title('How to plot a Pandas DataFrame with Matplotlib - Stacked Area Plot - how2matplotlib.com', fontsize=16)
plt.xlabel('Date', fontsize=12)
plt.ylabel('Cumulative Value', fontsize=12)
plt.legend(loc='upper left')
plt.grid(True, alpha=0.3)
plt.show()
Output:
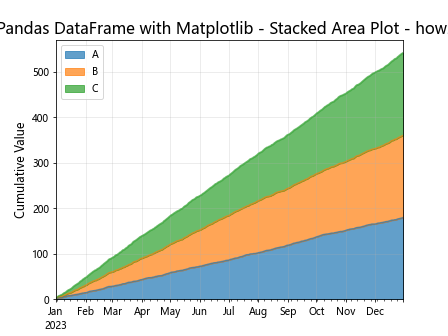
In this example, we create a DataFrame with three columns of cumulative random values. We then use the plot.area() method with stacked=True to create a stacked area plot, showing how each component contributes to the total over time.
Creating Animated Plots
Animated plots can be a powerful way to show changes in your data over time. While Matplotlib itself doesn’t provide direct support for animations, you can use the animation module to create animated plots from your Pandas DataFrames.
Here’s an example of how to create a simple animated line plot:
import pandas as pd
import matplotlib.pyplot as plt
import numpy as np
from matplotlib.animation import FuncAnimation

# Create a sample DataFrame
np.random.seed(42)
dates = pd.date_range(start='2023-01-01', end='2023-12-31', freq='D')
df = pd.DataFrame({
    'Date': dates,
    'Value': np.cumsum(np.random.randn(len(dates)))
})
df.set_index('Date', inplace=True)

# Set up the plot
fig, ax = plt.subplots(figsize=(12, 6))
line, = ax.plot([], [], lw=2)
ax.set_xlim(df.index.min(), df.index.max())
ax.set_ylim(df['Value'].min(), df['Value'].max())
ax.set_title('How to plot a Pandas DataFrame with Matplotlib - Animated Plot - how2matplotlib.com', fontsize=16)
ax.set_xlabel('Date', fontsize=12)
ax.set_ylabel('Value', fontsize=12)

# Animation function
def animate(i):
    data = df.iloc[:int(i+1)]
    line.set_data(data.index, data['Value'])
    return line,

# Create the animation
anim = FuncAnimation(fig, animate, frames=len(df), interval=50, blit=True)

plt.show()
Output:
In this example, we create a DataFrame with a time series of cumulative random values. We then use the FuncAnimation class to create an animation that gradually reveals the data over time. Note that to actually save this animation, you would need to use a writer like FFMpegWriter or PillowWriter.
Conclusion
Learning how to plot a Pandas DataFrame with Matplotlib is an essential skill for data visualization in Python. This comprehensive guide has covered a wide range of plotting techniques, from basic line plots to advanced customizations and animations. By mastering these techniques, you’ll be able to create informative and visually appealing visualizations of your data.
Remember that the key to effective data visualization is not just knowing how to create plots, but also understanding which type of plot best suits your data and the story you want to tell. Experiment with different plot types and customizations to find the most effective way to communicate your insights.