Comprehensive Guide to Using Matplotlib.artist.Artist.set_gid() in Python for Data Visualization
Matplotlib.artist.Artist.set_gid() in Python is a powerful method that allows you to set the group id for an Artist object in Matplotlib. This function is essential for organizing and manipulating graphical elements in your plots. In this comprehensive guide, we’ll explore the various aspects of Matplotlib.artist.Artist.set_gid() in Python, providing detailed explanations and practical examples to help you master this important feature.
Understanding Matplotlib.artist.Artist.set_gid() in Python
Matplotlib.artist.Artist.set_gid() in Python is a method that belongs to the Artist class in Matplotlib. It is used to set a unique identifier for a group of artists, which can be useful for various purposes such as styling, selection, and manipulation of plot elements. The set_gid() method is particularly helpful when working with complex visualizations that involve multiple layers or groups of elements.
Let’s start with a simple example to demonstrate how to use Matplotlib.artist.Artist.set_gid() in Python:
import matplotlib.pyplot as plt

fig, ax = plt.subplots()
circle = plt.Circle((0.5, 0.5), 0.2, color='blue')
circle.set_gid('how2matplotlib.com_circle')
ax.add_artist(circle)

plt.show()
Output:
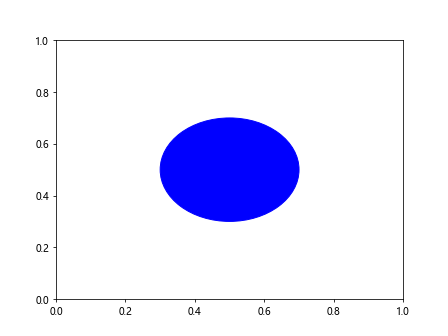
In this example, we create a circle using plt.Circle() and then use the set_gid() method to assign a group id ‘how2matplotlib.com_circle’ to the circle artist. This allows us to easily identify and manipulate this specific circle later in our code.
Benefits of Using Matplotlib.artist.Artist.set_gid() in Python
Matplotlib.artist.Artist.set_gid() in Python offers several advantages when working with complex visualizations:
- Organization: It helps in organizing and categorizing different elements of your plot.
- Selective styling: You can apply styles to specific groups of artists.
- Easy manipulation: It allows for easier selection and manipulation of groups of artists.
- Improved interactivity: It enhances the ability to create interactive plots by associating elements with specific identifiers.
Let’s explore these benefits with another example:
import matplotlib.pyplot as plt

fig, ax = plt.subplots()

# Create multiple circles with different group ids
for i in range(3):
    for j in range(3):
        circle = plt.Circle((i/3, j/3), 0.1, color='blue')
        circle.set_gid(f'how2matplotlib.com_circle_{i}_{j}')
        ax.add_artist(circle)

# Style circles in the first row
for artist in ax.get_children():
    if artist.get_gid() and artist.get_gid().startswith('how2matplotlib.com_circle_0'):
        artist.set_color('red')

plt.show()
Output:
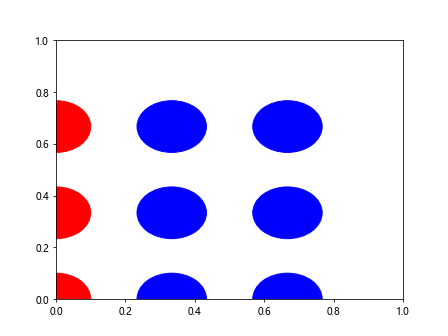
In this example, we create a 3×3 grid of circles and assign unique group ids to each circle. We then use these group ids to selectively style the circles in the first row by changing their color to red.
Advanced Usage of Matplotlib.artist.Artist.set_gid() in Python
Matplotlib.artist.Artist.set_gid() in Python can be used in more advanced scenarios to create complex and interactive visualizations. Let’s explore some of these advanced use cases:
Creating Layered Visualizations
Matplotlib.artist.Artist.set_gid() in Python is particularly useful when creating layered visualizations. By assigning different group ids to different layers, you can easily manipulate and style each layer independently.
Here’s an example that demonstrates this concept:
import matplotlib.pyplot as plt
import numpy as np

fig, ax = plt.subplots()

# Create background layer
background = plt.Rectangle((0, 0), 1, 1, color='lightgray')
background.set_gid('how2matplotlib.com_background')
ax.add_artist(background)

# Create data layer
x = np.linspace(0, 1, 100)
y = np.sin(2 * np.pi * x)
line, = ax.plot(x, y, color='blue')
line.set_gid('how2matplotlib.com_data')

# Create annotation layer
annotation = ax.annotate('Peak', xy=(0.25, 1), xytext=(0.4, 0.8),
                         arrowprops=dict(facecolor='black', shrink=0.05))
annotation.set_gid('how2matplotlib.com_annotation')

plt.show()
Output:
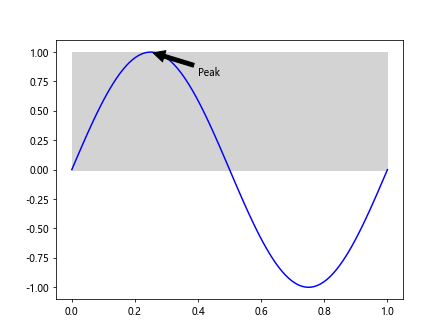
In this example, we create three layers: a background layer, a data layer, and an annotation layer. Each layer is assigned a unique group id using Matplotlib.artist.Artist.set_gid() in Python, allowing for easy manipulation and styling of each layer independently.
Interactive Element Selection
Matplotlib.artist.Artist.set_gid() in Python can be used to create interactive plots where users can select and manipulate specific elements. Here’s an example that demonstrates this concept:
import matplotlib.pyplot as plt
from matplotlib.widgets import Button

fig, ax = plt.subplots()

circles = []
for i in range(3):
    circle = plt.Circle((i/2, 0.5), 0.1, color='blue')
    circle.set_gid(f'how2matplotlib.com_circle_{i}')
    ax.add_artist(circle)
    circles.append(circle)

def on_click(event):
    for circle in circles:
        if circle.get_gid() == 'how2matplotlib.com_circle_1':
            circle.set_color('red')
    fig.canvas.draw()

button_ax = plt.axes([0.7, 0.05, 0.1, 0.075])
button = Button(button_ax, 'Select')
button.on_clicked(on_click)

plt.show()
Output:
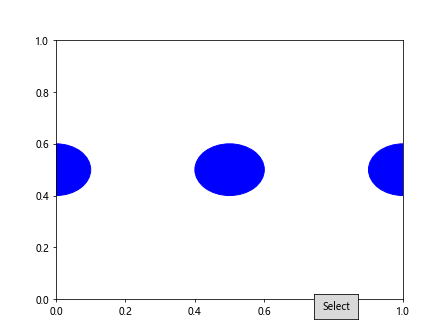
In this example, we create three circles and assign them unique group ids using Matplotlib.artist.Artist.set_gid() in Python. We then add a button that, when clicked, changes the color of the middle circle by selecting it based on its group id.
Best Practices for Using Matplotlib.artist.Artist.set_gid() in Python
When working with Matplotlib.artist.Artist.set_gid() in Python, it’s important to follow some best practices to ensure efficient and maintainable code:
- Use descriptive group ids: Choose group ids that clearly describe the purpose or content of the artist or group of artists.
- Be consistent: Use a consistent naming convention for your group ids across your project.
- Avoid overuse: While group ids are useful, don’t assign them to every single artist unless necessary.
- Document your group ids: Keep a record of the group ids you’ve used and their purposes, especially in large projects.
Let’s see an example that demonstrates these best practices:
import matplotlib.pyplot as plt
import numpy as np

fig, ax = plt.subplots()

# Main data
x = np.linspace(0, 10, 100)
y1 = np.sin(x)
y2 = np.cos(x)

line1, = ax.plot(x, y1, color='blue')
line1.set_gid('how2matplotlib.com_main_data_sin')

line2, = ax.plot(x, y2, color='red')
line2.set_gid('how2matplotlib.com_main_data_cos')

# Annotations
ax.annotate('Sin peak', xy=(np.pi/2, 1), xytext=(np.pi/2 + 0.5, 1.2),
            arrowprops=dict(facecolor='black', shrink=0.05))
ax.annotate('Cos peak', xy=(0, 1), xytext=(0.5, 1.2),
            arrowprops=dict(facecolor='black', shrink=0.05))

# Legend
ax.legend(['Sin', 'Cos'])

plt.show()
Output:
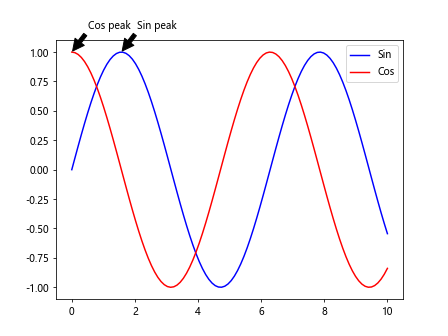
In this example, we use descriptive group ids for the main data lines (‘how2matplotlib.com_main_data_sin’ and ‘how2matplotlib.com_main_data_cos’). We don’t assign group ids to the annotations or legend as they’re not necessary for our current purposes.
Common Pitfalls and How to Avoid Them
When using Matplotlib.artist.Artist.set_gid() in Python, there are some common pitfalls that you should be aware of:
- Overwriting existing group ids: Be careful not to accidentally overwrite existing group ids.
- Case sensitivity: Group ids are case-sensitive, so ‘MyGroup’ and ‘mygroup’ are treated as different ids.
- Performance impact: Assigning too many group ids can potentially impact performance in very large plots.
Let’s look at an example that demonstrates how to avoid these pitfalls:
import matplotlib.pyplot as plt

fig, ax = plt.subplots()

# Create a circle and assign a group id
circle = plt.Circle((0.5, 0.5), 0.2, color='blue')
circle.set_gid('how2matplotlib.com_main_circle')
ax.add_artist(circle)

# Check if the group id already exists before assigning a new one
if not circle.get_gid():
    circle.set_gid('how2matplotlib.com_new_id')

# Use consistent case for group ids
rectangle = plt.Rectangle((0.2, 0.2), 0.3, 0.3, color='red')
rectangle.set_gid('how2matplotlib.com_main_rectangle')  # Not 'Main_Rectangle' or 'MAIN_RECTANGLE'
ax.add_artist(rectangle)

# Only assign group ids when necessary
for i in range(100):
    point = ax.plot(i/100, i/100, 'ko')[0]
    # We don't assign group ids to these points as it's not necessary

plt.show()
Output:
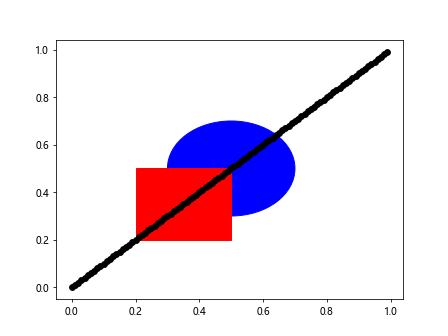
In this example, we demonstrate how to avoid overwriting existing group ids, use consistent case for group ids, and avoid assigning unnecessary group ids to improve performance.
Integrating Matplotlib.artist.Artist.set_gid() with Other Matplotlib Features
Matplotlib.artist.Artist.set_gid() in Python can be effectively integrated with other Matplotlib features to create more powerful and flexible visualizations. Let’s explore some of these integrations:
Working with Subplots
Matplotlib.artist.Artist.set_gid() in Python can be particularly useful when working with subplots, allowing you to manage and style elements across multiple plots:
import matplotlib.pyplot as plt
import numpy as np

fig, (ax1, ax2) = plt.subplots(1, 2, figsize=(10, 5))

x = np.linspace(0, 10, 100)
y1 = np.sin(x)
y2 = np.cos(x)

# First subplot
line1, = ax1.plot(x, y1)
line1.set_gid('how2matplotlib.com_data_sin')

# Second subplot
line2, = ax2.plot(x, y2)
line2.set_gid('how2matplotlib.com_data_cos')

# Style elements across subplots
for ax in fig.get_axes():
    for artist in ax.get_children():
        if artist.get_gid() == 'how2matplotlib.com_data_sin':
            artist.set_color('blue')
        elif artist.get_gid() == 'how2matplotlib.com_data_cos':
            artist.set_color('red')

plt.show()
Output:
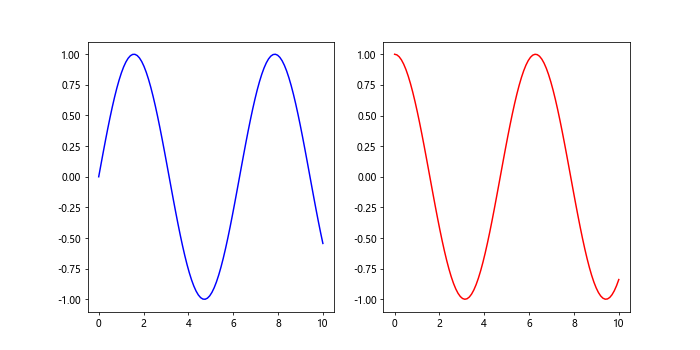
In this example, we create two subplots and use Matplotlib.artist.Artist.set_gid() in Python to assign group ids to the lines in each subplot. We then use these group ids to style the lines consistently across both subplots.
Advanced Techniques with Matplotlib.artist.Artist.set_gid() in Python
Let’s explore some advanced techniques using Matplotlib.artist.Artist.set_gid() in Python:
Dynamic Group ID Assignment
You can dynamically assign group ids based on data characteristics:
import matplotlib.pyplot as plt
import numpy as np

fig, ax = plt.subplots()

x = np.linspace(0, 10, 100)
y = np.sin(x)

for i, (xi, yi) in enumerate(zip(x, y)):
    point = ax.plot(xi, yi, 'o')[0]
    if yi > 0:
        point.set_gid('how2matplotlib.com_positive')
    else:
        point.set_gid('how2matplotlib.com_negative')

# Style points based on their group id
for artist in ax.get_children():
    if artist.get_gid() == 'how2matplotlib.com_positive':
        artist.set_color('red')
    elif artist.get_gid() == 'how2matplotlib.com_negative':
        artist.set_color('blue')

plt.show()
Output:
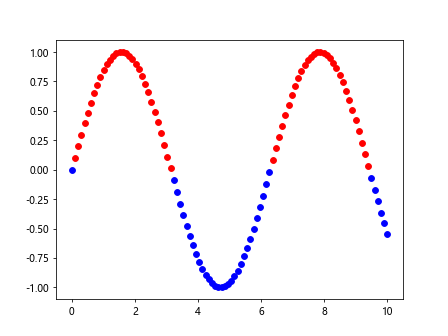
In this example, we dynamically assign group ids to points based on whether their y-value is positive or negative, and then style them accordingly.
Using Group IDs for Animation
Matplotlib.artist.Artist.set_gid() in Python can be useful in creating animations by allowing you to easily select and update specific elements:
import matplotlib.pyplot as plt
import matplotlib.animation as animation
import numpy as np

fig, ax = plt.subplots()

x = np.linspace(0, 2*np.pi, 100)
line, = ax.plot(x, np.sin(x))
line.set_gid('how2matplotlib.com_animated_line')

def animate(frame):
    line = next(artist for artist in ax.get_children() if artist.get_gid() == 'how2matplotlib.com_animated_line')
    line.set_ydata(np.sin(x + frame/10))
    return line,

ani = animation.FuncAnimation(fig, animate, frames=100, blit=True)

plt.show()
Output:
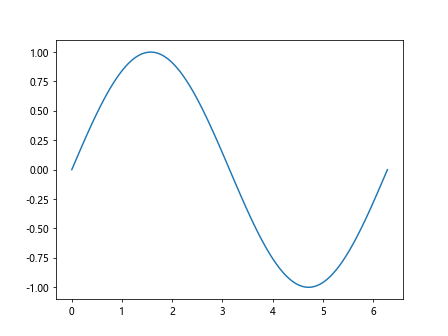
In this example, we create an animated sine wave and use Matplotlib.artist.Artist.set_gid() in Python to easily select and update the line in each frame of the animation.
Troubleshooting Common Issues with Matplotlib.artist.Artist.set_gid() in Python
When working with Matplotlib.artist.Artist.set_gid() in Python, you might encounter some common issues. Let’s address these and provide solutions:
Issue 1: Group ID Not Applying
If you find that your group id is not being applied or recognized, it might be because the artist hasn’t been added to the axes or figure yet. Always make sure to add the artist to the plot before trying to manipulate it based on its group id.
Here’s an example of how to correctly apply a group id:
import matplotlib.pyplot as plt

fig, ax = plt.subplots()

circle = plt.Circle((0.5, 0.5), 0.2, color='blue')
circle.set_gid('how2matplotlib.com_circle')
ax.add_artist(circle)  # Add the artist to the axes

# Now you can manipulate the circle using its group id
for artist in ax.get_children():
    if artist.get_gid() == 'how2matplotlib.com_circle':
        artist.set_color('red')

plt.show()
Output:
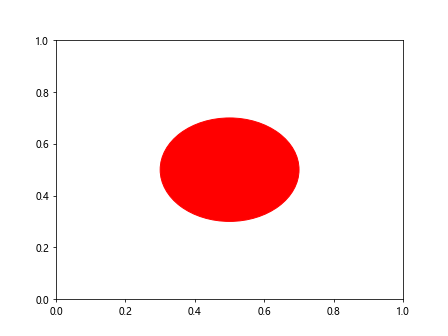
In this example, we make sure to add the circle to the axes before trying to manipulate it based on its group id.
Issue 2: Case Sensitivity
Remember that group ids are case-sensitive. ‘MyGroup’ and ‘mygroup’ are treated as different ids. Always be consistent with your capitalization.
Here’s an example demonstrating this:
import matplotlib.pyplot as plt

fig, ax = plt.subplots()

circle1 = plt.Circle((0.3, 0.5), 0.1, color='blue')
circle1.set_gid('How2matplotlib.com_Circle')
ax.add_artist(circle1)

circle2 = plt.Circle((0.7, 0.5), 0.1, color='red')
circle2.set_gid('how2matplotlib.com_circle')
ax.add_artist(circle2)

# This will only change circle1
for artist in ax.get_children():
    if artist.get_gid() == 'How2matplotlib.com_Circle':
        artist.set_color('green')

plt.show()
Output:
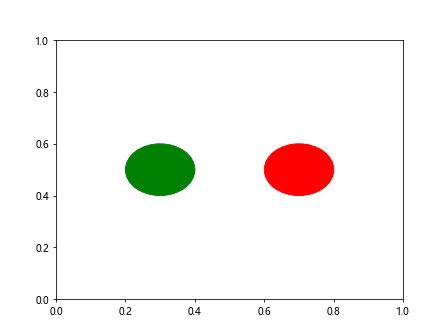
In this example, only the first circle will change color because its group id exactly matches the one we’re checking for, including the capitalization.
Best Practices for Efficient Use of Matplotlib.artist.Artist.set_gid() in Python
To make the most of Matplotlib.artist.Artist.set_gid() in Python, consider the following best practices:
- Use meaningful names: Choose group ids that clearly describe the purpose or content of the artist or group of artists.
Be consistent: Use a consistent naming convention for your group ids across your project.
Document your group ids: Keep a record of the group ids you’ve used and their purposes, especially in large projects.
Use group ids sparingly: Only assign group ids when necessary. Overuse can lead to cluttered and hard-to-maintain code.
Consider using prefixes: If you’re working on a large project with many group ids, consider using prefixes to categorize them.
Here’s an example implementing these best practices: