How to Fill Between Multiple Lines in Matplotlib
How to Fill Between Multiple Lines in Matplotlib is an essential skill for data visualization enthusiasts and professionals alike. This article will delve deep into the various techniques and methods to achieve this effect using Matplotlib, one of the most popular plotting libraries in Python. We’ll explore different scenarios, provide numerous examples, and offer detailed explanations to help you master the art of filling between multiple lines in Matplotlib.
Understanding the Basics of Filling Between Lines in Matplotlib
Before we dive into the complexities of filling between multiple lines, it’s crucial to understand the fundamental concept of filling between lines in Matplotlib. The fill_between() function is the primary tool used to achieve this effect. Let’s start with a simple example to illustrate how to fill between multiple lines in Matplotlib:
import matplotlib.pyplot as plt
import numpy as np
x = np.linspace(0, 10, 100)
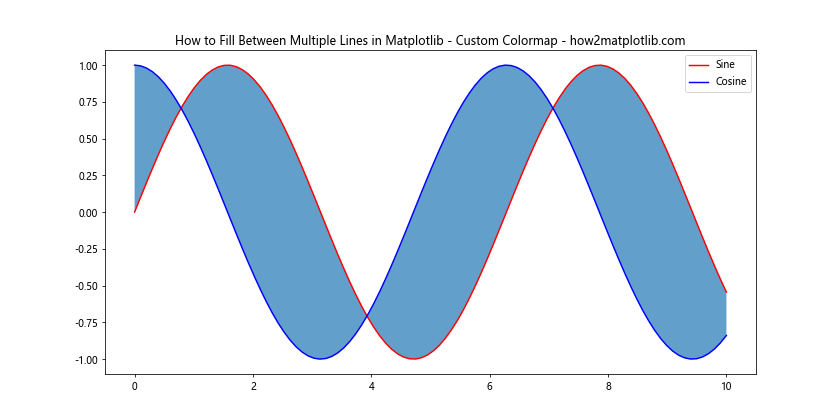
y1 = np.sin(x)
y2 = np.cos(x)
plt.figure(figsize=(10, 6))
plt.plot(x, y1, label='Sine')
plt.plot(x, y2, label='Cosine')
plt.fill_between(x, y1, y2, alpha=0.3)
plt.title('How to Fill Between Multiple Lines in Matplotlib - how2matplotlib.com')
plt.legend()
plt.show()
Output:
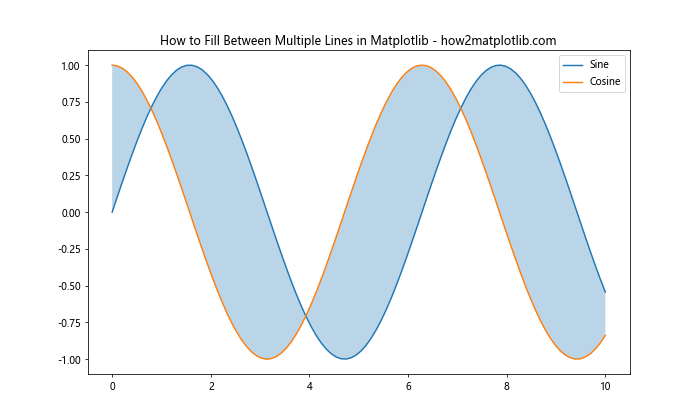
In this example, we’ve created two lines using sine and cosine functions and filled the area between them. The fill_between() function takes the x-axis values and the two y-axis values as arguments, filling the area between the two lines.
Advanced Techniques for Filling Between Multiple Lines
Now that we’ve covered the basics, let’s explore more advanced techniques for filling between multiple lines in Matplotlib. These methods will allow you to create more complex and visually appealing plots.
Filling Above and Below a Threshold
One common scenario is filling areas above and below a certain threshold. Here’s how to fill between multiple lines in Matplotlib when dealing with thresholds:
import matplotlib.pyplot as plt
import numpy as np

x = np.linspace(0, 10, 100)
y = np.sin(x)
threshold = 0.5

plt.figure(figsize=(10, 6))
plt.plot(x, y, label='Sine Wave')
plt.axhline(y=threshold, color='r', linestyle='--', label='Threshold')
plt.fill_between(x, y, threshold, where=(y > threshold), alpha=0.3, color='g', label='Above Threshold')
plt.fill_between(x, y, threshold, where=(y <= threshold), alpha=0.3, color='r', label='Below Threshold')
plt.title('How to Fill Between Multiple Lines in Matplotlib - Threshold Example - how2matplotlib.com')
plt.legend()
plt.show()
Output:
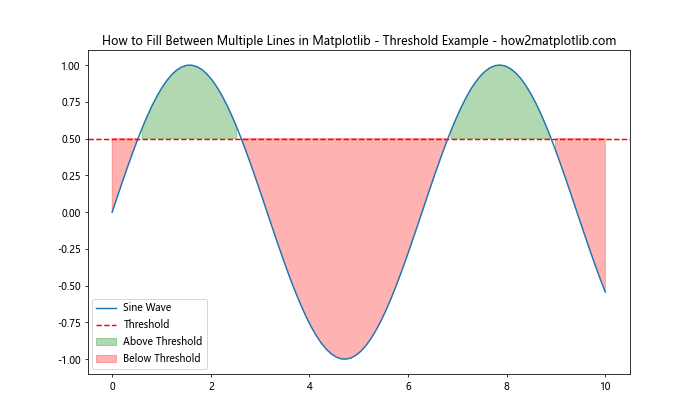
This example demonstrates how to fill between multiple lines in Matplotlib by coloring areas above and below a threshold differently. The where parameter in the fill_between() function allows us to specify conditions for filling.
Filling Between Intersecting Lines
When dealing with intersecting lines, you might want to fill areas where one line is above another. Here's how to achieve this effect:
import matplotlib.pyplot as plt
import numpy as np

x = np.linspace(0, 10, 100)
y1 = np.sin(x)
y2 = np.cos(x)

plt.figure(figsize=(10, 6))
plt.plot(x, y1, label='Sine')
plt.plot(x, y2, label='Cosine')
plt.fill_between(x, y1, y2, where=(y1 > y2), alpha=0.3, color='g', label='Sine > Cosine')
plt.fill_between(x, y1, y2, where=(y1 <= y2), alpha=0.3, color='r', label='Sine <= Cosine')
plt.title('How to Fill Between Multiple Lines in Matplotlib - Intersecting Lines - how2matplotlib.com')
plt.legend()
plt.show()
Output:
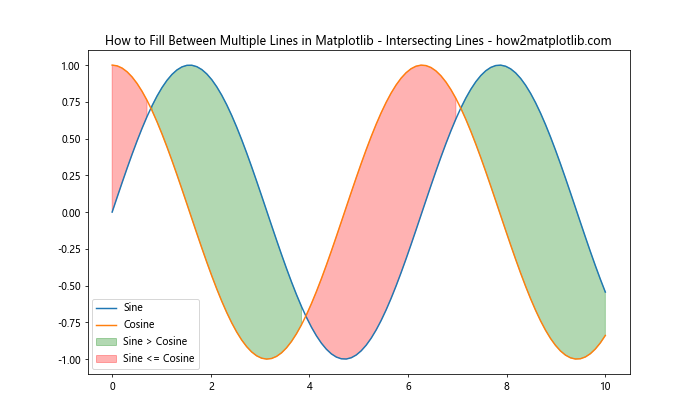
This example shows how to fill between multiple lines in Matplotlib when the lines intersect, using different colors to highlight areas where one function is greater than the other.
Customizing Fill Styles and Colors
When learning how to fill between multiple lines in Matplotlib, it's important to understand how to customize the appearance of the filled areas. Let's explore various ways to modify fill styles and colors.
Using Different Fill Patterns
Matplotlib offers various fill patterns that you can use to distinguish between different areas:
import matplotlib.pyplot as plt
import numpy as np

x = np.linspace(0, 10, 100)
y1 = np.sin(x)
y2 = np.cos(x)

plt.figure(figsize=(10, 6))
plt.plot(x, y1, label='Sine')
plt.plot(x, y2, label='Cosine')
plt.fill_between(x, y1, y2, where=(y1 > y2), hatch='///', alpha=0.3, label='Sine > Cosine')
plt.fill_between(x, y1, y2, where=(y1 <= y2), hatch='\\\\\\', alpha=0.3, label='Sine <= Cosine')
plt.title('How to Fill Between Multiple Lines in Matplotlib - Fill Patterns - how2matplotlib.com')
plt.legend()
plt.show()
Output:
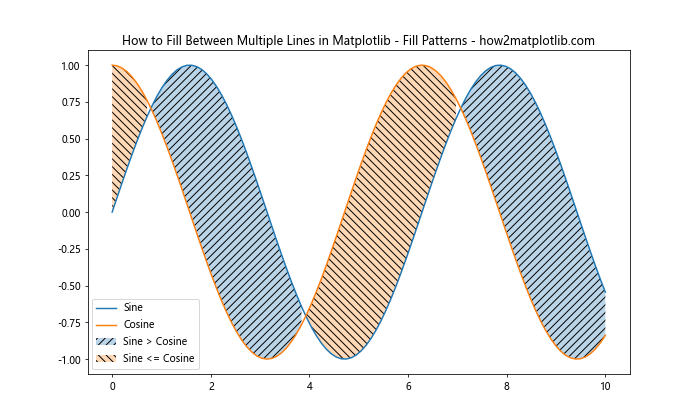
This example demonstrates how to fill between multiple lines in Matplotlib using different hatch patterns to distinguish between areas.
Gradient Fills
For a more visually appealing effect, you can use gradient fills:
import matplotlib.pyplot as plt
import numpy as np
from matplotlib.colors import LinearSegmentedColormap

x = np.linspace(0, 10, 100)
y1 = np.sin(x)
y2 = np.cos(x)

cmap = LinearSegmentedColormap.from_list("", ["blue", "red"])

plt.figure(figsize=(10, 6))
plt.plot(x, y1, label='Sine')
plt.plot(x, y2, label='Cosine')
plt.imshow([[0, 1]], extent=[x.min(), x.max(), y2.min(), y1.max()], aspect='auto', cmap=cmap, alpha=0.3)
plt.fill_between(x, y1, y2, alpha=0.1)
plt.title('How to Fill Between Multiple Lines in Matplotlib - Gradient Fill - how2matplotlib.com')
plt.legend()
plt.show()
Output:
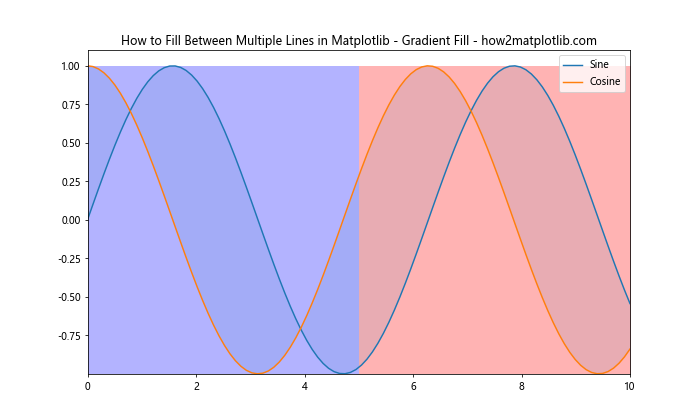
This example shows how to fill between multiple lines in Matplotlib using a gradient fill, creating a smooth transition between colors.
Handling Multiple Datasets
When working with multiple datasets, you might need to fill between multiple lines in Matplotlib across different series. Let's explore some techniques to handle this scenario.
Stacked Area Plots
Stacked area plots are useful for visualizing cumulative data:
import matplotlib.pyplot as plt
import numpy as np

x = np.linspace(0, 10, 100)
y1 = np.sin(x)
y2 = np.sin(x) + 0.5
y3 = np.sin(x) + 1

plt.figure(figsize=(10, 6))
plt.fill_between(x, 0, y1, alpha=0.3, label='Layer 1')
plt.fill_between(x, y1, y2, alpha=0.3, label='Layer 2')
plt.fill_between(x, y2, y3, alpha=0.3, label='Layer 3')
plt.title('How to Fill Between Multiple Lines in Matplotlib - Stacked Area Plot - how2matplotlib.com')
plt.legend()
plt.show()
Output:
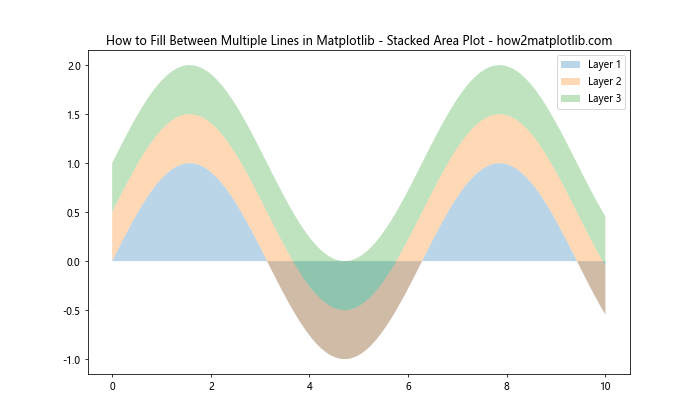
This example demonstrates how to fill between multiple lines in Matplotlib to create a stacked area plot, which is useful for showing cumulative data or proportions.
Overlapping Fills with Transparency
When dealing with overlapping datasets, using transparency can help visualize the intersections:
import matplotlib.pyplot as plt
import numpy as np

x = np.linspace(0, 10, 100)
y1 = np.sin(x)
y2 = np.cos(x)
y3 = np.tan(x)

plt.figure(figsize=(10, 6))
plt.plot(x, y1, label='Sine')
plt.plot(x, y2, label='Cosine')
plt.plot(x, y3, label='Tangent')
plt.fill_between(x, y1, alpha=0.3, label='Sine Area')
plt.fill_between(x, y2, alpha=0.3, label='Cosine Area')
plt.fill_between(x, y3, alpha=0.3, label='Tangent Area')
plt.title('How to Fill Between Multiple Lines in Matplotlib - Overlapping Fills - how2matplotlib.com')
plt.legend()
plt.ylim(-2, 2)
plt.show()
Output:
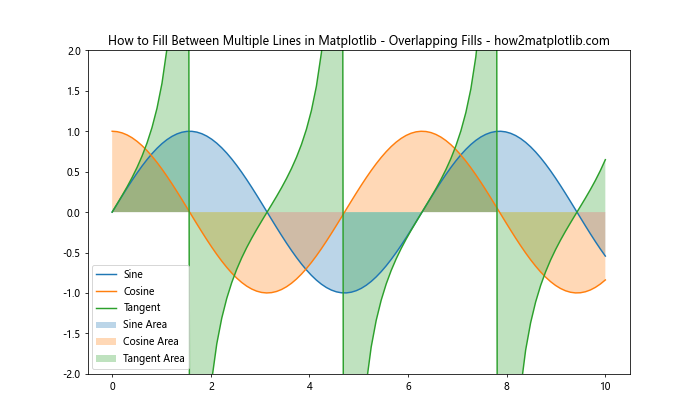
This example shows how to fill between multiple lines in Matplotlib with overlapping areas, using transparency to reveal intersections between different datasets.
Handling Time Series Data
When working with time series data, you might need to fill between multiple lines in Matplotlib to highlight specific periods or trends. Let's explore some techniques for handling time series data.
Filling Between Date Ranges
Here's an example of how to fill between multiple lines in Matplotlib when dealing with date ranges:
import matplotlib.pyplot as plt
import numpy as np
import pandas as pd

dates = pd.date_range(start='2023-01-01', end='2023-12-31', freq='D')
values = np.random.randn(len(dates)).cumsum()

plt.figure(figsize=(12, 6))
plt.plot(dates, values, label='Time Series')
plt.fill_between(dates, values, where=(dates >= pd.to_datetime('2023-06-01')) & (dates <= pd.to_datetime('2023-08-31')),
                 alpha=0.3, label='Summer Period')
plt.title('How to Fill Between Multiple Lines in Matplotlib - Date Ranges - how2matplotlib.com')
plt.legend()
plt.show()
Output:
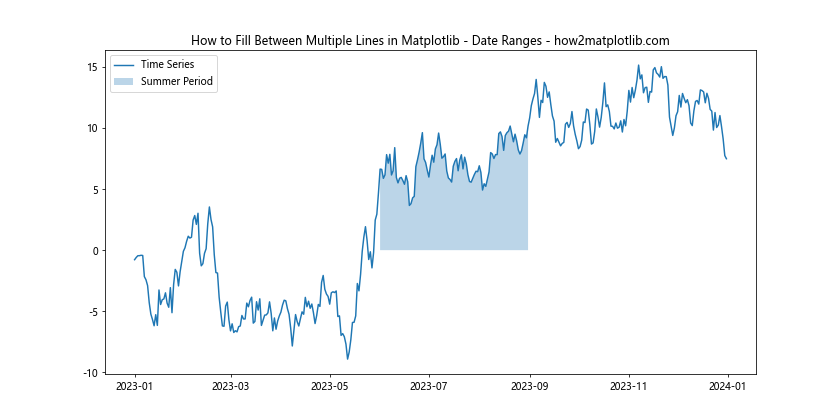
This example demonstrates how to fill between multiple lines in Matplotlib for a specific date range, which can be useful for highlighting seasonal patterns or specific periods of interest.
Filling Between Rolling Averages
When analyzing time series data, it's often useful to visualize the area between rolling averages:
import matplotlib.pyplot as plt
import numpy as np
import pandas as pd

dates = pd.date_range(start='2023-01-01', end='2023-12-31', freq='D')
values = np.random.randn(len(dates)).cumsum()
df = pd.DataFrame({'date': dates, 'value': values})

short_ma = df['value'].rolling(window=7).mean()
long_ma = df['value'].rolling(window=30).mean()

plt.figure(figsize=(12, 6))
plt.plot(df['date'], short_ma, label='7-day MA')
plt.plot(df['date'], long_ma, label='30-day MA')
plt.fill_between(df['date'], short_ma, long_ma, where=(short_ma > long_ma), alpha=0.3, color='g', label='Short > Long')
plt.fill_between(df['date'], short_ma, long_ma, where=(short_ma <= long_ma), alpha=0.3, color='r', label='Short <= Long')
plt.title('How to Fill Between Multiple Lines in Matplotlib - Rolling Averages - how2matplotlib.com')
plt.legend()
plt.show()
Output:
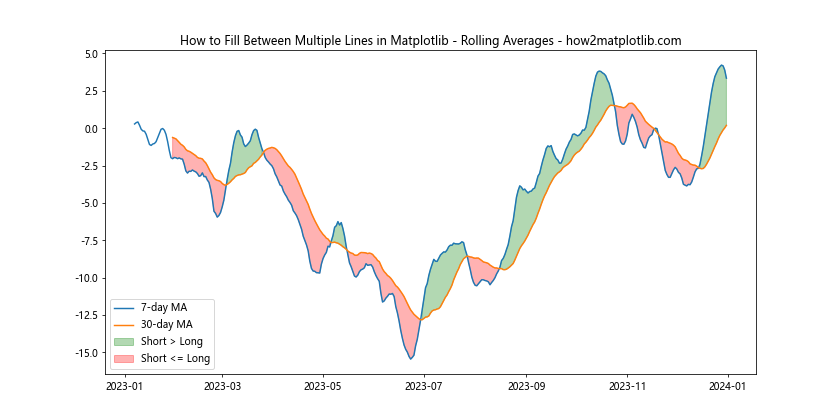
This example shows how to fill between multiple lines in Matplotlib representing different moving averages, which can help visualize trends and crossovers in time series data.
Creating Complex Visualizations
As you become more proficient in how to fill between multiple lines in Matplotlib, you can create more complex and informative visualizations. Let's explore some advanced techniques.
Combining Multiple Fill Types
You can combine different fill types to create rich, informative plots:
import matplotlib.pyplot as plt
import numpy as np

x = np.linspace(0, 10, 100)
y1 = np.sin(x)
y2 = np.cos(x)
y3 = np.exp(-x/10) * np.sin(x)

plt.figure(figsize=(12, 6))
plt.plot(x, y1, label='Sine')
plt.plot(x, y2, label='Cosine')
plt.plot(x, y3, label='Damped Sine')
plt.fill_between(x, y1, y2, where=(y1 > y2), alpha=0.3, color='g', label='Sine > Cosine')
plt.fill_between(x, y1, y2, where=(y1 <= y2), alpha=0.3, color='r', label='Sine <= Cosine')
plt.fill_between(x, y3, alpha=0.2, hatch='///', label='Damped Sine Area')
plt.title('How to Fill Between Multiple Lines in Matplotlib - Combined Fill Types - how2matplotlib.com')
plt.legend()
plt.show()
Output:
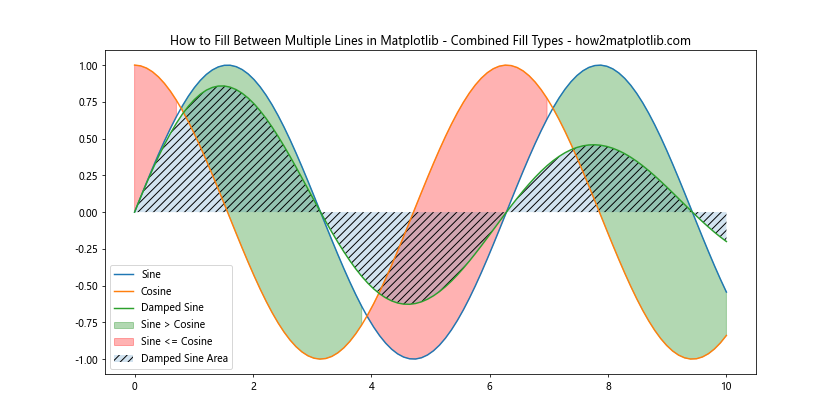
This example demonstrates how to fill between multiple lines in Matplotlib using a combination of solid fills and hatched patterns to represent different relationships between the plotted functions.
Creating Confidence Intervals
Filling between lines can be used to visualize confidence intervals or error ranges:
import matplotlib.pyplot as plt
import numpy as np

x = np.linspace(0, 10, 100)
y = np.sin(x)
error = 0.2 + 0.2 * np.random.rand(len(x))

plt.figure(figsize=(12, 6))
plt.plot(x, y, label='Sine Wave')
plt.fill_between(x, y - error, y + error, alpha=0.3, label='Confidence Interval')
plt.title('How to Fill Between Multiple Lines in Matplotlib - Confidence Intervals - how2matplotlib.com')
plt.legend()
plt.show()
Output:
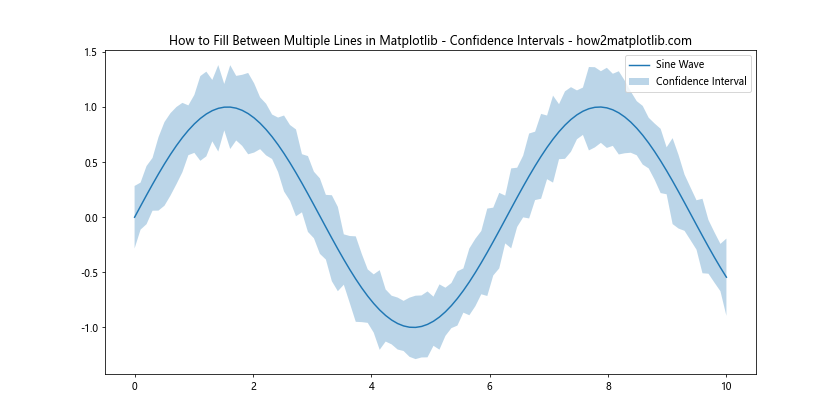
This example shows how to fill between multiple lines in Matplotlib to represent a confidence interval or error range around a central trend line.
Handling 3D Plots
While we've primarily focused on 2D plots, it's worth noting that you can also fill between multiple lines in Matplotlib when working with 3D plots. Let's explore this concept.
Filling Between 3D Curves
Here's an example of how to fill between multiple lines in Matplotlib in a 3D context:
import matplotlib.pyplot as plt
import numpy as np

fig = plt.figure(figsize=(12, 8))
ax = fig.add_subplot(111, projection='3d')

x = np.linspace(0, 10, 100)
y = np.sin(x)
z1 = np.zeros_like(x)
z2 = np.ones_like(x)

ax.plot(x, y, z1, color='r', label='Lower Curve')
ax.plot(x, y, z2, color='b', label='Upper Curve')
ax.plot_surface(x[:, np.newaxis], y[:, np.newaxis], np.vstack((z1, z2)).T, alpha=0.3)

ax.set_title('How to Fill Between Multiple Lines in Matplotlib - 3D Example - how2matplotlib.com')
ax.legend()
plt.show()
Output:
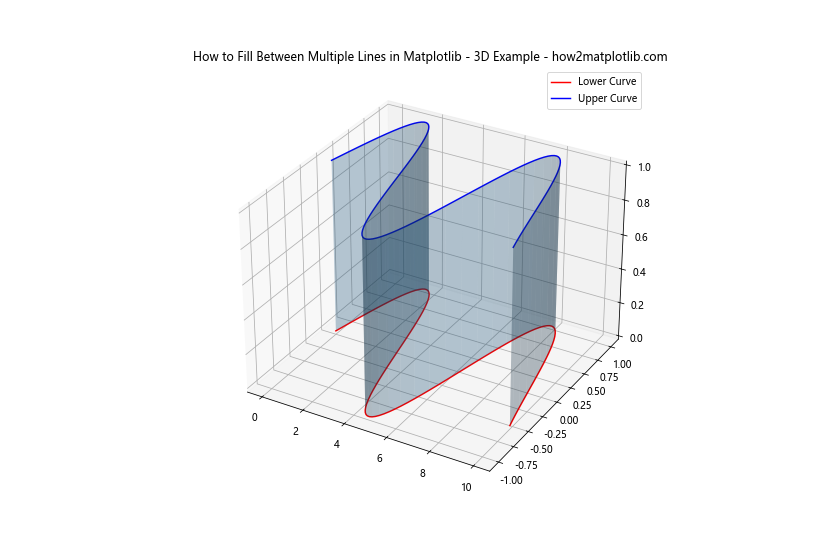
This example demonstrates how to fill between multiple lines in Matplotlib in a 3D space, creating a surface between two curves at different z-levels.
Best Practices and Tips
As we conclude our exploration of how to fill between multiple lines in Matplotlib, let's review some best practices and tips to ensure your visualizations are effective and informative.
Color Selection
When filling between multiple lines, color selection is crucial for clarity:
import matplotlib.pyplot as plt
import numpy as np

x = np.linspace(0, 10, 100)
y1 = np.sin(x)
y2 = np.cos(x)
y3 = np.tan(x)

plt.figure(figsize=(12, 6))
plt.plot(x, y1, color='blue',label='Sine')
plt.plot(x, y2, color='red', label='Cosine')
plt.plot(x, y3, color='green', label='Tangent')
plt.fill_between(x, y1, y2, where=(y1 > y2), alpha=0.3, color='lightblue', label='Sine > Cosine')
plt.fill_between(x, y1, y2, where=(y1 <= y2), alpha=0.3, color='lightcoral', label='Sine <= Cosine')
plt.fill_between(x, y2, y3, alpha=0.2, color='lightgreen', label='Between Cosine and Tangent')
plt.title('How to Fill Between Multiple Lines in Matplotlib - Color Selection - how2matplotlib.com')
plt.legend()
plt.ylim(-2, 2)
plt.show()
Output:
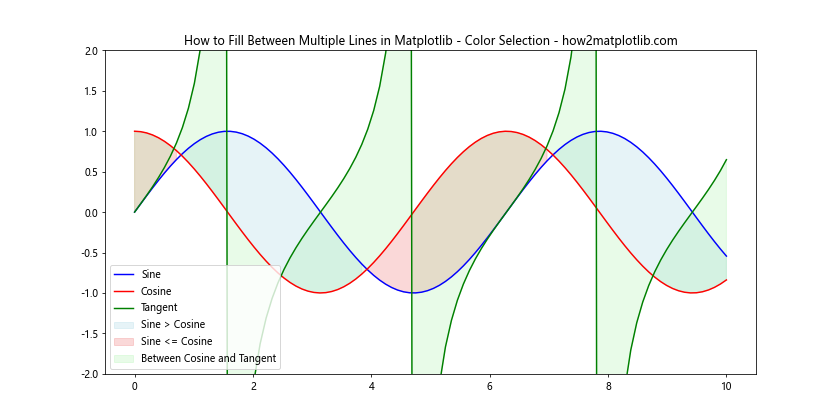
This example illustrates how to fill between multiple lines in Matplotlib using a thoughtful color selection that enhances readability and distinguishes between different areas.
Labeling and Annotations
Clear labeling and annotations are essential when filling between multiple lines:
import matplotlib.pyplot as plt
import numpy as np

x = np.linspace(0, 10, 100)
y1 = np.sin(x)
y2 = np.cos(x)

plt.figure(figsize=(12, 6))
plt.plot(x, y1, label='Sine')
plt.plot(x, y2, label='Cosine')
plt.fill_between(x, y1, y2, where=(y1 > y2), alpha=0.3, color='g', label='Sine > Cosine')
plt.fill_between(x, y1, y2, where=(y1 <= y2), alpha=0.3, color='r', label='Sine <= Cosine')
plt.title('How to Fill Between Multiple Lines in Matplotlib - Labeling Example - how2matplotlib.com')
plt.legend(loc='upper right')
plt.annotate('Intersection Point', xy=(1.57, 0), xytext=(3, 0.5),
             arrowprops=dict(facecolor='black', shrink=0.05))
plt.xlabel('X-axis')
plt.ylabel('Y-axis')
plt.show()
Output:
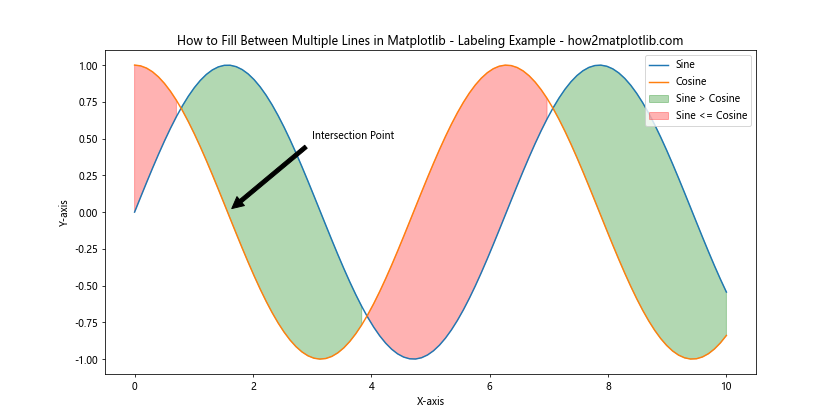
This example demonstrates how to fill between multiple lines in Matplotlib while providing clear labels, a legend, and annotations to highlight important features of the plot.
Handling Large Datasets
When dealing with large datasets, filling between multiple lines can become computationally intensive. Here are some tips for optimizing your plots:
Downsampling
For large datasets, consider downsampling before plotting:
import matplotlib.pyplot as plt
import numpy as np

x = np.linspace(0, 100, 10000)
y1 = np.sin(x) + np.random.normal(0, 0.1, x.shape)
y2 = np.cos(x) + np.random.normal(0, 0.1, x.shape)

# Downsample
step = 100
x_downsampled = x[::step]
y1_downsampled = y1[::step]
y2_downsampled = y2[::step]

plt.figure(figsize=(12, 6))
plt.plot(x_downsampled, y1_downsampled, label='Sine (downsampled)')
plt.plot(x_downsampled, y2_downsampled, label='Cosine (downsampled)')
plt.fill_between(x_downsampled, y1_downsampled, y2_downsampled, alpha=0.3)
plt.title('How to Fill Between Multiple Lines in Matplotlib - Downsampling - how2matplotlib.com')
plt.legend()
plt.show()
Output:
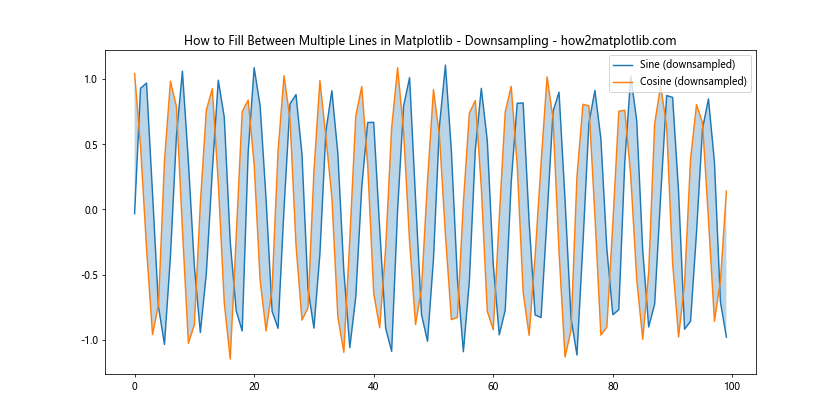
This example shows how to fill between multiple lines in Matplotlib when working with large datasets by downsampling the data before plotting.
Using rasterized=True
For vector-based outputs, consider using rasterized=True to reduce file size:
import matplotlib.pyplot as plt
import numpy as np

x = np.linspace(0, 10, 1000)
y1 = np.sin(x) + np.random.normal(0, 0.1, x.shape)
y2 = np.cos(x) + np.random.normal(0, 0.1, x.shape)

plt.figure(figsize=(12, 6))
plt.plot(x, y1, label='Sine')
plt.plot(x, y2, label='Cosine')
plt.fill_between(x, y1, y2, alpha=0.3, rasterized=True)
plt.title('How to Fill Between Multiple Lines in Matplotlib - Rasterized Fill - how2matplotlib.com')
plt.legend()
plt.show()
Output:
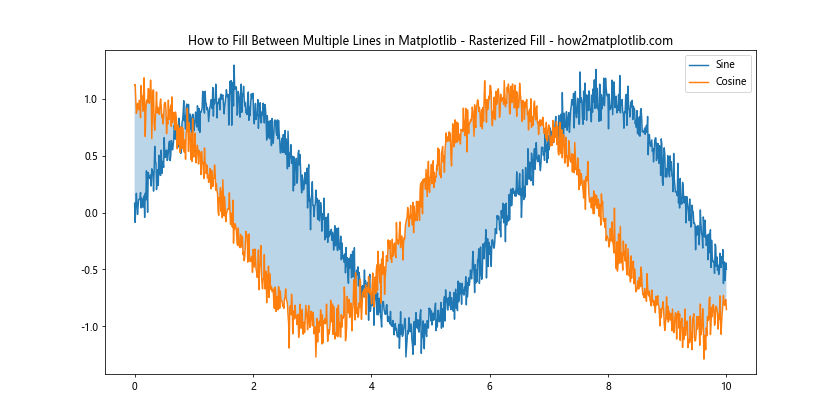
This example demonstrates how to fill between multiple lines in Matplotlib while using the rasterized=True option to optimize the output for large datasets.
Advanced Customization Techniques
As you become more proficient in how to fill between multiple lines in Matplotlib, you may want to explore more advanced customization techniques to create unique and informative visualizations.
Custom Colormaps
Creating custom colormaps can enhance the visual appeal of your filled areas:
import matplotlib.pyplot as plt
import numpy as np
from matplotlib.colors import LinearSegmentedColormap

x = np.linspace(0, 10, 100)
y1 = np.sin(x)
y2 = np.cos(x)

custom_cmap = LinearSegmentedColormap.from_list("custom", ["#FF9999", "#99CCFF"])

plt.figure(figsize=(12, 6))
plt.plot(x, y1, color='red', label='Sine')
plt.plot(x, y2, color='blue', label='Cosine')
plt.fill_between(x, y1, y2, cmap=custom_cmap, alpha=0.7)
plt.title('How to Fill Between Multiple Lines in Matplotlib - Custom Colormap - how2matplotlib.com')
plt.legend()
plt.show()
Output:
This example shows how to fill between multiple lines in Matplotlib using a custom colormap to create a smooth gradient between the filled areas.
Animated Fills
You can create animated fills to show how the area between lines changes over time:
import matplotlib.pyplot as plt
import numpy as np
from matplotlib.animation import FuncAnimation

fig, ax = plt.subplots(figsize=(12, 6))

x = np.linspace(0, 10, 100)
line1, = ax.plot([], [], 'r-', label='Sine')
line2, = ax.plot([], [], 'b-', label='Cosine')
fill = ax.fill_between([], [], [], alpha=0.3)

ax.set_xlim(0, 10)
ax.set_ylim(-1.5, 1.5)
ax.legend()

def animate(i):
    y1 = np.sin(x + i/10)
    y2 = np.cos(x + i/10)
    line1.set_data(x, y1)
    line2.set_data(x, y2)
    fill.remove()
    fill = ax.fill_between(x, y1, y2, alpha=0.3)
    ax.set_title(f'How to Fill Between Multiple Lines in Matplotlib - Animation Frame {i} - how2matplotlib.com')
    return line1, line2, fill

anim = FuncAnimation(fig, animate, frames=100, interval=50, blit=True)
plt.show()
This example demonstrates how to fill between multiple lines in Matplotlib using animation to show dynamic changes in the filled area over time.
Conclusion
In this comprehensive guide, we've explored numerous techniques and best practices for how to fill between multiple lines in Matplotlib. From basic fills to advanced customizations, we've covered a wide range of scenarios and use cases. By mastering these techniques, you'll be able to create more informative and visually appealing data visualizations.
Remember that the key to effective data visualization is not just knowing how to fill between multiple lines in Matplotlib, but also understanding when and why to use this technique. Always consider your audience and the story you're trying to tell with your data.