How to Generate Random Colors for Matplotlib Plots in Python
How to generate a random color for a Matplotlib plot in Python is an essential skill for data visualization enthusiasts and professionals alike. This comprehensive guide will explore various methods and techniques to create random colors in Matplotlib, providing you with the tools to enhance your plots and make them visually appealing. We’ll cover everything from basic color generation to advanced techniques, ensuring you have a thorough understanding of how to generate random colors for your Matplotlib plots in Python.
Understanding Color Representation in Matplotlib
Before diving into how to generate a random color for a Matplotlib plot in Python, it’s crucial to understand how colors are represented in Matplotlib. Matplotlib supports various color formats, including:
- RGB (Red, Green, Blue) tuples
- RGBA (Red, Green, Blue, Alpha) tuples
- Hexadecimal color codes
- Named colors
Let’s explore each of these formats and how they can be used to generate random colors for Matplotlib plots in Python.
RGB and RGBA Tuples
RGB tuples consist of three values ranging from 0 to 1, representing the intensity of red, green, and blue components. RGBA tuples include an additional alpha value for transparency. Here’s an example of how to use RGB and RGBA tuples in Matplotlib:
import matplotlib.pyplot as plt

# RGB tuple
plt.plot([1, 2, 3], [1, 2, 3], color=(0.5, 0.1, 0.9))

# RGBA tuple
plt.plot([1, 2, 3], [2, 3, 4], color=(0.2, 0.7, 0.3, 0.5))

plt.title("How to generate a random color for a Matplotlib plot in Python")
plt.xlabel("X-axis (how2matplotlib.com)")
plt.ylabel("Y-axis (how2matplotlib.com)")
plt.show()
Output:
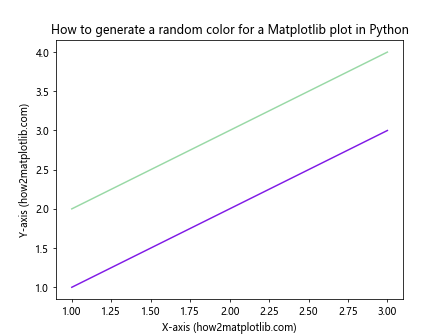
In this example, we use an RGB tuple (0.5, 0.1, 0.9) for the first plot and an RGBA tuple (0.2, 0.7, 0.3, 0.5) for the second plot. The alpha value of 0.5 in the RGBA tuple makes the second line semi-transparent.
Hexadecimal Color Codes
Hexadecimal color codes are another popular way to represent colors in Matplotlib. They consist of a ‘#’ followed by six hexadecimal digits. Here’s an example of using hexadecimal color codes:
import matplotlib.pyplot as plt

plt.plot([1, 2, 3], [1, 2, 3], color='#FF5733')
plt.plot([1, 2, 3], [2, 3, 4], color='#33FF57')

plt.title("How to generate a random color for a Matplotlib plot in Python")
plt.xlabel("X-axis (how2matplotlib.com)")
plt.ylabel("Y-axis (how2matplotlib.com)")
plt.show()
Output:
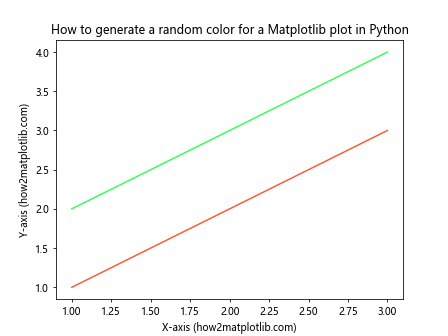
In this example, we use two different hexadecimal color codes: ‘#FF5733’ (a shade of orange) and ‘#33FF57’ (a shade of green).
Named Colors
Matplotlib also supports a wide range of named colors. These are predefined color names that can be used directly in your plots. Here’s an example:
import matplotlib.pyplot as plt

plt.plot([1, 2, 3], [1, 2, 3], color='skyblue')
plt.plot([1, 2, 3], [2, 3, 4], color='coral')

plt.title("How to generate a random color for a Matplotlib plot in Python")
plt.xlabel("X-axis (how2matplotlib.com)")
plt.ylabel("Y-axis (how2matplotlib.com)")
plt.show()
Output:
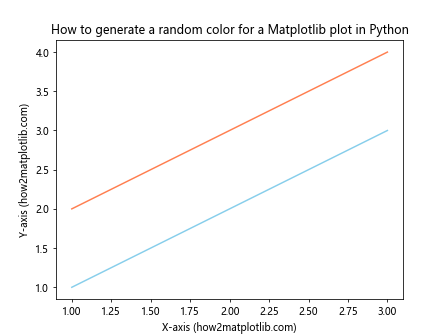
In this example, we use the named colors ‘skyblue’ and ‘coral’ for our plots.
Now that we understand how colors are represented in Matplotlib, let’s explore various methods to generate random colors for Matplotlib plots in Python.
Generating Random Colors Using the Random Module
One of the simplest ways to generate a random color for a Matplotlib plot in Python is by using the built-in random module. This module provides functions to generate random numbers, which we can use to create random RGB or RGBA tuples.
Random RGB Colors
Here’s an example of how to generate random RGB colors using the random module:
import matplotlib.pyplot as plt
import random

def random_color():
    return (random.random(), random.random(), random.random())

for _ in range(5):
    plt.plot([1, 2, 3], [random.randint(1, 5) for _ in range(3)], color=random_color())

plt.title("How to generate a random color for a Matplotlib plot in Python")
plt.xlabel("X-axis (how2matplotlib.com)")
plt.ylabel("Y-axis (how2matplotlib.com)")
plt.show()
Output:
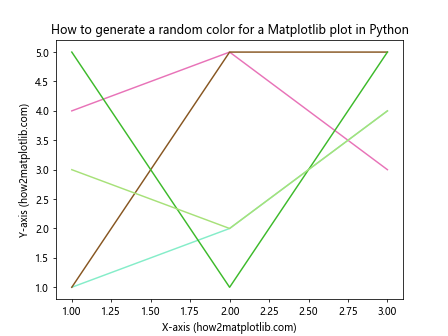
In this example, we define a random_color() function that returns a tuple of three random values between 0 and 1. We then use this function to generate random colors for five different plots.
Random RGBA Colors
To generate random RGBA colors, we can modify our random_color() function to include an alpha value:
import matplotlib.pyplot as plt
import random

def random_color_with_alpha():
    return (random.random(), random.random(), random.random(), random.uniform(0.5, 1))

for _ in range(5):
    plt.plot([1, 2, 3], [random.randint(1, 5) for _ in range(3)], color=random_color_with_alpha())

plt.title("How to generate a random color for a Matplotlib plot in Python")
plt.xlabel("X-axis (how2matplotlib.com)")
plt.ylabel("Y-axis (how2matplotlib.com)")
plt.show()
Output:
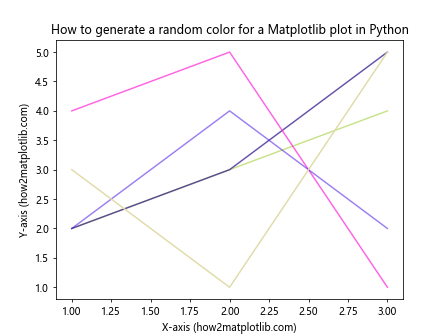
In this example, we use random.uniform(0.5, 1) to generate a random alpha value between 0.5 and 1, ensuring that our colors are not too transparent.
Generating Random Hexadecimal Colors
Another approach to generate a random color for a Matplotlib plot in Python is by creating random hexadecimal color codes. Here’s an example of how to do this:
import matplotlib.pyplot as plt
import random

def random_hex_color():
    return '#{:06x}'.format(random.randint(0, 0xFFFFFF))

for _ in range(5):
    plt.plot([1, 2, 3], [random.randint(1, 5) for _ in range(3)], color=random_hex_color())

plt.title("How to generate a random color for a Matplotlib plot in Python")
plt.xlabel("X-axis (how2matplotlib.com)")
plt.ylabel("Y-axis (how2matplotlib.com)")
plt.show()
Output:
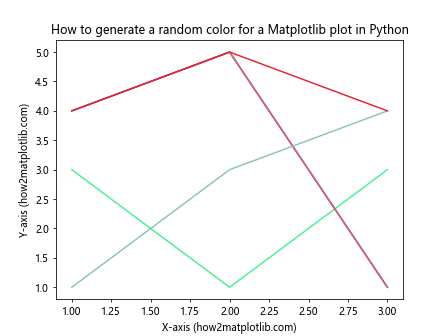
In this example, we define a random_hex_color() function that generates a random 6-digit hexadecimal color code. We use random.randint(0, 0xFFFFFF) to generate a random integer between 0 and 16,777,215 (which is the maximum value for a 24-bit color), and then format it as a 6-digit hexadecimal string.
Using NumPy for Random Color Generation
NumPy, a powerful numerical computing library for Python, can also be used to generate random colors for Matplotlib plots. NumPy’s random number generation functions are often faster than the built-in random module, making it a good choice for generating large numbers of random colors.
Here’s an example of how to generate random colors using NumPy:
import matplotlib.pyplot as plt
import numpy as np

def random_color_numpy():
    return np.random.rand(3,)

for _ in range(5):
    plt.plot([1, 2, 3], np.random.randint(1, 6, 3), color=random_color_numpy())

plt.title("How to generate a random color for a Matplotlib plot in Python")
plt.xlabel("X-axis (how2matplotlib.com)")
plt.ylabel("Y-axis (how2matplotlib.com)")
plt.show()
Output:
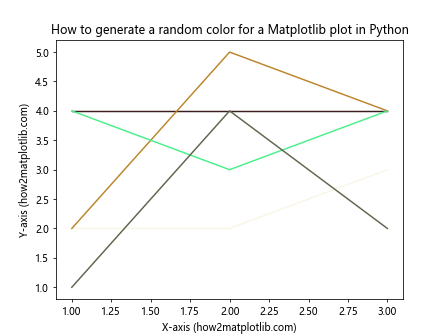
In this example, we use np.random.rand(3,) to generate an array of three random values between 0 and 1, which we use as our RGB color.
Generating Random Colors from a Specific Color Range
Sometimes, you might want to generate random colors within a specific range or palette. This can be useful for creating visually cohesive plots or adhering to a particular color scheme. Here’s an example of how to generate random colors within a specific hue range:
import matplotlib.pyplot as plt
import colorsys
import random

def random_color_in_range(hue_range=(0, 1)):
    hue = random.uniform(*hue_range)
    saturation = random.uniform(0.5, 1)
    value = random.uniform(0.5, 1)
    return colorsys.hsv_to_rgb(hue, saturation, value)

for _ in range(5):
    plt.plot([1, 2, 3], [random.randint(1, 5) for _ in range(3)], color=random_color_in_range((0.5, 0.7)))

plt.title("How to generate a random color for a Matplotlib plot in Python")
plt.xlabel("X-axis (how2matplotlib.com)")
plt.ylabel("Y-axis (how2matplotlib.com)")
plt.show()
Output:
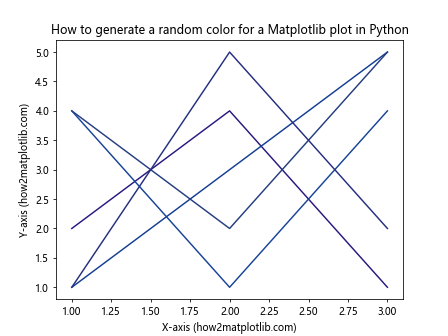
In this example, we use the colorsys module to work with colors in the HSV (Hue, Saturation, Value) color space. We generate random values for hue within a specified range, and random values for saturation and value. We then convert the HSV color to RGB using colorsys.hsv_to_rgb().
Creating a Custom Color Palette
Another approach to generate random colors for Matplotlib plots in Python is to create a custom color palette and randomly select colors from it. This method ensures that your colors are visually appealing and consistent across your plots.
Here’s an example of how to create a custom color palette and use it in your plots:
import matplotlib.pyplot as plt
import random

custom_palette = [
    '#FF6B6B', '#4ECDC4', '#45B7D1', '#FFA07A', '#98D8C8',
    '#F7DC6F', '#BB8FCE', '#82E0AA', '#F1948A', '#85C1E9'
]

for _ in range(5):
    plt.plot([1, 2, 3], [random.randint(1, 5) for _ in range(3)], color=random.choice(custom_palette))

plt.title("How to generate a random color for a Matplotlib plot in Python")
plt.xlabel("X-axis (how2matplotlib.com)")
plt.ylabel("Y-axis (how2matplotlib.com)")
plt.show()
Output:
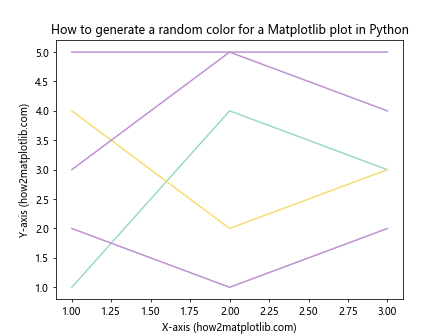
In this example, we define a list of custom colors and use random.choice() to randomly select a color from the palette for each plot.
Using Seaborn Color Palettes
Seaborn, a statistical data visualization library built on top of Matplotlib, provides a wide range of color palettes that can be used to generate random colors for Matplotlib plots. Here’s an example of how to use Seaborn color palettes:
import matplotlib.pyplot as plt
import seaborn as sns
import random

# Set the style to 'whitegrid' for better visibility
sns.set_style("whitegrid")

# Choose a Seaborn color palette
palette = sns.color_palette("husl", 10)

for _ in range(5):
    plt.plot([1, 2, 3], [random.randint(1, 5) for _ in range(3)], color=random.choice(palette))

plt.title("How to generate a random color for a Matplotlib plot in Python")
plt.xlabel("X-axis (how2matplotlib.com)")
plt.ylabel("Y-axis (how2matplotlib.com)")
plt.show()
Output:
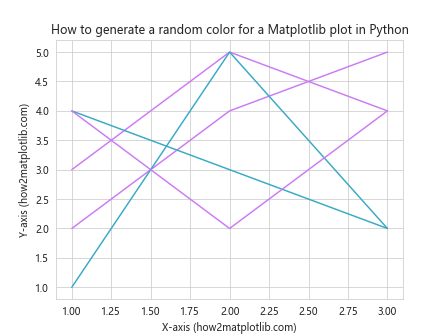
In this example, we use the “husl” color palette from Seaborn, which generates 10 evenly spaced colors. We then randomly select colors from this palette for our plots.
Generating Perceptually Distinct Colors
When working with multiple plots or data series, it’s often important to generate colors that are perceptually distinct from each other. This ensures that your plots are easily readable and that different data series can be clearly distinguished. Here’s an example of how to generate perceptually distinct colors:
import matplotlib.pyplot as plt
import colorsys

def generate_distinct_colors(n):
    hue_partition = 1.0 / (n + 1)
    return [colorsys.hsv_to_rgb(hue_partition * i, 1.0, 1.0) for i in range(n)]

distinct_colors = generate_distinct_colors(5)

for i, color in enumerate(distinct_colors):
    plt.plot([1, 2, 3], [i+1, i+2, i+3], color=color)

plt.title("How to generate a random color for a Matplotlib plot in Python")
plt.xlabel("X-axis (how2matplotlib.com)")
plt.ylabel("Y-axis (how2matplotlib.com)")
plt.show()
Output:
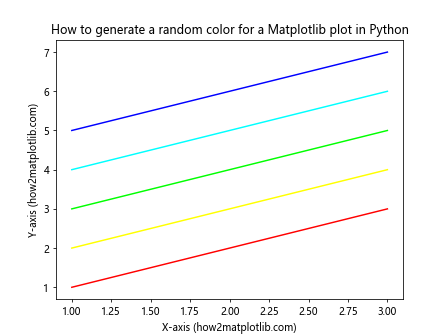
In this example, we create a function generate_distinct_colors() that generates a specified number of distinct colors by evenly spacing them around the HSV color wheel. This ensures that the colors are visually distinct from each other.
Generating Colorblind-Friendly Colors
When creating plots, it’s important to consider accessibility for colorblind viewers. Here’s an example of how to generate colorblind-friendly colors for your Matplotlib plots:
import matplotlib.pyplot as plt
import seaborn as sns

# Set the style to 'whitegrid' for better visibility
sns.set_style("whitegrid")

# Use a colorblind-friendly palette
palette = sns.color_palette("colorblind")

for i, color in enumerate(palette):
    plt.plot([1, 2, 3], [i+1, i+2, i+3], color=color)

plt.title("How to generate a random color for a Matplotlib plot in Python")
plt.xlabel("X-axis (how2matplotlib.com)")
plt.ylabel("Y-axis (how2matplotlib.com)")
plt.show()
Output:
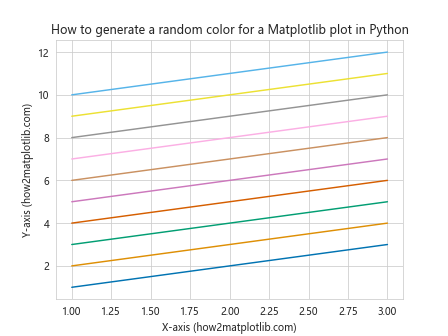
In this example, we use Seaborn’s “colorblind” palette, which is designed to be distinguishable for people with various forms of color vision deficiency.
Creating a Custom Color Generator
To have more control over how random colors are generated for Matplotlib plots in Python, you can create a custom color generator class. This approach allows you to define your own rules for color generation and maintain state between color generations if needed.
Here’s an example of a custom color generator:
import matplotlib.pyplot as plt
import random
import colorsys

class CustomColorGenerator:
    def __init__(self, saturation_range=(0.5, 1), value_range=(0.5, 1)):
        self.saturation_range = saturation_range
        self.value_range = value_range
        self.used_hues = set()

    def generate_color(self):
        while True:
            hue = random.random()
            if hue not in self.used_hues:
                self.used_hues.add(hue)
                saturation = random.uniform(*self.saturation_range)
                value = random.uniform(*self.value_range)
                return colorsys.hsv_to_rgb(hue, saturation, value)

color_generator = CustomColorGenerator()

for _ in range(5):
    plt.plot([1, 2, 3], [random.randint(1, 5) for _ in range(3)], color=color_generator.generate_color())

plt.title("How to generate a random color for a Matplotlib plot in Python")
plt.xlabel("X-axis (how2matplotlib.com)")
plt.ylabel("Y-axis (how2matplotlib.com)")
plt.show()
Output:
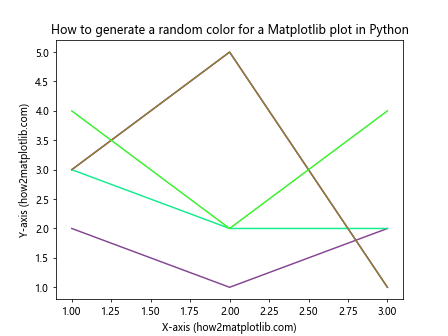
In this example, we create a CustomColorGenerator class that generates unique colors by keeping track of used hues. This ensures that each generated color is distinct from the others.
Generating Gradient Colors
Another interesting way to generate colors for Matplotlib plots is by creating a gradient of colors. This can be particularly useful when you want to represent a continuous range of values in your plot. Here’s an example of how to generate gradient colors:
import matplotlib.pyplot as plt
import numpy as np

def generate_gradient_colors(n, start_color, end_color):
    start = np.array(start_color)
    end = np.array(end_color)
    return [start + (end - start) * i / (n-1) for i in range(n)]

start_color = [1, 0, 0]  # Red
end_color = [0, 0, 1]  # Blue
gradient_colors = generate_gradient_colors(5, start_color, end_color)

for i, color in enumerate(gradient_colors):
    plt.plot([1, 2, 3], [i+1, i+2, i+3], color=color)

plt.title("How to generate a random color for a Matplotlib plot in Python")
plt.xlabel("X-axis (how2matplotlib.com)")
plt.ylabel("Y-axis (how2matplotlib.com)")
plt.show()
Output:
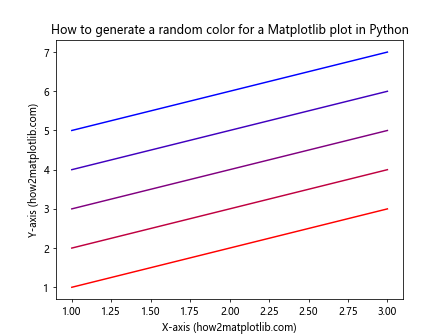
In this example, we create a function generate_gradient_colors() that generates a specified number of colors transitioning from a start color to an end color. This can be useful for creating color scales or representing data that has a natural progression.
Using Matplotlib’s Built-in Colormaps
Matplotlib provides a wide range of built-in colormaps that can be used to generate colors for your plots. These colormaps are particularly useful when you want to represent data that has a natural ordering or progression. Here’s an example of how to use Matplotlib’s colormaps to generate colors:
import matplotlib.pyplot as plt
import numpy as np

# Choose a colormap
cmap = plt.get_cmap('viridis')

# Generate 5 evenly spaced colors from the colormap
colors = [cmap(i/4) for i in range(5)]

for i, color in enumerate(colors):
    plt.plot([1, 2, 3], [i+1, i+2, i+3], color=color)

plt.title("How to generate a random color for a Matplotlib plot in Python")
plt.xlabel("X-axis (how2matplotlib.com)")
plt.ylabel("Y-axis (how2matplotlib.com)")
plt.show()
Output:
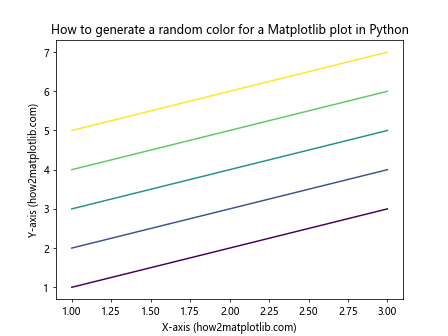
In this example, we use the ‘viridis’ colormap, which is a perceptually uniform colormap that works well for representing continuous data. We generate five evenly spaced colors from this colormap for our plots.
Generating Pastel Colors
Pastel colors can be useful for creating soft, visually appealing plots. Here’s an example of how to generate pastel colors for your Matplotlib plots:
import matplotlib.pyplot as plt
import colorsys
import random

def generate_pastel_color():
    h = random.random()
    s = random.uniform(0.2, 0.5)
    v = random.uniform(0.9, 1.0)
    return colorsys.hsv_to_rgb(h, s, v)

for _ in range(5):
    plt.plot([1, 2, 3], [random.randint(1, 5) for _ in range(3)], color=generate_pastel_color())

plt.title("How to generate a random color for a Matplotlib plot in Python")
plt.xlabel("X-axis (how2matplotlib.com)")
plt.ylabel("Y-axis (how2matplotlib.com)")
plt.show()
Output:
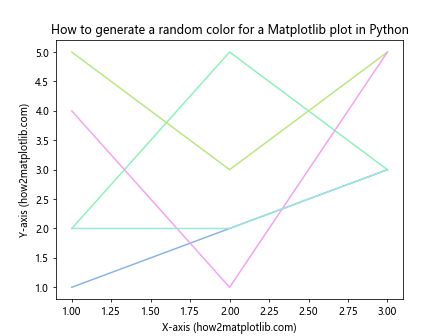
In this example, we create a generate_pastel_color() function that generates pastel colors by using high values for brightness (v) and low to medium values for saturation (s) in the HSV color space.
Creating a Color Cycle
When plotting multiple data series, it can be useful to create a color cycle that repeats a set of colors. This ensures consistency across your plots and can make your visualizations more coherent. Here’s an example of how to create and use a color cycle in Matplotlib:
import matplotlib.pyplot as plt
import itertools

# Define a list of colors for the cycle
colors = ['#FF6B6B', '#4ECDC4', '#45B7D1', '#FFA07A', '#98D8C8']

# Create a color cycle
color_cycle = itertools.cycle(colors)

for _ in range(7):  # Plot 7 lines to show the cycle repeating
    plt.plot([1, 2, 3], [random.randint(1, 5) for _ in range(3)], color=next(color_cycle))

plt.title("How to generate a random color for a Matplotlib plot in Python")
plt.xlabel("X-axis (how2matplotlib.com)")
plt.ylabel("Y-axis (how2matplotlib.com)")
plt.show()
In this example, we define a list of colors and use itertools.cycle() to create a color cycle. We then use next(color_cycle) to get the next color in the cycle for each plot.
Generating Colors Based on Data Values
Sometimes, you might want to generate colors based on the actual data values in your plot. This can be particularly useful for scatter plots or line plots where you want the color to represent an additional dimension of your data. Here’s an example of how to do this:
import matplotlib.pyplot as plt
import numpy as np

# Generate some sample data
x = np.linspace(0, 10, 100)
y = np.sin(x)
z = np.cos(x)

# Create a scatter plot with colors based on z values
plt.scatter(x, y, c=z, cmap='viridis')

plt.colorbar(label='cos(x) (how2matplotlib.com)')
plt.title("How to generate a random color for a Matplotlib plot in Python")
plt.xlabel("X-axis (how2matplotlib.com)")
plt.ylabel("Y-axis (how2matplotlib.com)")
plt.show()
Output:
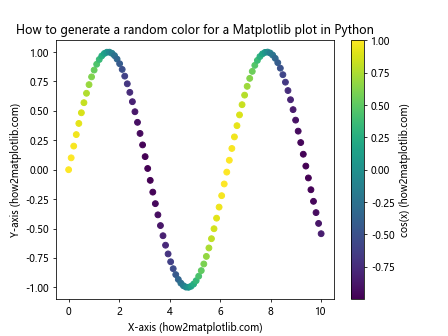
In this example, we create a scatter plot where the color of each point is determined by its corresponding z value. We use the ‘viridis’ colormap to map the z values to colors.
Conclusion
Learning how to generate a random color for a Matplotlib plot in Python is a valuable skill that can significantly enhance your data visualizations. Throughout this comprehensive guide, we’ve explored various methods and techniques for generating random colors, from simple RGB tuples to more advanced approaches using custom color generators and Matplotlib’s built-in features.
We’ve covered:
- Understanding color representation in Matplotlib
- Using the random module for basic color generation
- Generating random hexadecimal colors
- Utilizing NumPy for efficient random color generation
- Creating colors within specific ranges or palettes
- Developing custom color palettes
- Leveraging Seaborn’s color palettes
- Generating perceptually distinct and colorblind-friendly colors
- Creating custom color generators
- Producing gradient colors
- Using Matplotlib’s built-in colormaps
- Generating pastel colors
- Creating color cycles for consistent plotting
- Generating colors based on data values
By mastering these techniques, you’ll be well-equipped to create visually appealing and informative plots that effectively communicate your data. Remember that the choice of colors can significantly impact the readability and interpretation of your visualizations, so always consider your audience and the nature of your data when selecting a color generation method.