How To Highlight a Time Range in Time Series Plot in Python with Matplotlib
How to highlight a time range in time series plot in Python with Matplotlib is an essential skill for data visualization enthusiasts and professionals alike. This article will provide a detailed exploration of various techniques and methods to effectively highlight specific time ranges in time series plots using Matplotlib, one of the most popular plotting libraries in Python. We’ll cover everything from basic concepts to advanced techniques, ensuring you have a thorough understanding of how to highlight time ranges in your time series plots.
Understanding Time Series Plots and the Need for Highlighting
Before diving into the specifics of how to highlight a time range in time series plot in Python with Matplotlib, it’s crucial to understand what time series plots are and why highlighting certain ranges can be beneficial. Time series plots are graphical representations of data points collected at regular intervals over a period. They are widely used in various fields, including finance, economics, and scientific research, to visualize trends, patterns, and anomalies in data over time.
Highlighting specific time ranges in these plots can serve several purposes:
- Emphasizing important events or periods
- Drawing attention to anomalies or outliers
- Comparing different time periods
- Visualizing the impact of certain factors on the data
Now that we understand the importance of highlighting time ranges, let’s explore how to achieve this using Matplotlib in Python.
Setting Up the Environment
Before we begin with the actual plotting, it’s essential to set up our Python environment with the necessary libraries. For this tutorial, we’ll be using Matplotlib along with NumPy for data manipulation and datetime for handling time-based data.
Here’s a simple example of how to import these libraries:
import matplotlib.pyplot as plt
import numpy as np
from datetime import datetime, timedelta

print("Libraries imported successfully for how2matplotlib.com")
This code snippet imports the required libraries and prints a confirmation message. Make sure you have these libraries installed in your Python environment before proceeding.
Creating a Basic Time Series Plot
Let’s start by creating a basic time series plot using Matplotlib. This will serve as the foundation for our highlighting techniques.
import matplotlib.pyplot as plt
import numpy as np
from datetime import datetime, timedelta

# Generate sample data
dates = [datetime(2023, 1, 1) + timedelta(days=i) for i in range(365)]
values = np.random.randn(365).cumsum()

# Create the plot
plt.figure(figsize=(12, 6))
plt.plot(dates, values)
plt.title("Basic Time Series Plot - how2matplotlib.com")
plt.xlabel("Date")
plt.ylabel("Value")
plt.grid(True)
plt.show()
Output:
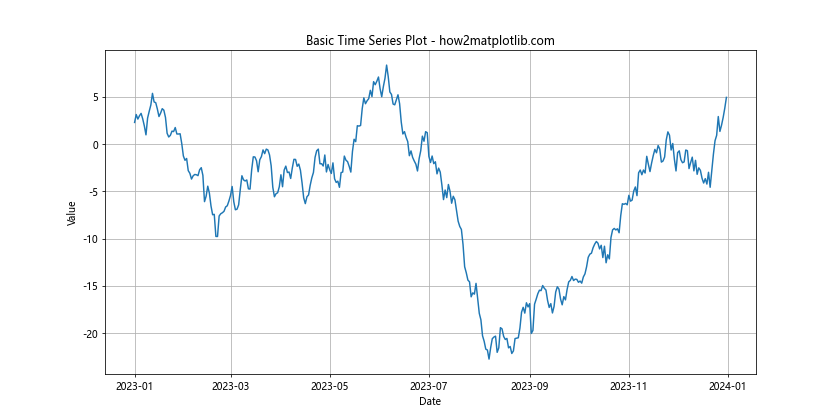
In this example, we generate a year’s worth of random data and plot it as a time series. This basic plot will be our starting point for learning how to highlight time ranges.
Highlighting a Time Range Using axvspan
One of the most common methods to highlight a time range in a time series plot is by using the axvspan function from Matplotlib. This function allows you to create a vertical span across the plot, effectively highlighting a specific time range.
Here’s an example of how to use axvspan:
import matplotlib.pyplot as plt
import numpy as np
from datetime import datetime, timedelta

# Generate sample data
dates = [datetime(2023, 1, 1) + timedelta(days=i) for i in range(365)]
values = np.random.randn(365).cumsum()

# Define the time range to highlight
highlight_start = datetime(2023, 3, 1)
highlight_end = datetime(2023, 5, 31)

# Create the plot
plt.figure(figsize=(12, 6))
plt.plot(dates, values)

# Highlight the specified time range
plt.axvspan(highlight_start, highlight_end, color='yellow', alpha=0.3)

plt.title("Time Series Plot with Highlighted Range - how2matplotlib.com")
plt.xlabel("Date")
plt.ylabel("Value")
plt.grid(True)
plt.show()
Output:
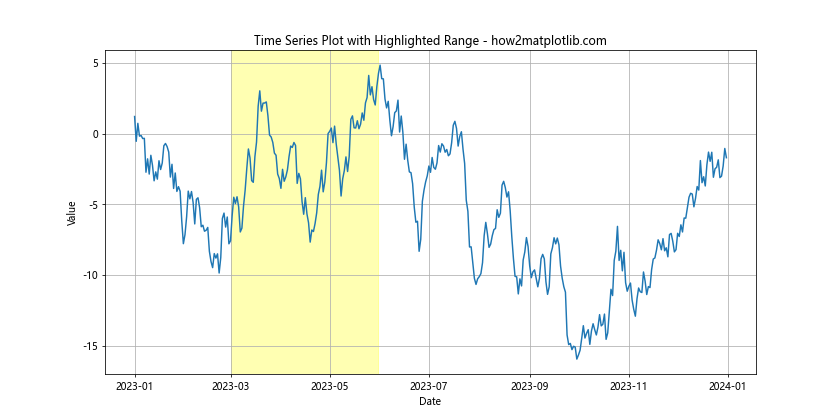
In this example, we highlight the period from March 1, 2023, to May 31, 2023, using a yellow semi-transparent overlay. The alpha parameter controls the transparency of the highlight.
Using fill_between for More Complex Highlighting
While axvspan is great for simple highlighting, sometimes you might need more control over the highlighted area. In such cases, the fill_between function can be incredibly useful. This function allows you to highlight areas based on specific conditions or values.
Here’s an example of how to use fill_between:
import matplotlib.pyplot as plt
import numpy as np
from datetime import datetime, timedelta

# Generate sample data
dates = [datetime(2023, 1, 1) + timedelta(days=i) for i in range(365)]
values = np.random.randn(365).cumsum()

# Define the time range to highlight
highlight_start = datetime(2023, 3, 1)
highlight_end = datetime(2023, 5, 31)

# Create the plot
plt.figure(figsize=(12, 6))
plt.plot(dates, values)

# Highlight the specified time range
plt.fill_between(dates, min(values), max(values),
                 where=[(d >= highlight_start) and (d <= highlight_end) for d in dates],
                 color='green', alpha=0.3)

plt.title("Time Series Plot with Complex Highlighting - how2matplotlib.com")
plt.xlabel("Date")
plt.ylabel("Value")
plt.grid(True)
plt.show()
Output:
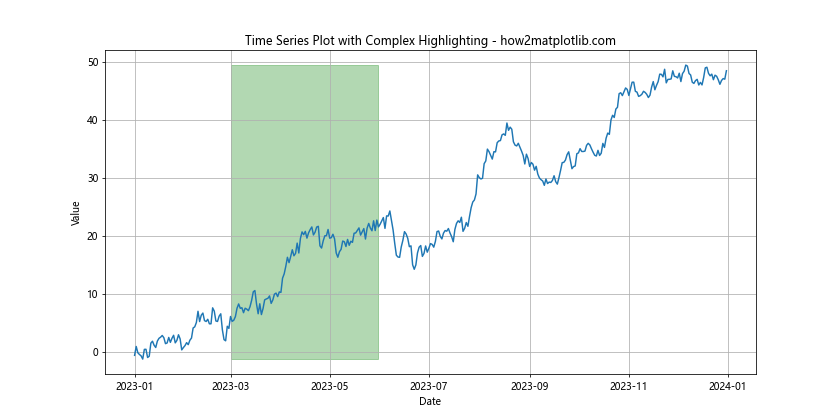
In this example, we use fill_between to highlight the same period as before, but with more control over the highlighted area. The where parameter allows us to specify exactly which points should be included in the highlight.
Highlighting Multiple Time Ranges
Often, you might need to highlight multiple time ranges in a single plot. This can be achieved by using multiple axvspan or fill_between calls. Here's an example:
import matplotlib.pyplot as plt
import numpy as np
from datetime import datetime, timedelta

# Generate sample data
dates = [datetime(2023, 1, 1) + timedelta(days=i) for i in range(365)]
values = np.random.randn(365).cumsum()

# Define multiple time ranges to highlight
highlight_ranges = [
    (datetime(2023, 2, 1), datetime(2023, 3, 31), 'yellow'),
    (datetime(2023, 6, 1), datetime(2023, 7, 31), 'green'),
    (datetime(2023, 10, 1), datetime(2023, 11, 30), 'red')
]

# Create the plot
plt.figure(figsize=(12, 6))
plt.plot(dates, values)

# Highlight the specified time ranges
for start, end, color in highlight_ranges:
    plt.axvspan(start, end, color=color, alpha=0.3)

plt.title("Time Series Plot with Multiple Highlighted Ranges - how2matplotlib.com")
plt.xlabel("Date")
plt.ylabel("Value")
plt.grid(True)
plt.show()
Output:
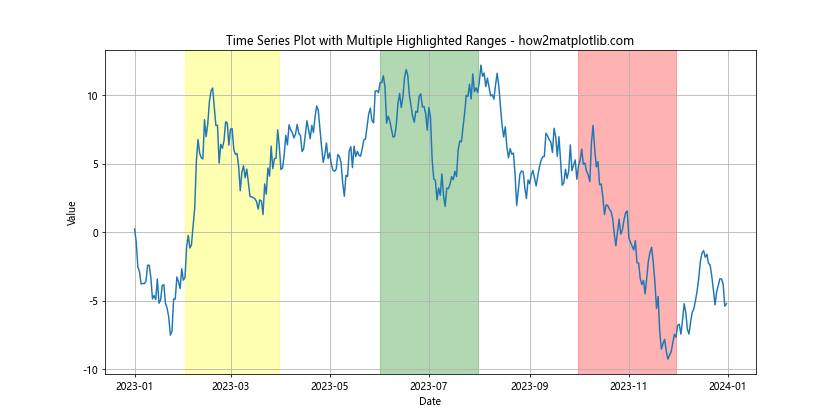
This example demonstrates how to highlight multiple time ranges with different colors, providing a clear visual distinction between different periods of interest.
Adding Labels to Highlighted Ranges
To make your highlighted time ranges more informative, you can add labels to them. This can be achieved by combining the highlighting techniques with Matplotlib's text annotation features.
Here's an example of how to add labels to highlighted ranges:
import matplotlib.pyplot as plt
import numpy as np
from datetime import datetime, timedelta

# Generate sample data
dates = [datetime(2023, 1, 1) + timedelta(days=i) for i in range(365)]
values = np.random.randn(365).cumsum()

# Define time ranges to highlight with labels
highlight_ranges = [
    (datetime(2023, 2, 1), datetime(2023, 3, 31), 'yellow', 'Q1 Peak'),
    (datetime(2023, 6, 1), datetime(2023, 7, 31), 'green', 'Summer Slump'),
    (datetime(2023, 10, 1), datetime(2023, 11, 30), 'red', 'Year-End Rally')
]

# Create the plot
plt.figure(figsize=(12, 6))
plt.plot(dates, values)

# Highlight the specified time ranges and add labels
for start, end, color, label in highlight_ranges:
    plt.axvspan(start, end, color=color, alpha=0.3)
    plt.text(start + (end - start)/2, plt.ylim()[1], label,
             ha='center', va='top', fontweight='bold')

plt.title("Time Series Plot with Labeled Highlighted Ranges - how2matplotlib.com")
plt.xlabel("Date")
plt.ylabel("Value")
plt.grid(True)
plt.show()
Output:
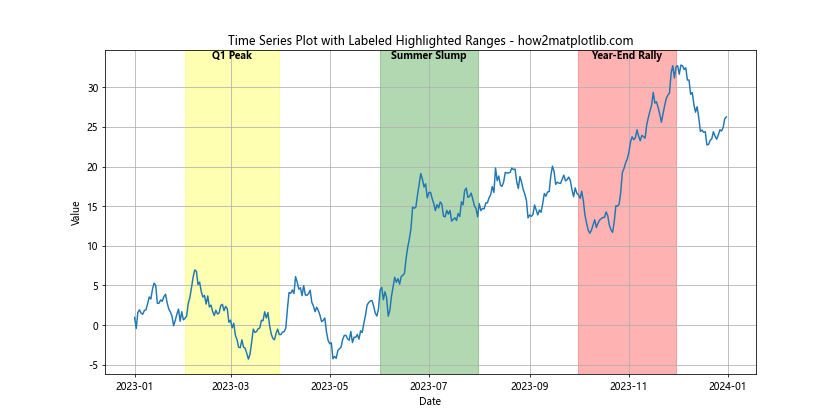
In this example, we add descriptive labels to each highlighted range, positioning them at the top of the plot for easy visibility.
Customizing Highlight Styles
Matplotlib offers a wide range of customization options for your highlights. You can adjust colors, transparency, line styles, and more to create visually appealing and informative plots.
Here's an example showcasing various customization options:
import matplotlib.pyplot as plt
import numpy as np
from datetime import datetime, timedelta

# Generate sample data
dates = [datetime(2023, 1, 1) + timedelta(days=i) for i in range(365)]
values = np.random.randn(365).cumsum()

# Define time ranges with custom styles
highlight_ranges = [
    (datetime(2023, 2, 1), datetime(2023, 3, 31), {'color': 'yellow', 'alpha': 0.2, 'hatch': '//'}),
    (datetime(2023, 6, 1), datetime(2023, 7, 31), {'color': 'green', 'alpha': 0.3, 'hatch': 'xx'}),
    (datetime(2023, 10, 1), datetime(2023, 11, 30), {'color': 'red', 'alpha': 0.1, 'hatch': '**'})
]

# Create the plot
plt.figure(figsize=(12, 6))
plt.plot(dates, values)

# Highlight the specified time ranges with custom styles
for start, end, style in highlight_ranges:
    plt.axvspan(start, end, **style)

plt.title("Time Series Plot with Custom Highlight Styles - how2matplotlib.com")
plt.xlabel("Date")
plt.ylabel("Value")
plt.grid(True)
plt.show()
Output:
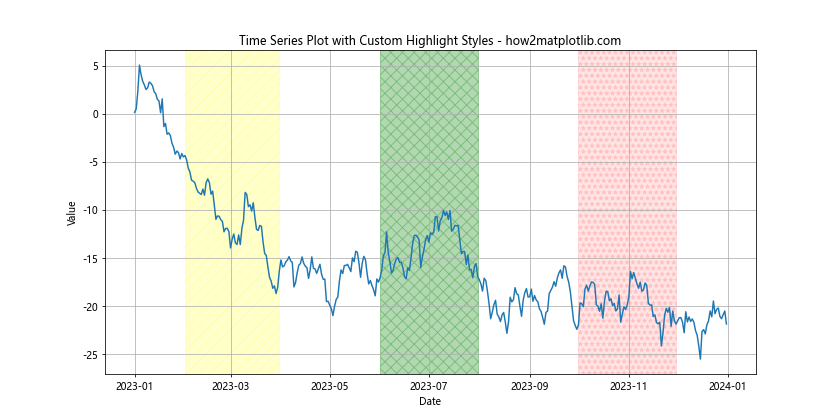
This example demonstrates how to use different colors, transparencies, and hatch patterns to create distinct and visually interesting highlighted ranges.
Highlighting Based on Data Values
Sometimes, you might want to highlight time ranges based on specific data values rather than predefined date ranges. Matplotlib allows you to do this using conditional highlighting.
Here's an example of how to highlight periods where the data exceeds a certain threshold:
import matplotlib.pyplot as plt
import numpy as np
from datetime import datetime, timedelta

# Generate sample data
dates = [datetime(2023, 1, 1) + timedelta(days=i) for i in range(365)]
values = np.random.randn(365).cumsum()

# Define threshold
threshold = 5

# Create the plot
plt.figure(figsize=(12, 6))
plt.plot(dates, values)

# Highlight periods where values exceed the threshold
plt.fill_between(dates, min(values), max(values),
                 where=[v > threshold for v in values],
                 color='red', alpha=0.3)

plt.axhline(y=threshold, color='r', linestyle='--', label='Threshold')

plt.title("Time Series Plot with Value-Based Highlighting - how2matplotlib.com")
plt.xlabel("Date")
plt.ylabel("Value")
plt.legend()
plt.grid(True)
plt.show()
Output:
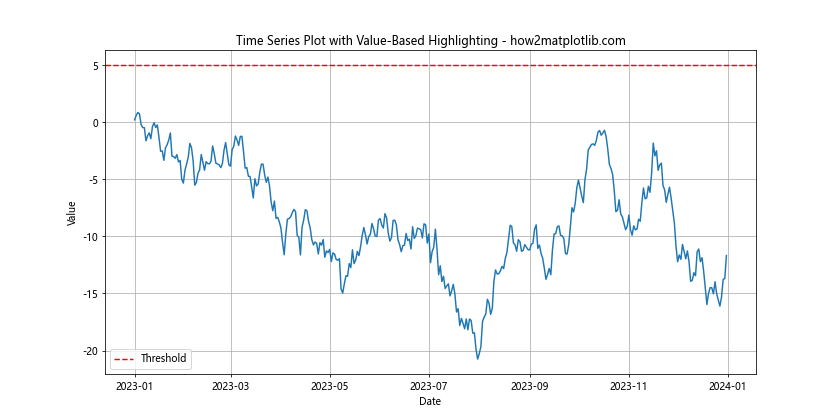
In this example, we highlight all periods where the data values exceed a threshold of 5, providing a visual indication of high-value periods in the time series.
Combining Multiple Highlighting Techniques
For more complex visualizations, you might need to combine multiple highlighting techniques. This can be particularly useful when you want to emphasize different aspects of your data simultaneously.
Here's an example that combines predefined date ranges and value-based highlighting:
import matplotlib.pyplot as plt
import numpy as np
from datetime import datetime, timedelta

# Generate sample data
dates = [datetime(2023, 1, 1) + timedelta(days=i) for i in range(365)]
values = np.random.randn(365).cumsum()

# Define time range to highlight
highlight_start = datetime(2023, 3, 1)
highlight_end = datetime(2023, 5, 31)

# Define threshold
threshold = 5

# Create the plot
plt.figure(figsize=(12, 6))
plt.plot(dates, values)

# Highlight the specified time range
plt.axvspan(highlight_start, highlight_end, color='yellow', alpha=0.3, label='Q2')

# Highlight periods where values exceed the threshold
plt.fill_between(dates, min(values), max(values),
                 where=[v > threshold for v in values],
                 color='red', alpha=0.3, label='Above Threshold')

plt.axhline(y=threshold, color='r', linestyle='--', label='Threshold')

plt.title("Time Series Plot with Combined Highlighting Techniques - how2matplotlib.com")
plt.xlabel("Date")
plt.ylabel("Value")
plt.legend()
plt.grid(True)
plt.show()
Output:
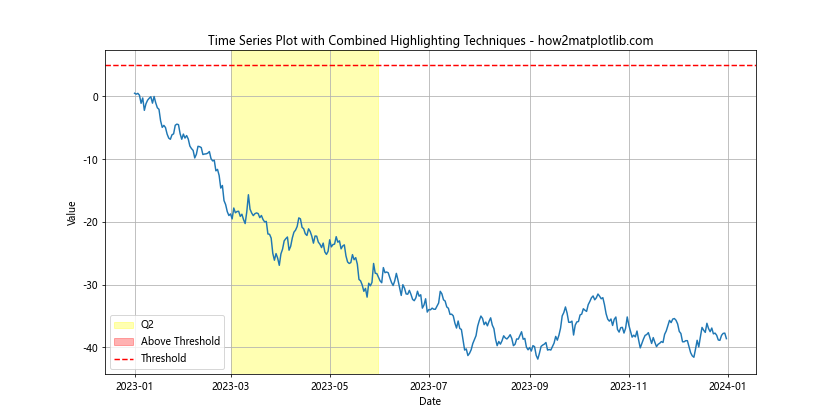
This example showcases how to highlight a specific time range (Q2) while also highlighting periods where the data exceeds a certain threshold, providing a rich, multi-layered visualization of the time series data.
Interactive Highlighting with Matplotlib Widgets
While static highlighting is useful, interactive highlighting can provide even more insights. Matplotlib offers widgets that allow users to dynamically select and highlight time ranges.
Here's an example using the RectangleSelector widget:
import matplotlib.pyplot as plt
from matplotlib.widgets import RectangleSelector
import numpy as np
from datetime import datetime, timedelta

# Generate sample data
dates = [datetime(2023, 1, 1) + timedelta(days=i) for i in range(365)]
values = np.random.randn(365).cumsum()

# Create the plot
fig, ax = plt.subplots(figsize=(12, 6))
line, = ax.plot(dates, values)

# Function to handle selection
def onselect(eclick, erelease):
    x1, x2 = eclick.xdata, erelease.xdata
    ax.axvspan(x1, x2, color='yellow', alpha=0.3)
    fig.canvas.draw()

# Create the RectangleSelector
rs = RectangleSelector(ax, onselect, useblit=True,
                       button=[1], minspanx=5, minspany=5,
                       spancoords='pixels', interactive=True)

plt.title("Interactive Time Range Highlighting - how2matplotlib.com")
plt.xlabel("Date")
plt.ylabel("Value")
plt.grid(True)
plt.show()
Output:
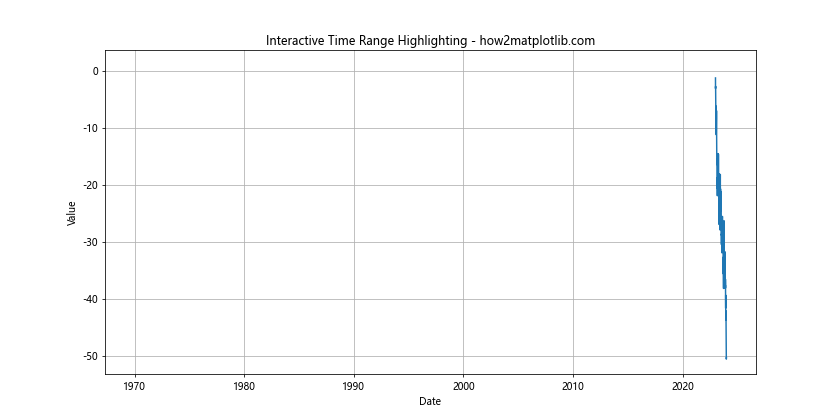
This example allows users to click and drag on the plot to highlight specific time ranges interactively. The highlighted areas persist, allowing for multiple selections.
Highlighting Weekends or Specific Days
In some time series analyses, it can be useful to highlight specific days of the week, such as weekends. Matplotlib can be used to achieve this effect as well.
Here's an example of how to highlight weekends in a time series plot:
import matplotlib.pyplot as plt
import numpy as np
from datetime import datetime, timedelta

# Generate sample data
dates = [datetime(2023, 1, 1) + timedelta(days=i) for i in range(365)]
values = np.random.randn(365).cumsum()

# Create the plot
plt.figure(figsize=(12, 6))
plt.plot(dates, values)

# Highlight weekends
for d in dates:
    if d.weekday() >= 5:  # 5 = Saturday, 6 = Sunday
        plt.axvspan(d, d + timedelta(days=1), facecolor='gray', alpha=0.2)

plt.title("Time Series Plot with Weekends Highlighted - how2matplotlib.com")
plt.xlabel("Date")
plt.ylabel("Value")
plt.grid(True)
plt.show()
Output:
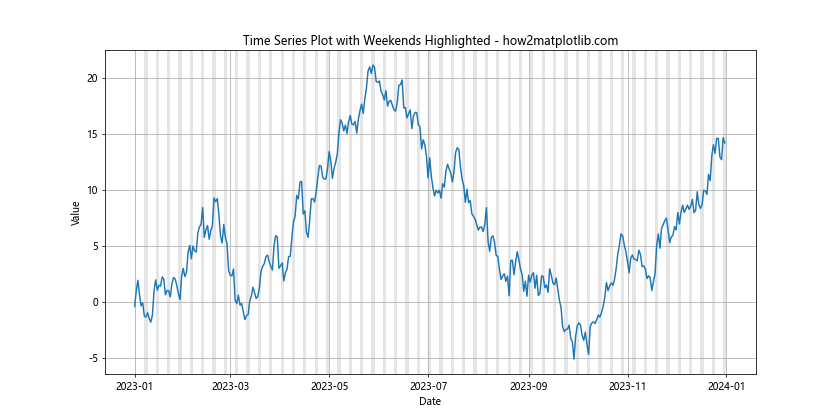
This example highlights all weekends in the time series, making it easy to identify patterns that might be related to weekday vs. weekend behavior.
Highlighting Periodic Patterns
In some time series data, you might want to highlight periodic patterns, such as seasonal effects. Matplotlib can be used to create these types of visualizations as well.
Here's an example of how to highlight quarterly patterns in a time series:
import matplotlib.pyplot as plt
import numpy as np
from datetime import datetime, timedelta

# Generate sample data
dates = [datetime(2023, 1, 1) + timedelta(days=i) for i in range(365)]
values = np.random.randn(365).cumsum()

# Create the plot
plt.figure(figsize=(12, 6))
plt.plot(dates, values)

# Highlight quarters
colors = ['#FF000040', '#00FF0040', '#0000FF40', '#FFFF0040']
for i, d in enumerate(dates):
    quarter = (d.month - 1) // 3
    plt.axvspan(d, d + timedelta(days=1), facecolor=colors[quarter], alpha=0.2)

plt.title("Time Series Plot with Quarterly Highlighting - how2matplotlib.com")
plt.xlabel("Date")
plt.ylabel("Value")
plt.grid(True)
plt.show()
Output:
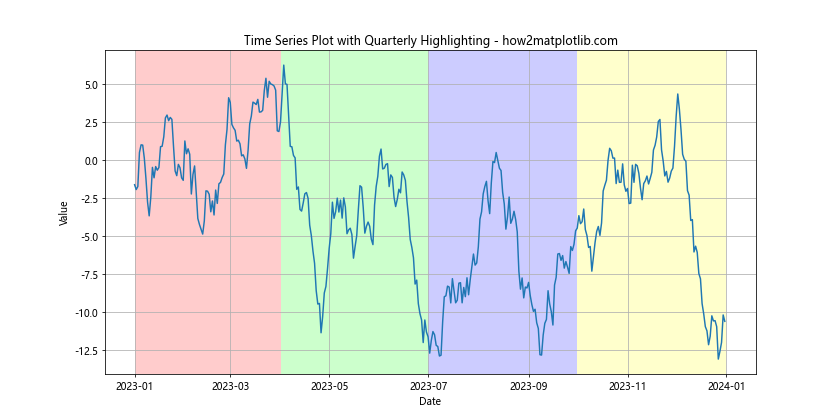
This example uses different colors to highlight each quarter of the year, making it easy to identify seasonal patterns in the data.
Highlighting Based on External Events
Sometimes, you might want to highlight time ranges based on external events or data. This can be achieved by combining Matplotlib's highlighting capabilities with external data sources.
Here's an example of how to highlight time ranges based on a list of events:
import matplotlib.pyplot as plt
import numpy as np
from datetime import datetime, timedelta

# Generate sample data
dates = [datetime(2023, 1, 1) + timedelta(days=i) for i in range(365)]
values = np.random.randn(365).cumsum()

# Define events
events = [
    ("Product Launch", datetime(2023, 3, 15), datetime(2023, 3, 20)),
    ("Marketing Campaign", datetime(2023, 6, 1), datetime(2023, 6, 30)),
    ("Holiday Season", datetime(2023, 12, 1), datetime(2023, 12, 31))
]

# Create the plot
plt.figure(figsize=(12, 6))
plt.plot(dates, values)

# Highlight events
colors = plt.cm.Set3(np.linspace(0, 1, len(events)))
for (name, start, end), color in zip(events, colors):
    plt.axvspan(start, end, color=color, alpha=0.3, label=name)

plt.title("Time Series Plot with Event-Based Highlighting - how2matplotlib.com")
plt.xlabel("Date")
plt.ylabel("Value")
plt.legend()
plt.grid(True)
plt.show()
Output:
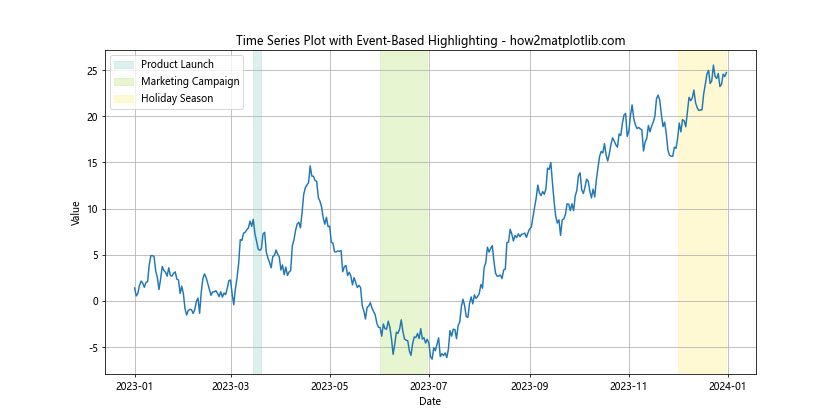
This example highlights different time ranges based on a list of predefined events, each with its own color and label.
Combining Highlighting with Annotations
To provide even more context to your highlighted time ranges, you can combine highlighting techniques with annotations. This allows you to add detailed information directly to your plot.
Here's an example of how to add annotations to highlighted ranges:
import matplotlib.pyplot as plt
import numpy as np
from datetime import datetime, timedelta

# Generate sample data
dates = [datetime(2023, 1, 1) + timedelta(days=i) for i in range(365)]
values = np.random.randn(365).cumsum()

# Define events with annotations
events = [
    ("Product Launch", datetime(2023, 3, 15), datetime(2023, 3, 20), "New product release"),
    ("Marketing Campaign", datetime(2023, 6, 1), datetime(2023, 6, 30), "Summer sale"),
    ("Holiday Season", datetime(2023, 12, 1), datetime(2023, 12, 31), "Christmas promotions")
]

# Create the plot
fig, ax = plt.subplots(figsize=(12, 6))
ax.plot(dates, values)

# Highlight events and add annotations
colors = plt.cm.Set3(np.linspace(0, 1, len(events)))
for (name, start, end, annotation), color in zip(events, colors):
    ax.axvspan(start, end, color=color, alpha=0.3, label=name)
    ax.annotate(annotation, xy=(start, ax.get_ylim()[1]), xytext=(0, 10),
                textcoords='offset points', ha='left', va='bottom',
                bbox=dict(boxstyle='round,pad=0.5', fc='yellow', alpha=0.5),
                arrowprops=dict(arrowstyle = '->', connectionstyle='arc3,rad=0'))

plt.title("Time Series Plot with Highlighted Events and Annotations - how2matplotlib.com")
plt.xlabel("Date")
plt.ylabel("Value")
plt.legend()
plt.grid(True)
plt.show()
Output:
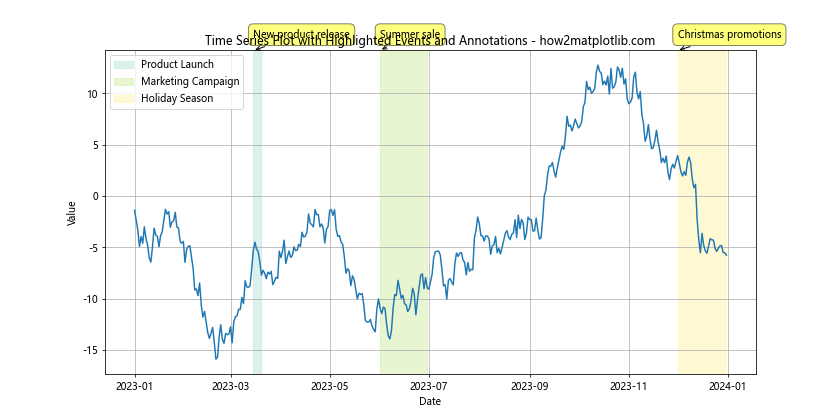
This example not only highlights specific time ranges but also adds detailed annotations to provide additional context for each highlighted event.
Conclusion
Learning how to highlight a time range in time series plot in Python with Matplotlib is a valuable skill that can significantly enhance your data visualization capabilities. Throughout this comprehensive guide, we've explored various techniques and approaches, from basic highlighting using axvspan to more advanced methods involving custom color maps, interactive widgets, and combining multiple highlighting techniques.
We've covered:
- Basic time series plotting with Matplotlib
- Using
axvspanfor simple highlighting - Employing
fill_betweenfor more complex highlighting scenarios - Highlighting multiple time ranges
- Adding labels to highlighted ranges
- Customizing highlight styles
- Highlighting based on data values
- Combining multiple highlighting techniques
- Interactive highlighting with Matplotlib widgets
- Highlighting specific days or patterns (like weekends)
- Using color gradients for highlighting
- Highlighting periodic patterns
- Highlighting based on external events
- Combining highlighting with annotations
- Creating transparency gradient highlights
Each of these techniques offers unique advantages and can be applied in different scenarios depending on your specific data visualization needs. By mastering these methods, you'll be well-equipped to create informative and visually appealing time series plots that effectively communicate your data's story.
Remember, the key to effective data visualization is not just in the techniques you use, but in how you apply them to highlight the most important aspects of your data. Always consider your audience and the message you want to convey when deciding how to highlight time ranges in your plots.