Comprehensive Guide to Using Matplotlib.artist.Artist.set_path_effects() in Python for Enhanced Visualizations
Matplotlib.artist.Artist.set_path_effects() in Python is a powerful method that allows you to apply various visual effects to the paths of artists in Matplotlib. This function is part of the Matplotlib library, which is widely used for creating static, animated, and interactive visualizations in Python. By using set_path_effects(), you can enhance the appearance of your plots, making them more visually appealing and informative. In this comprehensive guide, we’ll explore the ins and outs of Matplotlib.artist.Artist.set_path_effects() in Python, providing numerous examples and explanations to help you master this versatile tool.
Understanding Matplotlib.artist.Artist.set_path_effects() in Python
Matplotlib.artist.Artist.set_path_effects() in Python is a method that belongs to the Artist class in Matplotlib. It allows you to apply path effects to various Matplotlib artists, such as lines, text, and patches. Path effects can include shadows, glows, strokes, and other visual enhancements that can make your plots stand out.
The basic syntax for using Matplotlib.artist.Artist.set_path_effects() in Python is as follows:
import matplotlib.pyplot as plt
import matplotlib.patheffects as path_effects

fig, ax = plt.subplots()
text = ax.text(0.5, 0.5, 'How2matplotlib.com', ha='center', va='center', fontsize=20)
text.set_path_effects([path_effects.Normal()])

plt.show()
Output:

In this example, we create a simple text object and apply a Normal path effect using Matplotlib.artist.Artist.set_path_effects() in Python. The Normal effect doesn’t change the appearance of the text, but it demonstrates how to use the method.
Types of Path Effects in Matplotlib.artist.Artist.set_path_effects()
Matplotlib.artist.Artist.set_path_effects() in Python supports various types of path effects. Let’s explore some of the most commonly used ones:
1. Stroke
The Stroke effect adds an outline to the artist. Here’s an example using Matplotlib.artist.Artist.set_path_effects() in Python to add a stroke effect:
import matplotlib.pyplot as plt
import matplotlib.patheffects as path_effects

fig, ax = plt.subplots()
text = ax.text(0.5, 0.5, 'How2matplotlib.com', ha='center', va='center', fontsize=20)
text.set_path_effects([path_effects.Stroke(linewidth=3, foreground='red'),
                       path_effects.Normal()])

plt.show()
Output:

In this example, we apply a red stroke with a linewidth of 3 to the text using Matplotlib.artist.Artist.set_path_effects() in Python. The Normal effect is added to ensure the original text is still visible.
2. Shadow
The Shadow effect adds a drop shadow to the artist. Here’s how to use Matplotlib.artist.Artist.set_path_effects() in Python to create a shadow effect:
import matplotlib.pyplot as plt
import matplotlib.patheffects as path_effects

fig, ax = plt.subplots()
text = ax.text(0.5, 0.5, 'How2matplotlib.com', ha='center', va='center', fontsize=20)
text.set_path_effects([path_effects.withSimplePatchShadow()])

plt.show()
Output:

This example demonstrates how to add a simple shadow effect to the text using Matplotlib.artist.Artist.set_path_effects() in Python.
3. Glow
The Glow effect adds a glowing appearance to the artist. Here’s an example using Matplotlib.artist.Artist.set_path_effects() in Python to create a glow effect:
import matplotlib.pyplot as plt
import matplotlib.patheffects as path_effects

fig, ax = plt.subplots()
text = ax.text(0.5, 0.5, 'How2matplotlib.com', ha='center', va='center', fontsize=20)
text.set_path_effects([path_effects.withSimplePatchShadow(offset=(0, -1), shadow_rgbFace='blue', alpha=0.8)])

plt.show()
Output:

In this example, we use Matplotlib.artist.Artist.set_path_effects() in Python to create a blue glow effect around the text.
Advanced Usage of Matplotlib.artist.Artist.set_path_effects() in Python
Now that we’ve covered the basics, let’s explore some more advanced uses of Matplotlib.artist.Artist.set_path_effects() in Python.
Combining Multiple Path Effects
You can combine multiple path effects to create more complex visual enhancements. Here’s an example using Matplotlib.artist.Artist.set_path_effects() in Python to combine stroke and shadow effects:
import matplotlib.pyplot as plt
import matplotlib.patheffects as path_effects

fig, ax = plt.subplots()
text = ax.text(0.5, 0.5, 'How2matplotlib.com', ha='center', va='center', fontsize=20)
text.set_path_effects([
    path_effects.Stroke(linewidth=3, foreground='black'),
    path_effects.Normal(),
    path_effects.withSimplePatchShadow(offset=(2, -2), shadow_rgbFace='gray', alpha=0.6)
])

plt.show()
Output:

This example demonstrates how to use Matplotlib.artist.Artist.set_path_effects() in Python to apply both a stroke and a shadow effect to the text.
Applying Path Effects to Lines
Matplotlib.artist.Artist.set_path_effects() in Python can also be applied to lines in your plots. Here’s an example:
import matplotlib.pyplot as plt
import matplotlib.patheffects as path_effects
import numpy as np

fig, ax = plt.subplots()
x = np.linspace(0, 10, 100)
line, = ax.plot(x, np.sin(x), label='How2matplotlib.com')
line.set_path_effects([path_effects.SimpleLineShadow(), path_effects.Normal()])

plt.legend()
plt.show()
Output:
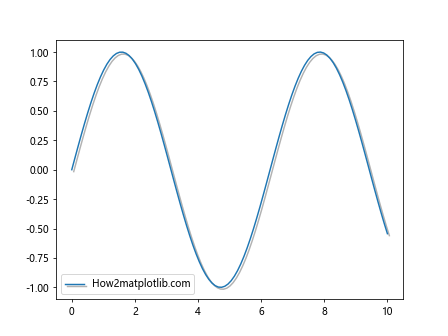
In this example, we use Matplotlib.artist.Artist.set_path_effects() in Python to add a shadow effect to a sine wave plot.
Creating Custom Path Effects
You can create custom path effects by subclassing the AbstractPathEffect class. Here’s an example using Matplotlib.artist.Artist.set_path_effects() in Python with a custom path effect:
import matplotlib.pyplot as plt
import matplotlib.patheffects as path_effects

class MyCustomEffect(path_effects.AbstractPathEffect):
    def __init__(self, offset=(1, -1), alpha=0.7):
        self._offset = offset
        self._alpha = alpha

    def draw_path(self, renderer, gc, tpath, affine, rgbFace):
        offset_tpath = tpath.transformed(affine.translate(self._offset[0], self._offset[1]))
        gc.set_alpha(self._alpha)
        renderer.draw_path(gc, offset_tpath, affine, rgbFace)

fig, ax = plt.subplots()
text = ax.text(0.5, 0.5, 'How2matplotlib.com', ha='center', va='center', fontsize=20)
text.set_path_effects([MyCustomEffect(), path_effects.Normal()])

plt.show()
Output:

This example demonstrates how to create and use a custom path effect with Matplotlib.artist.Artist.set_path_effects() in Python.
Practical Applications of Matplotlib.artist.Artist.set_path_effects() in Python
Let’s explore some practical applications of Matplotlib.artist.Artist.set_path_effects() in Python for various types of plots.
Enhancing Scatter Plots
You can use Matplotlib.artist.Artist.set_path_effects() in Python to enhance scatter plots. Here’s an example:
import matplotlib.pyplot as plt
import matplotlib.patheffects as path_effects
import numpy as np

fig, ax = plt.subplots()
x = np.random.rand(50)
y = np.random.rand(50)
scatter = ax.scatter(x, y, s=100, c='blue', label='How2matplotlib.com')
scatter.set_path_effects([path_effects.withSimplePatchShadow()])

plt.legend()
plt.show()
Output:
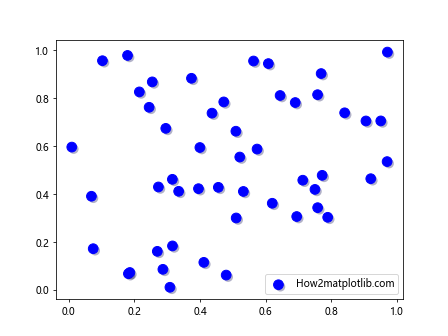
This example demonstrates how to add a shadow effect to scatter plot points using Matplotlib.artist.Artist.set_path_effects() in Python.
Improving Bar Charts
Matplotlib.artist.Artist.set_path_effects() in Python can be used to enhance bar charts. Here’s an example:
import matplotlib.pyplot as plt
import matplotlib.patheffects as path_effects
import numpy as np

fig, ax = plt.subplots()
x = ['A', 'B', 'C', 'D']
y = np.random.rand(4)
bars = ax.bar(x, y)

for bar in bars:
    bar.set_path_effects([path_effects.withSimplePatchShadow()])

ax.set_title('How2matplotlib.com Bar Chart')
plt.show()
Output:
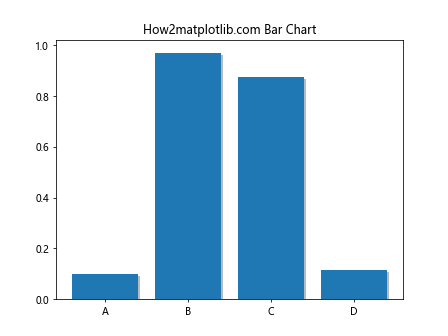
This example shows how to add shadow effects to bars in a bar chart using Matplotlib.artist.Artist.set_path_effects() in Python.
Enhancing Pie Charts
You can use Matplotlib.artist.Artist.set_path_effects() in Python to improve the appearance of pie charts. Here’s an example:
import matplotlib.pyplot as plt
import matplotlib.patheffects as path_effects

fig, ax = plt.subplots()
sizes = [30, 20, 25, 15, 10]
labels = ['A', 'B', 'C', 'D', 'E']
wedges, texts, autotexts = ax.pie(sizes, labels=labels, autopct='%1.1f%%')

for wedge in wedges:
    wedge.set_path_effects([path_effects.withSimplePatchShadow()])

ax.set_title('How2matplotlib.com Pie Chart')
plt.show()
Output:

This example demonstrates how to add shadow effects to pie chart wedges using Matplotlib.artist.Artist.set_path_effects() in Python.
Best Practices for Using Matplotlib.artist.Artist.set_path_effects() in Python
When using Matplotlib.artist.Artist.set_path_effects() in Python, it’s important to follow some best practices to ensure your visualizations are effective and visually appealing.
1. Use Path Effects Sparingly
While Matplotlib.artist.Artist.set_path_effects() in Python can greatly enhance your plots, it’s important not to overuse them. Too many effects can make your plots cluttered and hard to read. Use path effects strategically to highlight important elements or improve readability.
2. Consider Color Contrast
When applying path effects, consider the color contrast between the effect and the original artist. Here’s an example using Matplotlib.artist.Artist.set_path_effects() in Python with careful color consideration:
import matplotlib.pyplot as plt
import matplotlib.patheffects as path_effects

fig, ax = plt.subplots(facecolor='black')
text = ax.text(0.5, 0.5, 'How2matplotlib.com', ha='center', va='center', fontsize=20, color='white')
text.set_path_effects([path_effects.Stroke(linewidth=3, foreground='yellow'),
                       path_effects.Normal()])

plt.show()
Output:

This example demonstrates how to use contrasting colors for better visibility when applying path effects with Matplotlib.artist.Artist.set_path_effects() in Python.
3. Adjust Effect Parameters
Experiment with different parameters for path effects to achieve the desired look. Here’s an example using Matplotlib.artist.Artist.set_path_effects() in Python with adjusted parameters:
import matplotlib.pyplot as plt
import matplotlib.patheffects as path_effects

fig, ax = plt.subplots()
text = ax.text(0.5, 0.5, 'How2matplotlib.com', ha='center', va='center', fontsize=20)
text.set_path_effects([path_effects.withSimplePatchShadow(offset=(3, -3), shadow_rgbFace='red', alpha=0.5),
                       path_effects.Normal()])

plt.show()
Output:

This example shows how to adjust the offset, color, and alpha of a shadow effect using Matplotlib.artist.Artist.set_path_effects() in Python.
Troubleshooting Common Issues with Matplotlib.artist.Artist.set_path_effects() in Python
When working with Matplotlib.artist.Artist.set_path_effects() in Python, you may encounter some common issues. Let’s address a few of them:
1. Path Effects Not Visible
If your path effects are not visible, make sure you’re applying them to the correct artist and that the effect parameters are appropriate. Here’s an example of troubleshooting this issue:
import matplotlib.pyplot as plt
import matplotlib.patheffects as path_effects

fig, ax = plt.subplots()
text = ax.text(0.5, 0.5, 'How2matplotlib.com', ha='center', va='center', fontsize=20)
text.set_path_effects([path_effects.Stroke(linewidth=5, foreground='red'),
                       path_effects.Normal()])

# Ensure the figure is large enough to see the effect
fig.set_size_inches(8, 6)

plt.show()
Output:

This example demonstrates how to make sure the path effect is visible by using a larger linewidth and figure size.
2. Incorrect Ordering of Effects
The order of path effects matters. Make sure you’re applying them in the correct order. Here’s an example using Matplotlib.artist.Artist.set_path_effects() in Python with correct ordering:
import matplotlib.pyplot as plt
import matplotlib.patheffects as path_effects

fig, ax = plt.subplots()
text = ax.text(0.5, 0.5, 'How2matplotlib.com', ha='center', va='center', fontsize=20)
text.set_path_effects([
    path_effects.withSimplePatchShadow(offset=(2, -2), shadow_rgbFace='gray'),
    path_effects.Stroke(linewidth=3, foreground='black'),
    path_effects.Normal()
])

plt.show()
Output:

This example shows the correct ordering of shadow, stroke, and normal effects using Matplotlib.artist.Artist.set_path_effects() in Python.
3. Performance Issues
If you’re applying complex path effects to many artists, you may experience performance issues. In such cases, consider simplifying your effects or reducing the number of artists with effects. Here’s an example of a more efficient use of Matplotlib.artist.Artist.set_path_effects() in Python:
import matplotlib.pyplot as plt
import matplotlib.patheffects as path_effects
import numpy as np

fig, ax = plt.subplots()
x = np.linspace(0, 10, 1000)
y = np.sin(x)

# Apply path effect to the line instead of individual points
line, = ax.plot(x, y, label='How2matplotlib.com')
line.set_path_effects([path_effects.SimpleLineShadow(), path_effects.Normal()])

plt.legend()
plt.show()
Output:
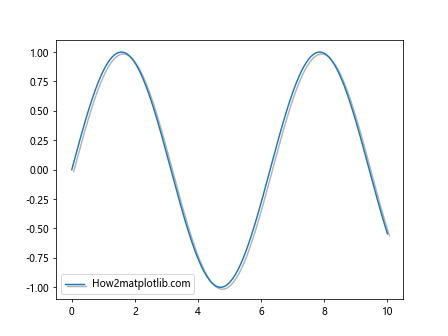
This example demonstrates how to apply path effects to a line plot efficiently using Matplotlib.artist.Artist.set_path_effects() in Python.
Advanced Techniques with Matplotlib.artist.Artist.set_path_effects() in Python
Let’s explore some advanced techniques using Matplotlib.artist.Artist.set_path_effects() in Python to create more complex and visually appealing plots.
Creating 3D-like Effects
You can use Matplotlib.artist.Artist.set_path_effects() in Python to create 3D-like effects on 2D plots. Here’s an example:
import matplotlib.pyplot as plt
import matplotlib.patheffects as path_effects
import numpy as np

fig, ax = plt.subplots()
x = np.linspace(0, 10, 100)
y = np.sin(x)

for i in range(5):继续输出剩余内容:

    offset = i * 0.05
    line, = ax.plot(x, y + offset, color='blue', alpha=0.5)
    line.set_path_effects([path_effects.SimpleLineShadow(offset=(1, -1), alpha=0.2),
                           path_effects.Normal()])

ax.set_title('How2matplotlib.com 3D-like Effect')
plt.show()
This example demonstrates how to create a 3D-like effect for a sine wave using multiple lines and shadows with Matplotlib.artist.Artist.set_path_effects() in Python.
Animated Path Effects
You can create animated path effects using Matplotlib’s animation functionality along with Matplotlib.artist.Artist.set_path_effects() in Python. Here’s an example:
import matplotlib.pyplot as plt
import matplotlib.patheffects as path_effects
import matplotlib.animation as animation
import numpy as np

fig, ax = plt.subplots()
x = np.linspace(0, 2*np.pi, 100)
line, = ax.plot(x, np.sin(x))
line.set_path_effects([path_effects.SimpleLineShadow(), path_effects.Normal()])

def animate(frame):
    line.set_ydata(np.sin(x + frame/10))
    return line,

ani = animation.FuncAnimation(fig, animate, frames=100, interval=50, blit=True)
ax.set_title('How2matplotlib.com Animated Path Effect')
plt.show()
Output:
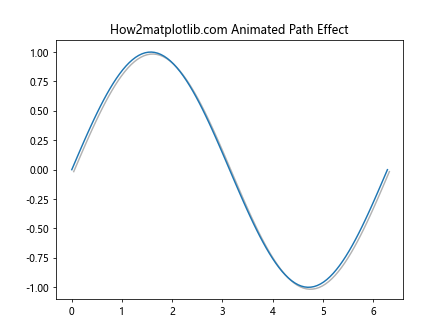
This example shows how to create an animated sine wave with a shadow effect using Matplotlib.artist.Artist.set_path_effects() in Python.
Integrating Matplotlib.artist.Artist.set_path_effects() with Other Matplotlib Features
Matplotlib.artist.Artist.set_path_effects() in Python can be integrated with other Matplotlib features to create even more sophisticated visualizations.
Combining with Colormaps
You can combine path effects with colormaps for interesting visual effects. Here’s an example using Matplotlib.artist.Artist.set_path_effects() in Python with a colormap:
import matplotlib.pyplot as plt
import matplotlib.patheffects as path_effects
import numpy as np

fig, ax = plt.subplots()
x = np.linspace(0, 10, 100)
y = np.sin(x)

points = ax.scatter(x, y, c=y, cmap='viridis')
points.set_path_effects([path_effects.withSimplePatchShadow()])

ax.set_title('How2matplotlib.com Colormap with Path Effects')
plt.colorbar(points)
plt.show()
This example demonstrates how to apply path effects to a scatter plot with a colormap using Matplotlib.artist.Artist.set_path_effects() in Python.
Using with Subplots
Matplotlib.artist.Artist.set_path_effects() in Python can be used with subplots to create complex multi-plot figures. Here’s an example:
import matplotlib.pyplot as plt
import matplotlib.patheffects as path_effects
import numpy as np

fig, (ax1, ax2) = plt.subplots(1, 2, figsize=(12, 5))

x = np.linspace(0, 10, 100)
y1 = np.sin(x)
y2 = np.cos(x)

line1, = ax1.plot(x, y1)
line1.set_path_effects([path_effects.SimpleLineShadow(), path_effects.Normal()])
ax1.set_title('How2matplotlib.com Sine')

line2, = ax2.plot(x, y2)
line2.set_path_effects([path_effects.SimpleLineShadow(), path_effects.Normal()])
ax2.set_title('How2matplotlib.com Cosine')

plt.tight_layout()
plt.show()
Output:
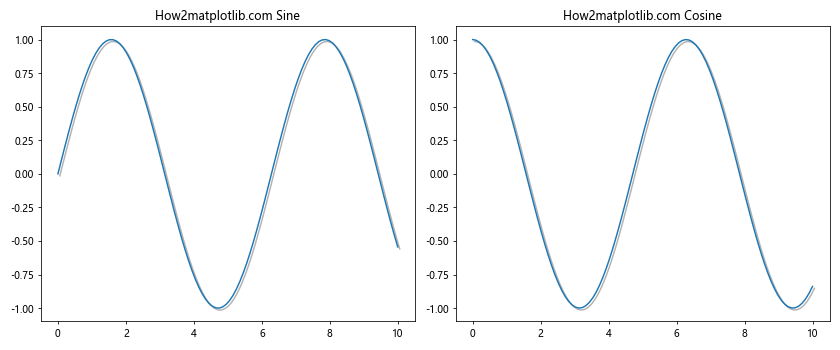
This example shows how to apply path effects to multiple subplots using Matplotlib.artist.Artist.set_path_effects() in Python.
Conclusion
Matplotlib.artist.Artist.set_path_effects() in Python is a powerful tool for enhancing the visual appeal and effectiveness of your Matplotlib plots. From simple shadows and strokes to complex custom effects, this method offers a wide range of possibilities for customizing your visualizations.