Comprehensive Guide to Using Matplotlib.artist.Artist.set_picker() in Python for Interactive Visualizations
Matplotlib.artist.Artist.set_picker() in Python is a powerful method that enhances the interactivity of your plots. This function is an essential tool for creating responsive visualizations, allowing users to interact with plot elements. In this comprehensive guide, we’ll explore the various aspects of Matplotlib.artist.Artist.set_picker(), its usage, and how it can elevate your data visualization experience.
Understanding Matplotlib.artist.Artist.set_picker() in Python
Matplotlib.artist.Artist.set_picker() in Python is a method that belongs to the Artist class in Matplotlib. It’s used to define how an artist (such as a line, scatter plot, or text) can be picked or selected by the user. This function is crucial for creating interactive plots where users can click on or hover over specific elements to trigger events or display additional information.
The basic syntax of Matplotlib.artist.Artist.set_picker() in Python is as follows:
import matplotlib.pyplot as plt

fig, ax = plt.subplots()
line, = ax.plot([1, 2, 3, 4], [1, 4, 2, 3], label='how2matplotlib.com')
line.set_picker(5)  # 5 points tolerance

plt.show()
Output:
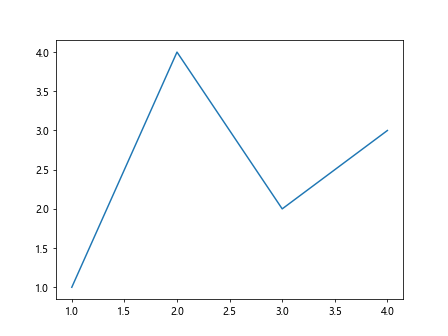
In this example, we create a simple line plot and set the picker for the line with a tolerance of 5 points. This means that clicking within 5 points of the line will trigger a pick event.
The Importance of Matplotlib.artist.Artist.set_picker() in Interactive Visualizations
Matplotlib.artist.Artist.set_picker() in Python plays a crucial role in creating interactive visualizations. It allows users to interact with plot elements, making data exploration more engaging and informative. Here are some key reasons why Matplotlib.artist.Artist.set_picker() is important:
- User Interaction: It enables users to select and interact with specific plot elements.
- Data Exploration: Users can click on data points to reveal more information about them.
- Dynamic Plots: It allows for the creation of dynamic plots that respond to user input.
- Custom Behaviors: Developers can define custom behaviors when plot elements are picked.
Let’s look at an example that demonstrates the importance of Matplotlib.artist.Artist.set_picker() in Python:
import matplotlib.pyplot as plt

fig, ax = plt.subplots()
scatter = ax.scatter([1, 2, 3, 4], [1, 4, 2, 3], label='how2matplotlib.com')
scatter.set_picker(True)

def on_pick(event):
    ind = event.ind
    print(f"Point {ind} selected")

fig.canvas.mpl_connect('pick_event', on_pick)

plt.show()
Output:
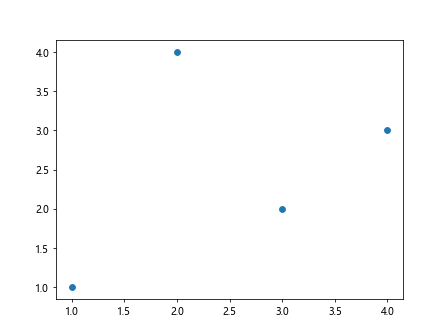
In this example, we create a scatter plot and set the picker for all points. When a point is clicked, it prints the index of the selected point.
Basic Usage of Matplotlib.artist.Artist.set_picker() in Python
The basic usage of Matplotlib.artist.Artist.set_picker() in Python involves setting a picker for an artist and defining a callback function to handle pick events. Here’s a simple example:
import matplotlib.pyplot as plt

fig, ax = plt.subplots()
line, = ax.plot([1, 2, 3, 4], [1, 4, 2, 3], label='how2matplotlib.com')
line.set_picker(5)

def on_pick(event):
    thisline = event.artist
    xdata = thisline.get_xdata()
    ydata = thisline.get_ydata()
    ind = event.ind
    print(f'Point selected: x={xdata[ind]}, y={ydata[ind]}')

fig.canvas.mpl_connect('pick_event', on_pick)

plt.show()
Output:
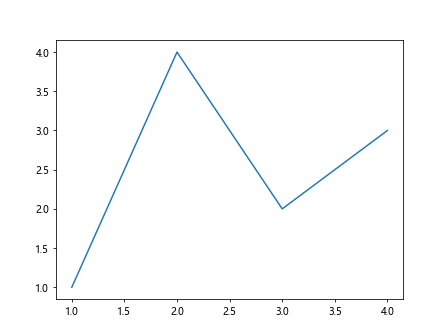
In this example, we set a picker for a line plot and define a callback function that prints the coordinates of the selected point.
Advanced Techniques with Matplotlib.artist.Artist.set_picker() in Python
Matplotlib.artist.Artist.set_picker() in Python offers advanced techniques for creating more sophisticated interactive visualizations. Here are some advanced uses:
Custom Picker Functions
Instead of using a tolerance value, you can pass a custom function to Matplotlib.artist.Artist.set_picker() in Python:
import matplotlib.pyplot as plt
import numpy as np

fig, ax = plt.subplots()
line, = ax.plot(np.random.rand(100), 'o', picker=lambda line, mouseevent: (mouseevent.xdata, mouseevent.ydata))

def on_pick(event):
    print(f"Picked point at: {event.mouseevent.xdata}, {event.mouseevent.ydata}")

fig.canvas.mpl_connect('pick_event', on_pick)
plt.title('how2matplotlib.com')
plt.show()
Output:
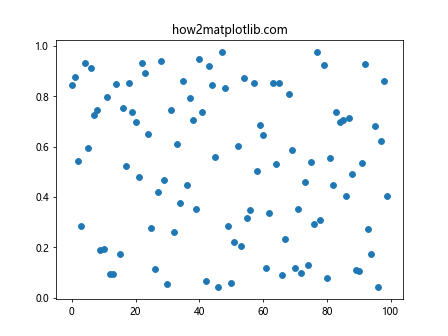
This example uses a custom picker function that returns the exact coordinates of the mouse click.
Multiple Artists with Different Pickers
You can set different pickers for different artists in the same plot:
import matplotlib.pyplot as plt

fig, ax = plt.subplots()
line1, = ax.plot([1, 2, 3, 4], [1, 4, 2, 3], 'ro-', label='Line 1')
line2, = ax.plot([1, 2, 3, 4], [2, 3, 4, 1], 'bo-', label='Line 2')

line1.set_picker(5)
line2.set_picker(lambda line, mouseevent: (mouseevent.xdata, mouseevent.ydata))

def on_pick(event):
    if event.artist == line1:
        print("Line 1 picked")
    elif event.artist == line2:
        print("Line 2 picked")

fig.canvas.mpl_connect('pick_event', on_pick)
plt.title('how2matplotlib.com')
plt.legend()
plt.show()
Output:
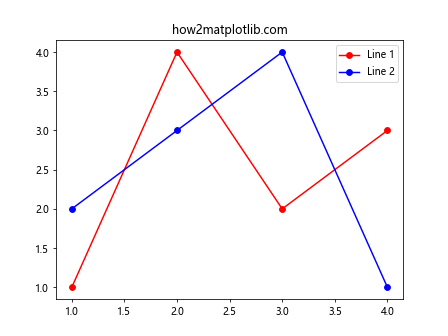
This example sets different pickers for two lines and handles them differently in the callback function.
Handling Pick Events with Matplotlib.artist.Artist.set_picker() in Python
When using Matplotlib.artist.Artist.set_picker() in Python, it’s crucial to understand how to handle pick events effectively. Here’s an example that demonstrates various ways to handle pick events:
import matplotlib.pyplot as plt
import numpy as np

fig, ax = plt.subplots()
x = np.linspace(0, 10, 100)
line, = ax.plot(x, np.sin(x), picker=5)

def on_pick(event):
    if event.artist == line:
        thisline = event.artist
        xdata = thisline.get_xdata()
        ydata = thisline.get_ydata()
        ind = event.ind
        print(f'Point selected: x={xdata[ind]}, y={ydata[ind]}')

def on_mouse_move(event):
    if event.inaxes:
        print(f'Mouse position: x={event.xdata}, y={event.ydata}')

fig.canvas.mpl_connect('pick_event', on_pick)
fig.canvas.mpl_connect('motion_notify_event', on_mouse_move)

plt.title('how2matplotlib.com')
plt.show()
Output:
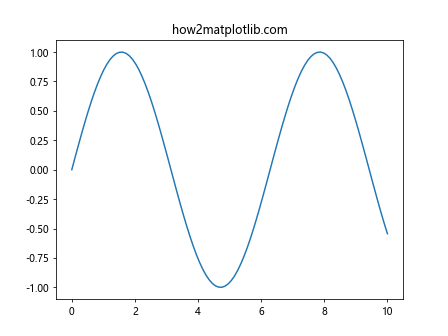
This example demonstrates how to handle both pick events and mouse movement events, providing a rich interactive experience.
Customizing Pick Behavior with Matplotlib.artist.Artist.set_picker() in Python
Matplotlib.artist.Artist.set_picker() in Python allows for extensive customization of pick behavior. Here’s an example that demonstrates how to customize the pick behavior:
import matplotlib.pyplot as plt
import numpy as np

fig, ax = plt.subplots()
x = np.linspace(0, 10, 100)
line, = ax.plot(x, np.sin(x), 'o-', picker=True, pickradius=5)

def on_pick(event):
    if event.artist == line:
        ind = event.ind
        print(f'Point {ind} selected')
        line.set_markerfacecolor('red')
        line.set_markeredgecolor('red')
        fig.canvas.draw()

def on_click(event):
    if event.inaxes == ax:
        line.set_markerfacecolor('blue')
        line.set_markeredgecolor('blue')
        fig.canvas.draw()

fig.canvas.mpl_connect('pick_event', on_pick)
fig.canvas.mpl_connect('button_press_event', on_click)

plt.title('how2matplotlib.com')
plt.show()
Output:
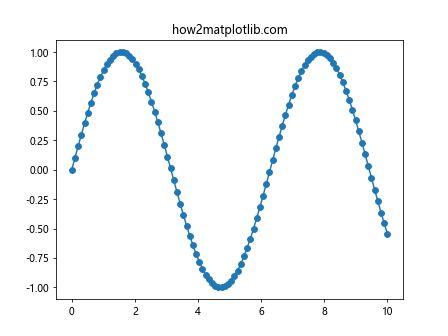
This example changes the color of selected points and resets the color when clicking outside the points.
Integrating Matplotlib.artist.Artist.set_picker() with Other Matplotlib Features
Matplotlib.artist.Artist.set_picker() in Python can be integrated with other Matplotlib features to create more complex interactive visualizations. Here’s an example that combines picking with annotations:
import matplotlib.pyplot as plt
import numpy as np

fig, ax = plt.subplots()
x = np.linspace(0, 10, 100)
line, = ax.plot(x, np.sin(x), 'o-', picker=5)

annotation = ax.annotate('', xy=(0, 0), xytext=(20, 20), textcoords='offset points',
                         bbox=dict(boxstyle='round,pad=0.5', fc='yellow', alpha=0.5),
                         arrowprops=dict(arrowstyle='->', connectionstyle='arc3,rad=0'))
annotation.set_visible(False)

def on_pick(event):
    if event.artist == line:
        thisline = event.artist
        xdata = thisline.get_xdata()
        ydata = thisline.get_ydata()
        ind = event.ind
        annotation.xy = (xdata[ind], ydata[ind])
        annotation.set_text(f'x={xdata[ind]:.2f}, y={ydata[ind]:.2f}')
        annotation.set_visible(True)
        fig.canvas.draw()

fig.canvas.mpl_connect('pick_event', on_pick)

plt.title('how2matplotlib.com')
plt.show()
Output:
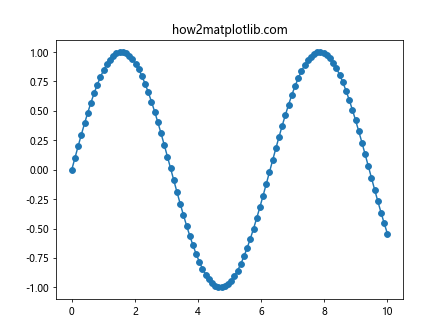
This example shows an annotation when a point is picked, displaying its coordinates.
Best Practices for Using Matplotlib.artist.Artist.set_picker() in Python
When working with Matplotlib.artist.Artist.set_picker() in Python, it’s important to follow best practices to ensure efficient and effective use of this feature. Here are some best practices:
- Use appropriate tolerance values: Set the picker tolerance to a value that balances ease of selection with precision.
- Handle pick events efficiently: Avoid computationally expensive operations in pick event handlers to maintain responsiveness.
- Provide visual feedback: Give users visual cues when elements are picked to enhance the interactive experience.
- Use custom picker functions for complex scenarios: When simple tolerance-based picking isn’t sufficient, implement custom picker functions.
- Combine with other interactive features: Integrate picking with other interactive features like zooming and panning for a comprehensive user experience.
Here’s an example that demonstrates these best practices:
import matplotlib.pyplot as plt
import numpy as np

fig, ax = plt.subplots()
x = np.linspace(0, 10, 100)
line, = ax.plot(x, np.sin(x), 'o-', picker=5, label='Sin(x)')

highlight, = ax.plot([], [], 'ro', ms=12, alpha=0.5, zorder=10)

def on_pick(event):
    if event.artist == line:
        ind = event.ind
        x_picked = x[ind]
        y_picked = np.sin(x[ind])
        highlight.set_data(x_picked, y_picked)
        ax.set_title(f'Selected point: ({x_picked[0]:.2f}, {y_picked[0]:.2f})')
        fig.canvas.draw()

fig.canvas.mpl_connect('pick_event', on_pick)

plt.title('how2matplotlib.com')
plt.legend()
plt.show()
Output:
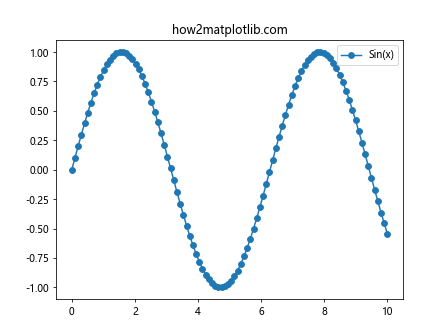
This example demonstrates efficient handling of pick events, visual feedback, and integration with other plot elements.
Troubleshooting Common Issues with Matplotlib.artist.Artist.set_picker() in Python
When using Matplotlib.artist.Artist.set_picker() in Python, you may encounter some common issues. Here are some problems and their solutions:
- Pick events not triggering:
- Ensure that you’ve connected the pick event to a callback function.
- Check if the picker tolerance is appropriate for your data.
- Performance issues with large datasets:
- Use more efficient data structures or sampling techniques for large datasets.
- Implement custom picker functions that are optimized for your specific use case.
- Inconsistent behavior across different plot types:
- Be aware that different plot types may have different default picker behaviors.
- Use custom picker functions for consistent behavior across different plot types.
Here’s an example that demonstrates how to handle these issues:
import matplotlib.pyplot as plt
import numpy as np

fig, (ax1, ax2) = plt.subplots(1, 2, figsize=(12, 5))

# Large dataset
x = np.linspace(0, 10, 1000)
y = np.sin(x)
line, = ax1.plot(x, y, 'o', markersize=2, picker=True)

# Custom picker function for efficiency
def line_picker(line, mouseevent):
    if mouseevent.xdata is None:
        return False, dict()
    xdata = line.get_xdata()
    ydata = line.get_ydata()
    maxd = 0.05
    d = np.sqrt((xdata - mouseevent.xdata)**2 + (ydata - mouseevent.ydata)**2)
    ind = np.nonzero(np.less_equal(d, maxd))
    if len(ind[0]) > 0:
        return True, dict(ind=ind[0])
    else:
        return False, dict()

line.set_picker(line_picker)

# Different plot type
scatter = ax2.scatter(np.random.rand(100), np.random.rand(100), picker=True)

def on_pick(event):
    if event.artist == line:
        ind = event.ind
        print(f'Line point picked: x={x[ind][0]:.2f}, y={y[ind][0]:.2f}')
    elif event.artist == scatter:
        ind = event.ind
        print(f'Scatter point picked: {ind}')

fig.canvas.mpl_connect('pick_event', on_pick)

plt.suptitle('how2matplotlib.com')
plt.show()
Output:
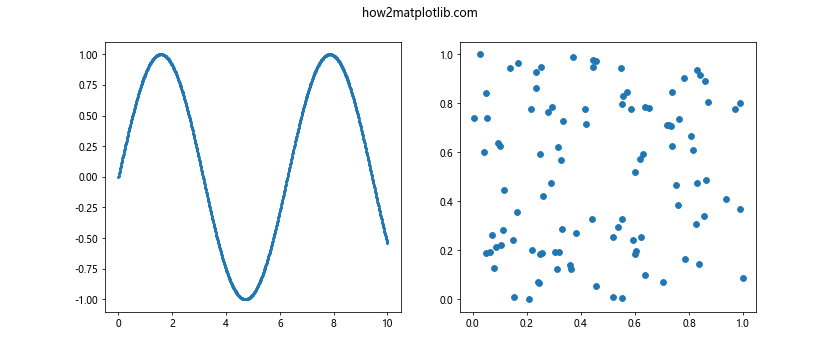
This example demonstrates how to handle large datasets efficiently and maintain consistent behavior across different plot types.
Comparing Matplotlib.artist.Artist.set_picker() with Other Interactive Tools in Python
While Matplotlib.artist.Artist.set_picker() in Python is a powerful tool for creating interactive visualizations, it’s worth comparing it with other interactive tools available in the Python ecosystem. Here’s a comparison:
- Matplotlib.artist.Artist.set_picker() vs. Plotly:
- Matplotlib.artist.Artist.set_picker() offers more fine-grained control but requires more code.
- Plotly provides easier-to-implement interactivity but with less customization.
- Matplotlib.artist.Artist.set_picker() vs. Bokeh:
- Matplotlib.artist.Artist.set_picker() is better for static plots with some interactivity.
- Bokeh is designed for web-based interactive visualizations.
- Matplotlib.artist.Artist.set_picker() vs. Seaborn:
- Matplotlib.artist.Artist.set_picker() allows for custom interactivity.
- Seaborn focuses on statistical visualizations with limited built-in interactivity.
Here’s an example that demonstrates how Matplotlib.artist.Artist.set_picker() can be used to create an interactive visualization similar to what you might achieve with other libraries:
import matplotlib.pyplot as plt
import numpy as np
from matplotlib.widgets import Button

fig, ax = plt.subplots()
x = np.linspace(0, 10, 100)
line, = ax.plot(x, np.sin(x), picker=5)

def sine(x):
    return np.sin(x)

def cosine(x):
    return np.cos(x)

current_func = sine

def update(func):
    line.set_ydata(func(x))
    fig.canvas.draw()

def on_pick(event):
    if event.artist == line:
        xdata = event.artist.get_xdata()
        ydata = event.artist.get_ydata()
        ind = event.ind
        print(f'Point selected: x={xdata[ind][0]:.2f}, y={ydata[ind][0]:.2f}')

def toggle_func(event):
    global current_func
    if current_func == sine:
        current_func = cosine
        update(cosine)
        button.label.set_text('Switch to Sine')
    else:
        current_func = sine
        update(sine)
        button.label.set_text('Switch to Cosine')

fig.canvas.mpl_connect('pick_event', on_pick)

ax_button = plt.axes([0.81, 0.05, 0.1, 0.075])
button = Button(ax_button, 'Switch to Cosine')
button.on_clicked(toggle_func)

plt.title('Interactive Function Plot - how2matplotlib.com')
plt.show()
Output:
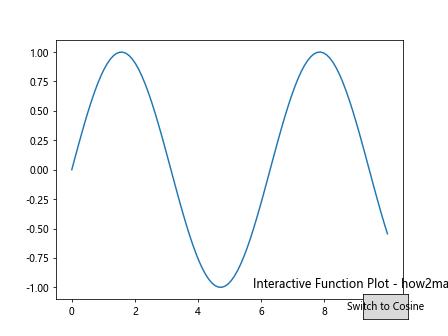
This example creates an interactive plot where users can switch between sine and cosine functions and pick points on the curve.
Future Developments and Trends in Interactive Visualization with Matplotlib.artist.Artist.set_picker() in Python
As data visualization continues to evolve, we can expect to see new developments and trends in how Matplotlib.artist.Artist.set_picker() in Python is used for interactive visualizations. Here are some potential future developments:
- Integration with Machine Learning: Combining Matplotlib.artist.Artist.set_picker() with machine learning models for interactive data exploration and model interpretation.
Real-time Data Visualization: Using Matplotlib.artist.Artist.set_picker() for real-time data streams, allowing users to interact with live data.
Virtual and Augmented Reality: Extending Matplotlib.artist.Artist.set_picker() to work in VR and AR environments for immersive data visualization.
Collaborative Visualization: Developing tools that allow multiple users to interact with the same visualization simultaneously using Matplotlib.artist.Artist.set_picker().
Here’s an example that demonstrates a potential future application combining Matplotlib.artist.Artist.set_picker() with a simple machine learning model: