How to Draw Rectangle on Image in Matplotlib
How to Draw Rectangle on Image in Matplotlib is an essential skill for data visualization and image processing tasks. This article will provide a detailed exploration of various techniques and methods to draw rectangles on images using Matplotlib, one of the most popular plotting libraries in Python. We’ll cover everything from basic rectangle drawing to more advanced customization options, ensuring you have a thorough understanding of how to draw rectangles on images in Matplotlib.
Understanding the Basics of Drawing Rectangles in Matplotlib
Before we dive into drawing rectangles on images, it’s crucial to understand the fundamental concepts of how to draw rectangles in Matplotlib. Matplotlib provides several ways to draw rectangles, and we’ll explore each of them in detail.
Using plt.Rectangle
The most straightforward method to draw a rectangle in Matplotlib is by using the plt.Rectangle function. This function allows you to create a rectangle patch that can be added to your plot.
Here’s a simple example of how to draw a rectangle using plt.Rectangle:
import matplotlib.pyplot as plt

fig, ax = plt.subplots()
rect = plt.Rectangle((0.2, 0.2), 0.6, 0.4, fill=False, edgecolor='red')
ax.add_patch(rect)
ax.text(0.5, 0.5, 'how2matplotlib.com', ha='center', va='center')
plt.show()
Output:
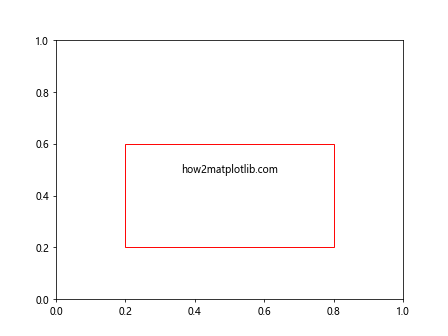
In this example, we create a rectangle with its lower-left corner at (0.2, 0.2), a width of 0.6, and a height of 0.4. The fill=False parameter makes the rectangle transparent, and edgecolor='red' sets the border color to red.
Using ax.add_patch
Another way to draw rectangles is by using the add_patch method of the axes object. This method allows you to add various shapes, including rectangles, to your plot.
Here’s an example of how to draw a rectangle using ax.add_patch:
import matplotlib.pyplot as plt
from matplotlib.patches import Rectangle

fig, ax = plt.subplots()
rect = Rectangle((0.1, 0.1), 0.8, 0.6, fill=False, edgecolor='blue')
ax.add_patch(rect)
ax.text(0.5, 0.5, 'how2matplotlib.com', ha='center', va='center')
plt.show()
Output:
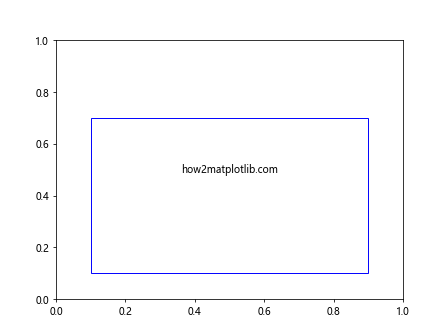
In this example, we import the Rectangle class from matplotlib.patches and create a rectangle object. We then add this rectangle to our plot using ax.add_patch().
Drawing Rectangles on Images in Matplotlib
Now that we understand the basics of drawing rectangles in Matplotlib, let’s focus on how to draw rectangles on images. This skill is particularly useful for highlighting specific areas of interest in an image or for creating bounding boxes in computer vision applications.
Loading an Image in Matplotlib
Before we can draw rectangles on an image, we need to load the image into Matplotlib. We can do this using the plt.imread() function.
Here’s an example of how to load an image and display it using Matplotlib:
import matplotlib.pyplot as plt
import numpy as np

# Create a sample image
image = np.random.rand(100, 100, 3)

fig, ax = plt.subplots()
ax.imshow(image)
ax.text(50, 50, 'how2matplotlib.com', ha='center', va='center', color='white')
plt.show()
Output:
In this example, we create a random image using NumPy for demonstration purposes. In practice, you would typically load an actual image file using plt.imread().
Drawing a Rectangle on an Image
Now that we have our image loaded, let’s draw a rectangle on it. We’ll use the Rectangle class from matplotlib.patches to create our rectangle.
Here’s an example of how to draw a rectangle on an image:
import matplotlib.pyplot as plt
import numpy as np
from matplotlib.patches import Rectangle

# Create a sample image
image = np.random.rand(100, 100, 3)

fig, ax = plt.subplots()
ax.imshow(image)

# Draw a rectangle
rect = Rectangle((20, 20), 60, 40, fill=False, edgecolor='red', linewidth=2)
ax.add_patch(rect)

ax.text(50, 50, 'how2matplotlib.com', ha='center', va='center', color='white')
plt.show()
Output:
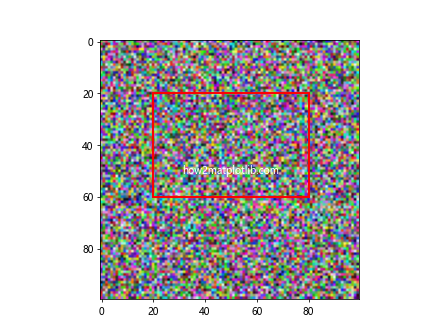
In this example, we draw a red rectangle with its top-left corner at (20, 20), a width of 60 pixels, and a height of 40 pixels. The fill=False parameter makes the rectangle transparent, allowing the image underneath to be visible.
Customizing Rectangles on Images in Matplotlib
How to Draw Rectangle on Image in Matplotlib goes beyond just drawing basic shapes. Matplotlib offers a wide range of customization options that allow you to create visually appealing and informative rectangles on your images.
Changing Rectangle Colors
One of the simplest ways to customize your rectangles is by changing their colors. Matplotlib supports a wide range of color specifications, including named colors, RGB tuples, and hex color codes.
Here’s an example of how to draw rectangles with different colors:
import matplotlib.pyplot as plt
import numpy as np
from matplotlib.patches import Rectangle

# Create a sample image
image = np.random.rand(100, 100, 3)

fig, ax = plt.subplots()
ax.imshow(image)

# Draw rectangles with different colors
rect1 = Rectangle((10, 10), 30, 30, fill=False, edgecolor='red', linewidth=2)
rect2 = Rectangle((60, 60), 30, 30, fill=False, edgecolor='#00FF00', linewidth=2)
rect3 = Rectangle((10, 60), 30, 30, fill=False, edgecolor=(0, 0, 1), linewidth=2)

ax.add_patch(rect1)
ax.add_patch(rect2)
ax.add_patch(rect3)

ax.text(50, 50, 'how2matplotlib.com', ha='center', va='center', color='white')
plt.show()
Output:
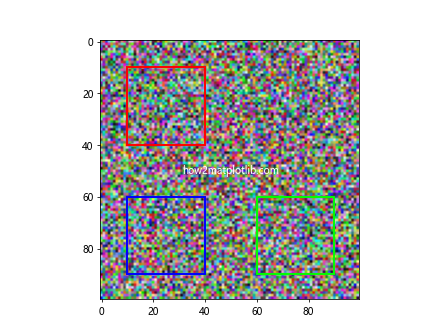
In this example, we draw three rectangles with different colors: red (using a named color), green (using a hex color code), and blue (using an RGB tuple).
Adjusting Line Styles
Another way to customize your rectangles is by adjusting their line styles. Matplotlib supports various line styles, including solid, dashed, dotted, and dash-dot lines.
Here’s an example of how to draw rectangles with different line styles:
import matplotlib.pyplot as plt
import numpy as np
from matplotlib.patches import Rectangle

# Create a sample image
image = np.random.rand(100, 100, 3)

fig, ax = plt.subplots()
ax.imshow(image)

# Draw rectangles with different line styles
rect1 = Rectangle((10, 10), 30, 30, fill=False, edgecolor='red', linestyle='-', linewidth=2)
rect2 = Rectangle((60, 60), 30, 30, fill=False, edgecolor='green', linestyle='--', linewidth=2)
rect3 = Rectangle((10, 60), 30, 30, fill=False, edgecolor='blue', linestyle=':', linewidth=2)

ax.add_patch(rect1)
ax.add_patch(rect2)
ax.add_patch(rect3)

ax.text(50, 50, 'how2matplotlib.com', ha='center', va='center', color='white')
plt.show()
Output:
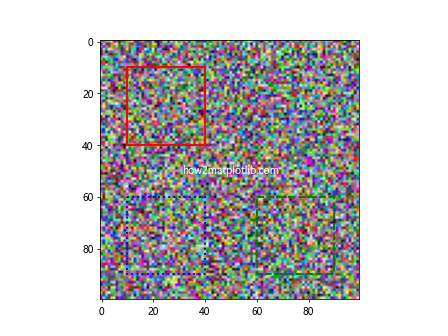
In this example, we draw three rectangles with different line styles: solid, dashed, and dotted.
Adding Transparency
Sometimes, you may want to draw semi-transparent rectangles on your images. This can be achieved by setting the alpha parameter when creating your rectangle.
Here’s an example of how to draw semi-transparent rectangles:
import matplotlib.pyplot as plt
import numpy as np
from matplotlib.patches import Rectangle

# Create a sample image
image = np.random.rand(100, 100, 3)

fig, ax = plt.subplots()
ax.imshow(image)

# Draw semi-transparent rectangles
rect1 = Rectangle((10, 10), 50, 50, fill=True, facecolor='red', alpha=0.3)
rect2 = Rectangle((40, 40), 50, 50, fill=True, facecolor='blue', alpha=0.3)

ax.add_patch(rect1)
ax.add_patch(rect2)

ax.text(50, 50, 'how2matplotlib.com', ha='center', va='center', color='white')
plt.show()
Output:
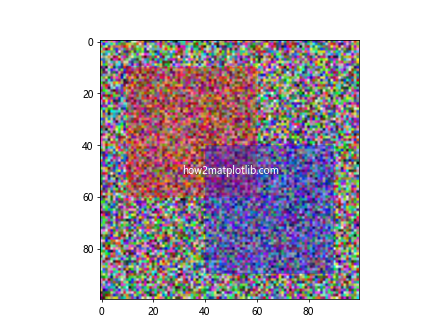
In this example, we draw two overlapping semi-transparent rectangles. The alpha parameter is set to 0.3, making the rectangles 70% transparent.
Advanced Techniques for Drawing Rectangles on Images in Matplotlib
As we delve deeper into how to draw rectangle on image in Matplotlib, let’s explore some more advanced techniques that can enhance your visualizations and make them more informative.
Drawing Multiple Rectangles
In many applications, you may need to draw multiple rectangles on a single image. This is common in object detection tasks, where you might want to highlight multiple objects in an image.
Here’s an example of how to draw multiple rectangles on an image:
import matplotlib.pyplot as plt
import numpy as np
from matplotlib.patches import Rectangle

# Create a sample image
image = np.random.rand(100, 100, 3)

fig, ax = plt.subplots()
ax.imshow(image)

# Define rectangle coordinates and sizes
rectangles = [
    ((10, 10), 20, 30),
    ((50, 50), 40, 20),
    ((30, 70), 25, 25)
]

# Draw multiple rectangles
for (x, y), width, height in rectangles:
    rect = Rectangle((x, y), width, height, fill=False, edgecolor='red', linewidth=2)
    ax.add_patch(rect)

ax.text(50, 50, 'how2matplotlib.com', ha='center', va='center', color='white')
plt.show()
Output:
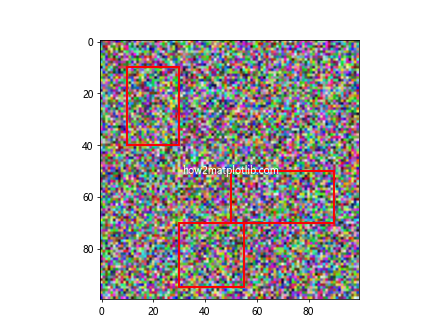
In this example, we define a list of rectangle specifications (position, width, and height) and then iterate over this list to draw multiple rectangles on the image.
Adding Labels to Rectangles
When drawing rectangles on images, it’s often useful to add labels to provide additional information about each rectangle. This can be achieved by using Matplotlib’s text annotation capabilities.
Here’s an example of how to add labels to rectangles:
import matplotlib.pyplot as plt
import numpy as np
from matplotlib.patches import Rectangle

# Create a sample image
image = np.random.rand(100, 100, 3)

fig, ax = plt.subplots()
ax.imshow(image)

# Define rectangles with labels
rectangles = [
    ((10, 10), 20, 30, 'Object 1'),
    ((50, 50), 40, 20, 'Object 2'),
    ((30, 70), 25, 25, 'Object 3')
]

# Draw rectangles with labels
for (x, y), width, height, label in rectangles:
    rect = Rectangle((x, y), width, height, fill=False, edgecolor='red', linewidth=2)
    ax.add_patch(rect)
    ax.text(x, y-5, label, color='white', fontweight='bold', backgroundcolor='red')

ax.text(50, 50, 'how2matplotlib.com', ha='center', va='center', color='white')
plt.show()
Output:
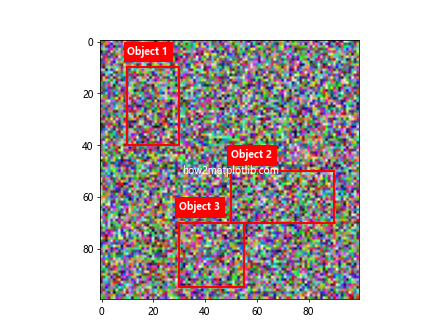
In this example, we add a label to each rectangle. The labels are positioned just above the top-left corner of each rectangle and are given a white color with a red background for better visibility.
Creating Animated Rectangles
Matplotlib also supports animation, which can be useful for creating dynamic visualizations. Let’s see how we can create animated rectangles on an image.
Here’s an example of how to create a simple animation of a growing rectangle:
import matplotlib.pyplot as plt
import numpy as np
from matplotlib.patches import Rectangle
from matplotlib.animation import FuncAnimation

# Create a sample image
image = np.random.rand(100, 100, 3)

fig, ax = plt.subplots()
ax.imshow(image)

rect = Rectangle((40, 40), 0, 0, fill=False, edgecolor='red', linewidth=2)
ax.add_patch(rect)

def animate(frame):
    rect.set_width(frame)
    rect.set_height(frame)
    return rect,

anim = FuncAnimation(fig, animate, frames=20, interval=100, blit=True)

ax.text(50, 50, 'how2matplotlib.com', ha='center', va='center', color='white')
plt.show()
Output:
In this example, we create an animation where a rectangle grows from a point to a 20×20 square. The FuncAnimation class is used to create the animation, with the animate function updating the rectangle’s size in each frame.
Practical Applications of Drawing Rectangles on Images in Matplotlib
Understanding how to draw rectangle on image in Matplotlib opens up a wide range of practical applications in various fields. Let’s explore some of these applications and see how we can implement them using Matplotlib.
Object Detection Visualization
One common application of drawing rectangles on images is in object detection tasks. After running an object detection algorithm, you might want to visualize the detected objects by drawing bounding boxes around them.
Here’s an example of how you might visualize object detection results:
import matplotlib.pyplot as plt
import numpy as np
from matplotlib.patches import Rectangle

# Create a sample image
image = np.random.rand(100, 100, 3)

# Simulated object detection results
detections = [
    {'label': 'Car', 'bbox': (10, 10, 30, 20), 'confidence': 0.95},
    {'label': 'Person', 'bbox': (50, 50, 20, 40), 'confidence': 0.87},
    {'label': 'Dog', 'bbox': (70, 30, 25, 15), 'confidence': 0.92}
]

fig, ax = plt.subplots()
ax.imshow(image)

for det in detections:
    x, y, w, h = det['bbox']
    rect = Rectangle((x, y), w, h, fill=False, edgecolor='red', linewidth=2)
    ax.add_patch(rect)
    label = f"{det['label']} ({det['confidence']:.2f})"
    ax.text(x, y-5, label, color='white', fontweight='bold', backgroundcolor='red')

ax.text(50, 50, 'how2matplotlib.com', ha='center', va='center', color='white')
plt.show()
Output:
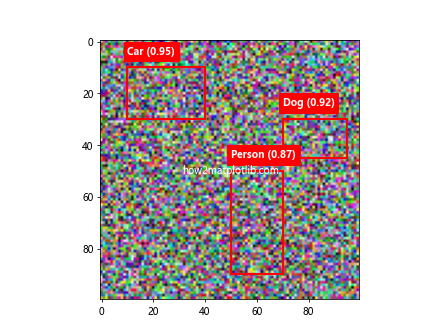
In this example, we simulate object detection results and visualize them by drawing bounding boxes and labels for each detected object.
Image Cropping Visualization
Another practical application is visualizing image cropping. You might want to show which part of an image will be cropped before actually performing the crop operation.
Here’s an example of how to visualize image cropping:
import matplotlib.pyplot as plt
import numpy as np
from matplotlib.patches import Rectangle

# Create a sample image
image = np.random.rand(100, 100, 3)

# Define crop region
crop_x, crop_y = 30, 30
crop_width, crop_height = 40, 40

fig, (ax1, ax2) = plt.subplots(1, 2, figsize=(10, 5))

# Original image with crop region
ax1.imshow(image)
rect = Rectangle((crop_x, crop_y), crop_width, crop_height, fill=False, edgecolor='red', linewidth=2)
ax1.add_patch(rect)
ax1.set_title('Original Image with Crop Region')

# Cropped image
ax2.imshow(image[crop_y:crop_y+crop_height, crop_x:crop_x+crop_width])
ax2.set_title('Cropped Image')

ax1.text(50, 50,'how2matplotlib.com', ha='center', va='center', color='white')
ax2.text(20, 20, 'how2matplotlib.com', ha='center', va='center', color='white')
plt.show()
Output:
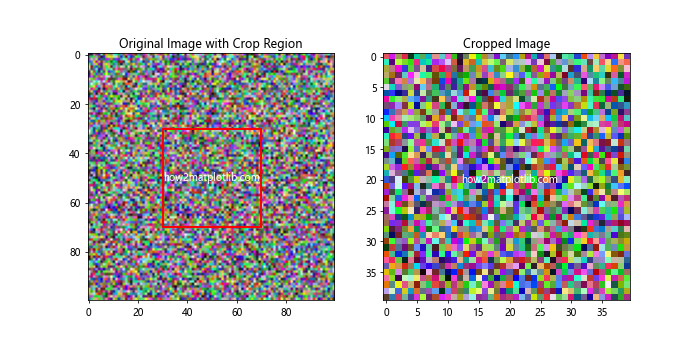
In this example, we visualize both the original image with the crop region highlighted and the resulting cropped image side by side.
Heatmap Overlay
Drawing rectangles can also be useful when creating heatmap overlays. You might want to highlight specific regions of interest on a heatmap.
Here’s an example of how to create a heatmap with highlighted regions:
import matplotlib.pyplot as plt
import numpy as np
from matplotlib.patches import Rectangle

# Create a sample heatmap data
heatmap_data = np.random.rand(20, 20)

fig, ax = plt.subplots()
im = ax.imshow(heatmap_data, cmap='hot')

# Define regions of interest
roi = [
    ((5, 5), 3, 3, 'ROI 1'),
    ((12, 8), 4, 4, 'ROI 2'),
    ((7, 15), 5, 3, 'ROI 3')
]

# Draw rectangles for regions of interest
for (x, y), w, h, label in roi:
    rect = Rectangle((x, y), w, h, fill=False, edgecolor='blue', linewidth=2)
    ax.add_patch(rect)
    ax.text(x, y-0.5, label, color='blue', fontweight='bold')

plt.colorbar(im)
ax.text(10, 10, 'how2matplotlib.com', ha='center', va='center', color='white')
plt.show()
Output:
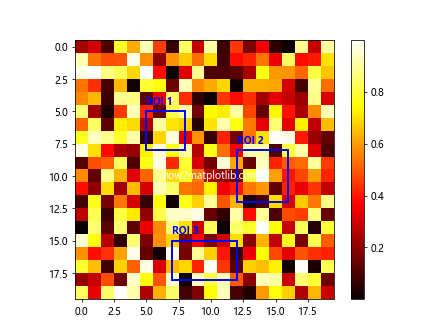
In this example, we create a heatmap and highlight specific regions of interest by drawing rectangles around them.
Advanced Customization Techniques for Drawing Rectangles on Images in Matplotlib
As we continue to explore how to draw rectangle on image in Matplotlib, let’s delve into some more advanced customization techniques that can help you create even more sophisticated visualizations.
Creating Gradient-Filled Rectangles
While we’ve mostly been working with unfilled rectangles, you can also create filled rectangles with gradient colors for more visually appealing effects.
Here’s an example of how to create gradient-filled rectangles:
import matplotlib.pyplot as plt
import numpy as np
from matplotlib.patches import Rectangle
from matplotlib.colors import LinearSegmentedColormap

# Create a sample image
image = np.random.rand(100, 100, 3)

fig, ax = plt.subplots()
ax.imshow(image)

# Create a custom colormap
colors = ['red', 'yellow', 'green']
n_bins = 100
cmap = LinearSegmentedColormap.from_list('custom', colors, N=n_bins)

# Create gradient-filled rectangle
gradient = np.linspace(0, 1, 256).reshape(1, -1)
gradient = np.vstack((gradient, gradient))

rect = Rectangle((20, 20), 60, 60, fill=False, edgecolor='black', linewidth=2)
ax.add_patch(rect)

ax.imshow(gradient, cmap=cmap, aspect='auto', extent=[20, 80, 20, 80], alpha=0.6)

ax.text(50, 50, 'how2matplotlib.com', ha='center', va='center', color='white')
plt.show()
Output:
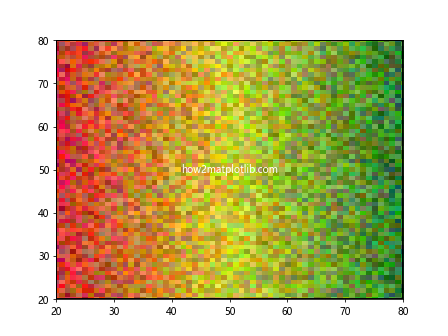
In this example, we create a gradient-filled rectangle by combining a regular rectangle with a gradient image overlay.
Adding Patterns to Rectangles
Another way to customize your rectangles is by adding patterns. Matplotlib provides a set of hatching patterns that you can use to fill your rectangles.
Here’s an example of how to add patterns to rectangles:
import matplotlib.pyplot as plt
import numpy as np
from matplotlib.patches import Rectangle

# Create a sample image
image = np.random.rand(100, 100, 3)

fig, ax = plt.subplots()
ax.imshow(image)

# Define different hatch patterns
hatch_patterns = ['/', '\\', '|', '-', '+', 'x', 'o', 'O', '.', '*']

for i, pattern in enumerate(hatch_patterns):
    rect = Rectangle((i*10, i*10), 20, 20, fill=False, hatch=pattern,
                     edgecolor='red', facecolor='none')
    ax.add_patch(rect)

ax.text(50, 50, 'how2matplotlib.com', ha='center', va='center', color='white')
plt.show()
Output:
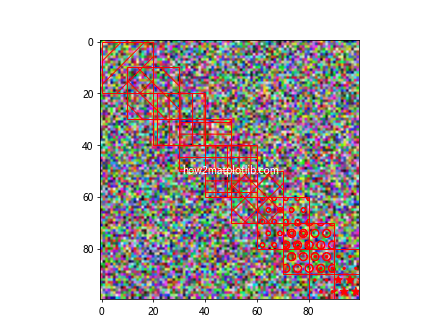
In this example, we demonstrate various hatching patterns that can be used to fill rectangles.
Handling Edge Cases When Drawing Rectangles on Images in Matplotlib
When working with how to draw rectangle on image in Matplotlib, it’s important to consider various edge cases that might arise. Let’s explore some of these scenarios and how to handle them.
Handling Rectangles Outside Image Boundaries
Sometimes, you might need to draw rectangles that extend beyond the boundaries of your image. Matplotlib allows you to do this, but it’s important to handle it properly to avoid confusion.
Here’s an example of how to handle rectangles that extend beyond image boundaries:
import matplotlib.pyplot as plt
import numpy as np
from matplotlib.patches import Rectangle

# Create a sample image
image = np.random.rand(100, 100, 3)

fig, ax = plt.subplots()
ax.imshow(image)

# Draw a rectangle that extends beyond image boundaries
rect = Rectangle((80, 80), 40, 40, fill=False, edgecolor='red', linewidth=2)
ax.add_patch(rect)

# Set the axis limits to show the full rectangle
ax.set_xlim(0, 120)
ax.set_ylim(120, 0)  # Reverse y-axis to maintain image orientation

ax.text(50, 50, 'how2matplotlib.com', ha='center', va='center', color='white')
plt.show()
Output:
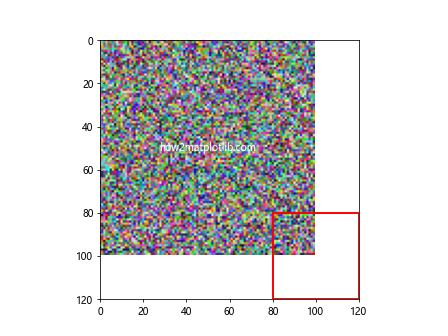
In this example, we draw a rectangle that extends beyond the image boundaries and adjust the axis limits to show the full rectangle.
Handling Very Small or Very Large Rectangles
Drawing very small or very large rectangles can sometimes lead to visualization issues. It’s important to handle these cases to ensure your visualizations remain clear and informative.
Here’s an example of how to handle very small and very large rectangles:
import matplotlib.pyplot as plt
import numpy as np
from matplotlib.patches import Rectangle

# Create a sample image
image = np.random.rand(100, 100, 3)

fig, ax = plt.subplots()
ax.imshow(image)

# Draw a very small rectangle
small_rect = Rectangle((45, 45), 1, 1, fill=True, facecolor='red')
ax.add_patch(small_rect)

# Draw a very large rectangle
large_rect = Rectangle((0, 0), 100, 100, fill=False, edgecolor='blue', linewidth=2)
ax.add_patch(large_rect)

# Add annotations
ax.annotate('Small Rectangle', (45, 45), xytext=(50, 50),
            arrowprops=dict(facecolor='black', shrink=0.05))
ax.text(50, 5, 'Large Rectangle', color='blue', fontweight='bold')

ax.text(50, 50, 'how2matplotlib.com', ha='center', va='center', color='white')
plt.show()
Output:
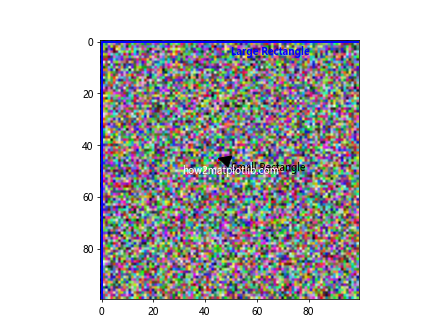
In this example, we draw both a very small rectangle (which we fill for visibility) and a very large rectangle that covers the entire image. We also add annotations to help identify these rectangles.
Best Practices for Drawing Rectangles on Images in Matplotlib
As we near the end of our exploration of how to draw rectangle on image in Matplotlib, let’s discuss some best practices that can help you create more effective and professional-looking visualizations.
Consistent Color Schemes
When drawing multiple rectangles on an image, it’s important to use a consistent color scheme. This helps viewers quickly understand the meaning of different rectangles.
Here’s an example of using a consistent color scheme:
import matplotlib.pyplot as plt
import numpy as np
from matplotlib.patches import Rectangle

# Create a sample image
image = np.random.rand(100, 100, 3)

fig, ax = plt.subplots()
ax.imshow(image)

# Define a color scheme
color_scheme = {
    'object1': 'red',
    'object2': 'blue',
    'object3': 'green'
}

# Draw rectangles with consistent colors
rectangles = [
    ((10, 10), 20, 20, 'object1'),
    ((50, 50), 30, 30, 'object2'),
    ((30, 70), 25, 25, 'object3')
]

for (x, y), w, h, obj_type in rectangles:
    color = color_scheme[obj_type]
    rect = Rectangle((x, y), w, h, fill=False, edgecolor=color, linewidth=2)
    ax.add_patch(rect)
    ax.text(x, y-5, obj_type, color=color, fontweight='bold')

ax.text(50, 50, 'how2matplotlib.com', ha='center', va='center', color='white')
plt.show()
Output:
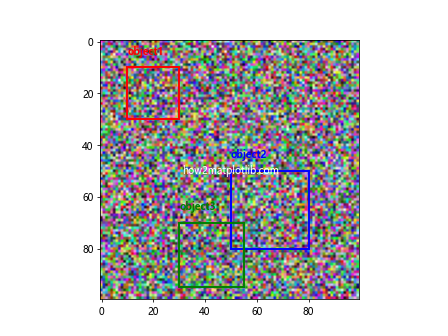
In this example, we define a color scheme and consistently apply it to different types of objects.
Using Legends
When you have multiple types of rectangles in your visualization, it can be helpful to include a legend to explain what each type represents.
Here’s an example of how to add a legend to your visualization:
import matplotlib.pyplot as plt
import numpy as np
from matplotlib.patches import Rectangle, Patch

# Create a sample image
image = np.random.rand(100, 100, 3)

fig, ax = plt.subplots()
ax.imshow(image)

# Define rectangle types and colors
rect_types = {
    'Type A': 'red',
    'Type B': 'blue',
    'Type C': 'green'
}

# Draw rectangles
for i, (rect_type, color) in enumerate(rect_types.items()):
    rect = Rectangle((10 + i*30, 10 + i*30), 20, 20, fill=False, edgecolor=color, linewidth=2)
    ax.add_patch(rect)

# Create legend
legend_elements = [Patch(facecolor='none', edgecolor=color, label=rect_type)
                   for rect_type, color in rect_types.items()]
ax.legend(handles=legend_elements, loc='upper right')

ax.text(50, 50, 'how2matplotlib.com', ha='center', va='center', color='white')
plt.show()
Output:
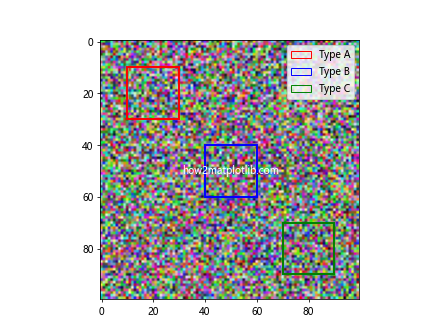
In this example, we create a legend that explains the meaning of different rectangle colors.
Proper Scaling and Positioning
When drawing rectangles on images, it’s important to consider the scaling and positioning of your rectangles relative to the image size.
Here’s an example of how to properly scale and position rectangles:
import matplotlib.pyplot as plt
import numpy as np
from matplotlib.patches import Rectangle

# Create a sample image
image = np.random.rand(100, 100, 3)

fig, ax = plt.subplots()
ax.imshow(image)

# Get image dimensions
height, width = image.shape[:2]

# Define rectangles in relative coordinates
rectangles = [
    (0.1, 0.1, 0.2, 0.2),  # (x, y, width, height) in relative coordinates
    (0.5, 0.5, 0.3, 0.3),
    (0.7, 0.2, 0.2, 0.4)
]

for x, y, w, h in rectangles:
    rect = Rectangle((x*width, y*height), w*width, h*height,
                     fill=False, edgecolor='red', linewidth=2)
    ax.add_patch(rect)

ax.text(50, 50, 'how2matplotlib.com', ha='center', va='center', color='white')
plt.show()
Output:
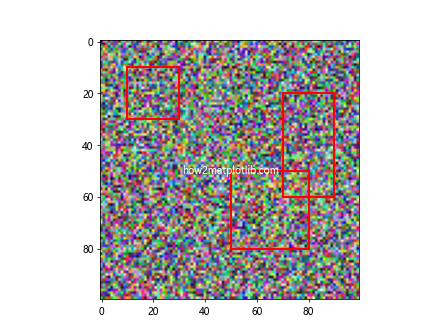
In this example, we define rectangles using relative coordinates (0-1 range) and then scale them to the actual image dimensions when drawing.
Conclusion
In this comprehensive guide, we’ve explored in depth how to draw rectangle on image in Matplotlib. We’ve covered everything from basic rectangle drawing to advanced customization techniques, handling edge cases, and best practices for creating effective visualizations.
Remember, the key to mastering how to draw rectangle on image in Matplotlib is practice and experimentation. Don’t be afraid to try out different techniques and combinations to find what works best for your specific visualization needs.
Whether you’re working on data visualization, image processing, or computer vision tasks, the ability to draw rectangles on images is a valuable skill that can greatly enhance your visualizations and make your data more interpretable.