How to Create a Table with Matplotlib
How to Create a Table with Matplotlib is an essential skill for data visualization enthusiasts and professionals alike. Matplotlib, a powerful plotting library for Python, offers various ways to create tables alongside plots or as standalone visualizations. In this comprehensive guide, we’ll explore different methods and techniques to create tables using Matplotlib, providing you with the knowledge and tools to effectively present your data in tabular format.
Understanding the Basics of Creating Tables with Matplotlib
Before diving into the specifics of how to create a table with Matplotlib, it’s important to understand the fundamental concepts and components involved. Matplotlib provides a Table class that allows you to add tables to your plots or create standalone table visualizations. The Table class is part of the matplotlib.table module and offers a flexible way to represent tabular data.
To get started with creating tables in Matplotlib, you’ll need to import the necessary modules:
import matplotlib.pyplot as plt
import numpy as np

# Create a figure and axis
fig, ax = plt.subplots()

# Your table creation code will go here

plt.show()
Output:
This basic setup will be the foundation for most of the examples we’ll explore in this guide on how to create a table with Matplotlib.
Creating a Simple Table with Matplotlib
Let’s begin with a simple example of how to create a table with Matplotlib. We’ll create a basic table with some sample data:
import matplotlib.pyplot as plt

data = [
    ['Product', 'Sales', 'Revenue'],
    ['Widget A', 100, '$1000'],
    ['Widget B', 80, '$800'],
    ['Widget C', 120, '$1200']
]

fig, ax = plt.subplots()
table = ax.table(cellText=data, loc='center')
ax.axis('off')
plt.title('How to Create a Table with Matplotlib - Sales Report')
plt.show()
Output:
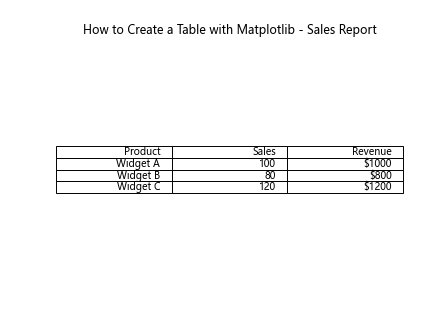
In this example, we create a list of lists containing our data. The ax.table() function is used to create the table, with cellText parameter specifying the data to be displayed. The loc parameter sets the table’s position within the plot. We turn off the axis using ax.axis('off') to focus solely on the table.
Adding a Table to an Existing Plot
One of the powerful features of Matplotlib is the ability to combine tables with other plot types. Here’s an example of how to create a table with Matplotlib alongside a bar plot:
import matplotlib.pyplot as plt
import numpy as np

# Data for the plot and table
categories = ['A', 'B', 'C', 'D']
values = [15, 30, 45, 10]

# Create the bar plot
fig, ax = plt.subplots(figsize=(10, 6))
ax.bar(categories, values)

# Create the table data
table_data = [
    ['Category', 'Value'],
    *zip(categories, values)
]

# Add the table below the plot
table = ax.table(cellText=table_data, loc='bottom', cellLoc='center', colWidths=[0.1, 0.1])

# Adjust the layout
plt.subplots_adjust(bottom=0.2)

plt.title('How to Create a Table with Matplotlib - Bar Plot with Table')
plt.ylabel('Value')
plt.show()
Output:
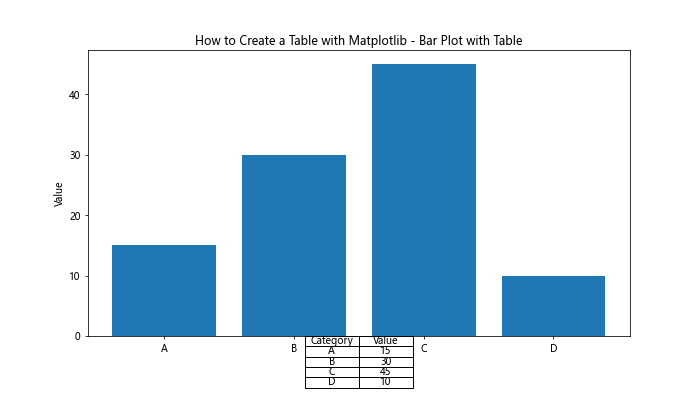
This example demonstrates how to create a bar plot and add a table below it, providing a comprehensive view of the data in both graphical and tabular formats.
Using pandas DataFrames with Matplotlib Tables
When working with tabular data, it’s common to use pandas DataFrames. Matplotlib can easily work with pandas to create tables. Here’s an example of how to create a table with Matplotlib using a pandas DataFrame:
import matplotlib.pyplot as plt
import pandas as pd

# Create a sample DataFrame
df = pd.DataFrame({
    'Name': ['Alice', 'Bob', 'Charlie', 'David'],
    'Age': [25, 30, 35, 28],
    'City': ['New York', 'London', 'Paris', 'Tokyo']
})

fig, ax = plt.subplots(figsize=(8, 4))

# Create the table from the DataFrame
table = ax.table(cellText=df.values, colLabels=df.columns, loc='center', cellLoc='center')

# Customize the table
table.auto_set_font_size(False)
table.set_fontsize(10)
table.scale(1.2, 1.2)

ax.axis('off')
plt.title('How to Create a Table with Matplotlib - pandas DataFrame Table')
plt.show()
Output:
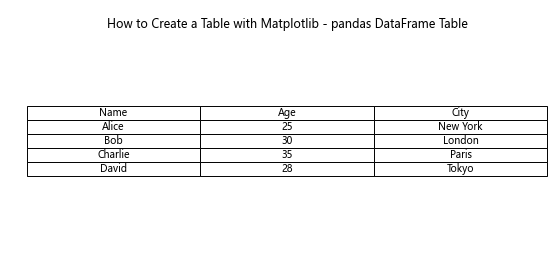
This example demonstrates how to create a table directly from a pandas DataFrame, including column headers and data.
Adding Color-coded Cells
Color-coding cells can help emphasize certain data points or categories. Here’s an example of how to create a table with Matplotlib that includes color-coded cells:
import matplotlib.pyplot as plt
import numpy as np

data = np.random.randint(0, 100, size=(5, 5))
row_labels = ['Row ' + str(i) for i in range(1, 6)]
col_labels = ['Col ' + str(i) for i in range(1, 6)]

fig, ax = plt.subplots(figsize=(10, 6))

table = ax.table(cellText=data, rowLabels=row_labels, colLabels=col_labels, loc='center', cellLoc='center')

# Color-code cells based on value
for i in range(5):
    for j in range(5):
        cell = table[i+1, j]
        if data[i, j] < 30:
            cell.set_facecolor('#ffcccc')
        elif data[i, j] > 70:
            cell.set_facecolor('#ccffcc')

table.auto_set_font_size(False)
table.set_fontsize(10)
table.scale(1.2, 1.2)

ax.axis('off')
plt.title('How to Create a Table with Matplotlib - Color-coded Cells')
plt.show()
Output:
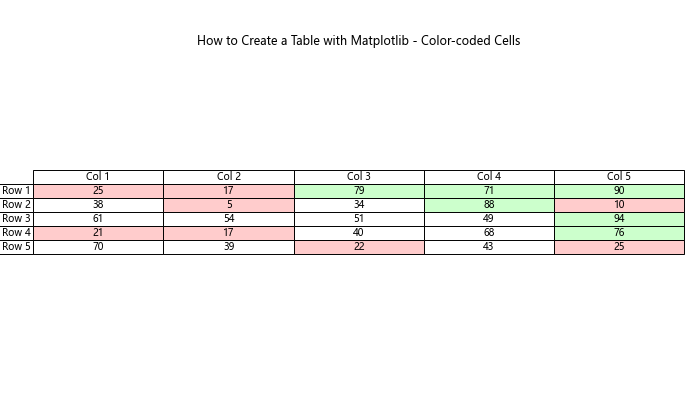
In this example, we color-code cells based on their values: red for low values and green for high values.
Creating a Table with Merged Cells
Matplotlib allows you to merge cells in your table, which can be useful for creating headers or grouping related data. Here’s an example of how to create a table with Matplotlib that includes merged cells:
import matplotlib.pyplot as plt

data = [
    ['', 'Sales', 'Sales', 'Profit', 'Profit'],
    ['Product', 'Q1', 'Q2', 'Q1', 'Q2'],
    ['A', 100, 120, 20, 25],
    ['B', 90, 100, 18, 20],
    ['C', 80, 85, 15, 18]
]

fig, ax = plt.subplots(figsize=(10, 6))

table = ax.table(cellText=data[1:], loc='center', cellLoc='center')

# Merge cells for the header
table.add_cell(0, 0, width=1, height=2, text='Product')
table.add_cell(0, 1, width=2, height=1, text='Sales')
table.add_cell(0, 3, width=2, height=1, text='Profit')

# Customize the table
table.auto_set_font_size(False)
table.set_fontsize(10)
table.scale(1.2, 1.2)

ax.axis('off')
plt.title('How to Create a Table with Matplotlib - Merged Cells')
plt.show()
Output:
This example demonstrates how to create a table with merged cells in the header, allowing for more complex table structures.
Adding Images to Table Cells
Matplotlib also allows you to add images to table cells, which can be useful for creating visual indicators or icons. Here’s an example of how to create a table with Matplotlib that includes images in cells:
import matplotlib.pyplot as plt
import numpy as np

# Create sample data
data = [
    ['Product', 'Sales', 'Trend'],
    ['A', 100, '↑'],
    ['B', 80, '↓'],
    ['C', 120, '↑']
]

fig, ax = plt.subplots(figsize=(8, 4))

table = ax.table(cellText=data, loc='center', cellLoc='center')

# Add images to the trend column
for i in range(1, len(data)):
    cell = table[i, 2]
    if data[i][2] == '↑':
        cell.set_facecolor('#ccffcc')
    else:
        cell.set_facecolor('#ffcccc')

table.auto_set_font_size(False)
table.set_fontsize(12)
table.scale(1.2, 1.2)

ax.axis('off')
plt.title('How to Create a Table with Matplotlib - Cells with Visual Indicators')
plt.show()
Output:
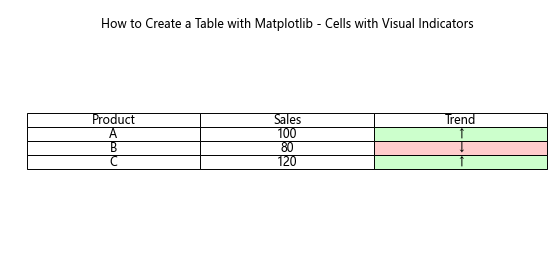
In this example, we use colored cells and arrow symbols to represent trends, but you could also use actual images if desired.
Creating a Standalone Table
While tables are often used alongside plots, you can also create standalone tables with Matplotlib. Here’s an example of how to create a table with Matplotlib as a standalone visualization:
import matplotlib.pyplot as plt

data = [
    ['Name', 'Age', 'Occupation'],
    ['Alice', 28, 'Engineer'],
    ['Bob', 35, 'Designer'],
    ['Charlie', 42, 'Manager'],
    ['David', 31, 'Developer']
]

fig, ax = plt.subplots(figsize=(8, 4))

table = ax.table(cellText=data, loc='center', cellLoc='center')

# Customize the table
table.auto_set_font_size(False)
table.set_fontsize(12)
table.scale(1.5, 1.5)

# Remove axes
ax.axis('off')

plt.title('How to Create a Table with Matplotlib - Standalone Table')
plt.tight_layout()
plt.show()
Output:
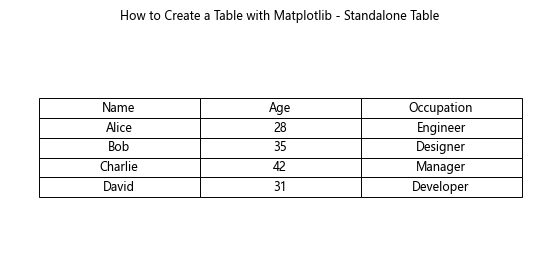
This example creates a standalone table without any accompanying plot, which can be useful for presenting data in a clear, tabular format.
Adding a Table to a Subplot
When working with multiple plots, you might want to add a table to one of the subplots. Here’s an example of how to create a table with Matplotlib in a subplot arrangement:
import matplotlib.pyplot as plt
import numpy as np

# Create sample data
x = np.linspace(0, 10, 100)
y1 = np.sin(x)
y2 = np.cos(x)

data = [
    ['Function', 'Min', 'Max'],
    ['sin(x)', f'{y1.min():.2f}', f'{y1.max():.2f}'],
    ['cos(x)', f'{y2.min():.2f}', f'{y2.max():.2f}']
]

fig, (ax1, ax2) = plt.subplots(2, 1, figsize=(10, 8))

# Plot the functions
ax1.plot(x, y1, label='sin(x)')
ax1.plot(x, y2, label='cos(x)')
ax1.legend()
ax1.set_title('How to Create a Table with Matplotlib - Subplot with Table')

# Create the table in the second subplot
table = ax2.table(cellText=data, loc='center', cellLoc='center')
table.auto_set_font_size(False)
table.set_fontsize(12)
table.scale(1.2, 1.2)
ax2.axis('off')

plt.tight_layout()
plt.show()
Output:
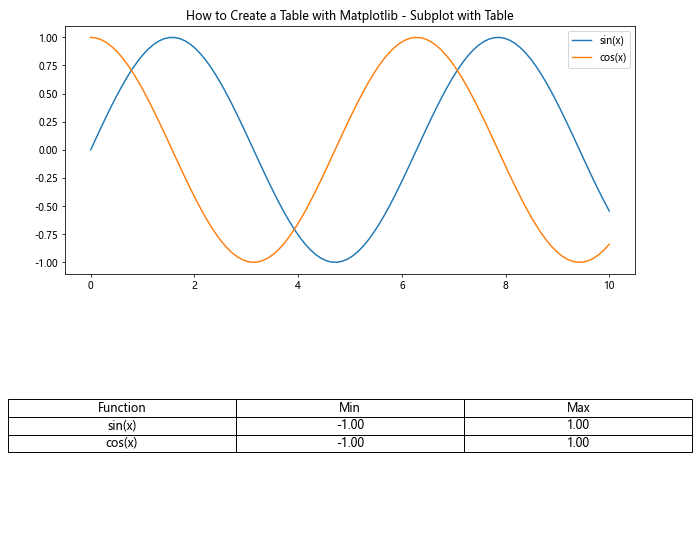
This example demonstrates how to create a plot in one subplot and a table in another, providing a comprehensive view of the data.
Creating a Table with Conditional Formatting
Conditional formatting can help highlight important information in your table. Here’s an example of how to create a table with Matplotlib that includes conditional formatting:
import matplotlib.pyplot as plt
import numpy as np

# Generate sample data
np.random.seed(42)
data = np.random.randint(0, 100, size=(5, 5))
row_labels = ['Row ' + str(i) for i in range(1, 6)]
col_labels = ['Col ' + str(i) for i in range(1, 6)]

fig, ax = plt.subplots(figsize=(10, 6))

table = ax.table(cellText=data, rowLabels=row_labels, colLabels=col_labels, loc='center', cellLoc='center')

# Apply conditional formatting
for i in range(5):
    for j in range(5):
        cell = table[i+1, j]
        if data[i, j] < 30:
            cell.set_facecolor('#ffcccc')
        elif data[i, j] > 70:
            cell.set_facecolor('#ccffcc')
        else:
            cell.set_facecolor('#ffffcc')

table.auto_set_font_size(False)
table.set_fontsize(10)
table.scale(1.2, 1.2)

ax.axis('off')
plt.title('How to Create a Table with Matplotlib - Conditional Formatting')
plt.show()
Output:
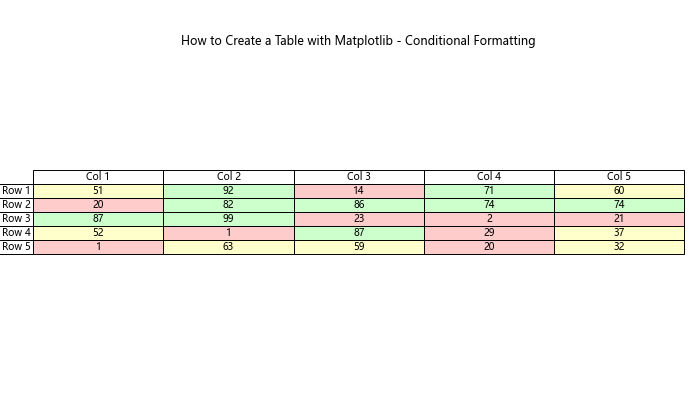
In this example, we apply different background colors to cells based on their values, creating a heat map-like effect that quickly highlights high and low values.
Adding a Table Legend
Sometimes, it’s useful to add a legend to your table to explain color coding or other visual elements. Here’s an example of how to create a table with Matplotlib that includes a legend:
import matplotlib.pyplot as plt
import numpy as np

# Generate sample data
np.random.seed(42)
data = np.random.randint(0, 3, size=(5, 5))
row_labels = ['Row ' + str(i) for i in range(1, 6)]
col_labels = ['Col ' + str(i) for i in range(1, 6)]

fig, ax = plt.subplots(figsize=(12, 8))

table = ax.table(cellText=data, rowLabels=row_labels, colLabels=col_labels, loc='center', cellLoc='center')

# Apply color coding
colors = ['#ffcccc', '#ffffcc', '#ccffcc']
for i in range(5):
    for j in range(5):
        cell = table[i+1, j]
        cell.set_facecolor(colors[data[i, j]])

table.auto_set_font_size(False)
table.set_fontsize(10)
table.scale(1.2, 1.2)

# Add a legend
legend_elements = [plt.Rectangle((0, 0), 1, 1, facecolor=color, edgecolor='none') for color in colors]
ax.legend(legend_elements, ['Low', 'Medium', 'High'], loc='upper right', title='Value Range')

ax.axis('off')
plt.title('How to Create a Table with Matplotlib - Table with Legend')
plt.show()
Output:
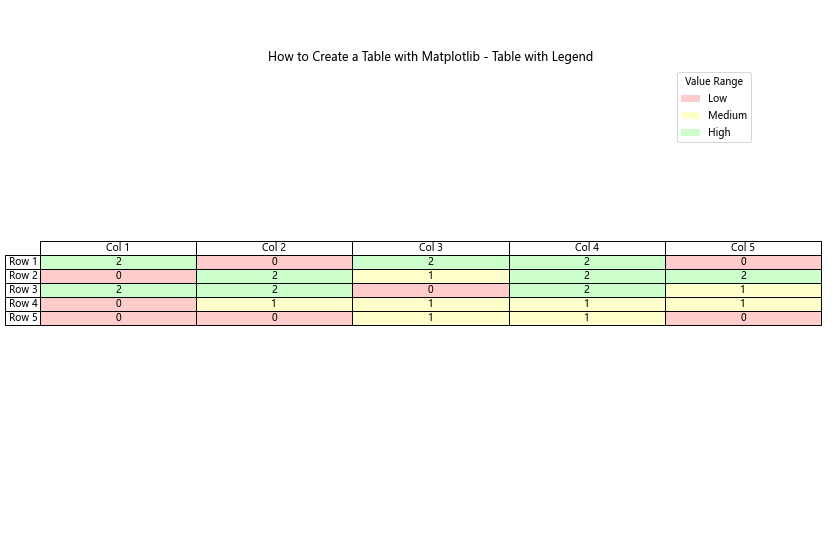
This example demonstrates how to add a legend to explain the color coding used in the table.
Creating a Table with Custom Cell Shapes
While Matplotlib tables typically use rectangular cells, you can get creative and use custom shapes for cells. Here’s an example of how to create a table with Matplotlib that uses circular cells:
import matplotlib.pyplot as plt
import numpy as np

data = np.random.randint(0, 100, size=(4, 4))

fig, ax = plt.subplots(figsize=(10, 10))

for i in range(4):
    for j in range(4):
        circle = plt.Circle((i, j), 0.4, fill=True, facecolor=plt.cm.viridis(data[i, j]/100))
        ax.add_artist(circle)
        ax.text(i, j, str(data[i, j]), ha='center', va='center')

ax.set_xlim(-0.5, 3.5)
ax.set_ylim(-0.5, 3.5)
ax.set_aspect('equal')
ax.axis('off')

plt.title('How to Create a Table with Matplotlib - Custom Cell Shapes')
plt.show()
Output:

This example creates a grid of circular cells, with each cell’s color representing its value.
Animating Table Updates
For dynamic data visualization, you might want to animate your table updates. Here’s a simple example of how to create a table with Matplotlib that updates over time:
import matplotlib.pyplot as plt
import numpy as np
from matplotlib.animation import FuncAnimation

fig, ax = plt.subplots(figsize=(8, 6))
ax.axis('off')

data = np.random.randint(0, 100, size=(5, 5))
table = ax.table(cellText=data, loc='center', cellLoc='center')

def update(frame):
    data = np.random.randint(0, 100, size=(5, 5))
    for i in range(5):
        for j in range(5):
            table[i+1, j].get_text().set_text(str(data[i, j]))
    return table

ani = FuncAnimation(fig, update, frames=50, interval=500, blit=False)

plt.title('How to Create a Table with Matplotlib - Animated Table')
plt.show()
Output:
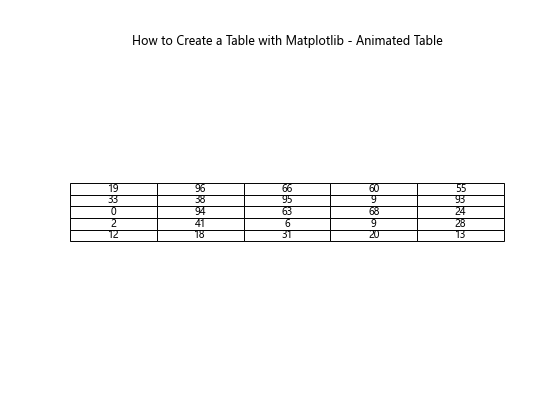
This example creates a table that updates its values randomly every 500 milliseconds.
Conclusion
Learning how to create a table with Matplotlib opens up a world of possibilities for data visualization and presentation. From simple static tables to complex, animated, and interactive visualizations, Matplotlib provides a flexible and powerful toolkit for working with tabular data.
Throughout this guide, we’ve explored various techniques and examples of how to create a table with Matplotlib, including:
- Creating basic tables
- Customizing table appearance
- Adding tables to existing plots
- Creating heatmap-style tables
- Working with pandas DataFrames
- Building multi-column tables
- Adding color-coded cells
- Merging cells for complex layouts
- Including images or visual indicators in cells
- Creating standalone tables
- Incorporating tables in subplots
- Applying conditional formatting
- Adding legends to tables
- Using custom cell shapes
- Animating table updates
By mastering these techniques, you’ll be well-equipped to create informative and visually appealing tables that effectively communicate your data. Remember that the key to creating great tables with Matplotlib is experimentation and practice. Don’t hesitate to combine different techniques or come up with your own creative solutions to present your data in the most effective way possible.