How to Create a Single Legend for All Subplots in Matplotlib
How to Create a Single Legend for All Subplots in Matplotlib is an essential skill for data visualization enthusiasts and professionals alike. This article will delve deep into the intricacies of creating a unified legend for multiple subplots using Matplotlib, one of the most popular plotting libraries in Python. We’ll explore various techniques, best practices, and provide numerous examples to help you master this crucial aspect of data visualization.
Understanding the Importance of a Single Legend for All Subplots
Before we dive into the specifics of how to create a single legend for all subplots in Matplotlib, it’s crucial to understand why this technique is so valuable. When working with multiple subplots, having separate legends for each can clutter the visualization and make it difficult for viewers to interpret the data. By creating a single legend for all subplots, we can:
- Improve the overall clarity of the visualization
- Save space on the figure
- Provide a unified reference point for all subplots
- Enhance the professional appearance of the plot
Now that we understand the importance, let’s explore how to create a single legend for all subplots in Matplotlib.
Basic Setup for Creating Subplots in Matplotlib
To begin our journey of learning how to create a single legend for all subplots in Matplotlib, we first need to understand how to create subplots. Let’s start with a basic example:
import matplotlib.pyplot as plt
import numpy as np

# Create sample data
x = np.linspace(0, 10, 100)
y1 = np.sin(x)
y2 = np.cos(x)

# Create subplots
fig, (ax1, ax2) = plt.subplots(1, 2, figsize=(10, 4))

# Plot data on subplots
ax1.plot(x, y1, label='Sine')
ax2.plot(x, y2, label='Cosine')

# Add individual legends
ax1.legend()
ax2.legend()

plt.suptitle('How to Create a Single Legend for All Subplots in Matplotlib - Basic Setup')
plt.tight_layout()
plt.show()
Output:
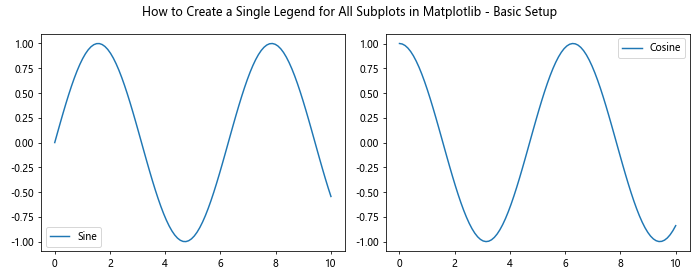
In this example, we’ve created two subplots side by side, each with its own legend. However, our goal is to create a single legend for all subplots in Matplotlib, so let’s explore how to achieve that.
Method 1: Using fig.legend() to Create a Single Legend for All Subplots
One of the simplest ways to create a single legend for all subplots in Matplotlib is by using the fig.legend() method. This approach allows us to create a legend that applies to the entire figure, rather than individual axes. Here’s an example:
import matplotlib.pyplot as plt
import numpy as np

# Create sample data
x = np.linspace(0, 10, 100)
y1 = np.sin(x)
y2 = np.cos(x)

# Create subplots
fig, (ax1, ax2) = plt.subplots(1, 2, figsize=(12, 4))

# Plot data on subplots
line1, = ax1.plot(x, y1, label='Sine')
line2, = ax2.plot(x, y2, label='Cosine')

# Create a single legend for all subplots
fig.legend(handles=[line1, line2], loc='upper center', bbox_to_anchor=(0.5, -0.05), ncol=2)

plt.suptitle('How to Create a Single Legend for All Subplots in Matplotlib - Method 1')
plt.tight_layout()
plt.show()
Output:
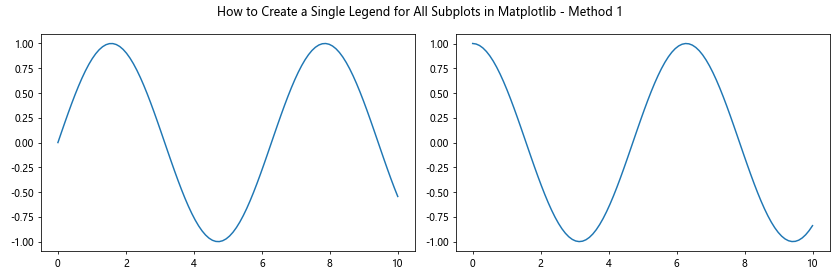
In this example, we’ve used fig.legend() to create a single legend for both subplots. The handles parameter is used to specify which lines should be included in the legend, and we’ve positioned the legend below the subplots using the loc and bbox_to_anchor parameters.
Method 2: Collecting Handles and Labels from All Subplots
Another approach to create a single legend for all subplots in Matplotlib is to collect the handles and labels from all subplots and then create a unified legend. This method is particularly useful when you have multiple lines or elements in each subplot. Here’s an example:
import matplotlib.pyplot as plt
import numpy as np

# Create sample data
x = np.linspace(0, 10, 100)
y1 = np.sin(x)
y2 = np.cos(x)
y3 = np.tan(x)

# Create subplots
fig, (ax1, ax2) = plt.subplots(1, 2, figsize=(12, 4))

# Plot data on subplots
ax1.plot(x, y1, label='Sine')
ax1.plot(x, y2, label='Cosine')
ax2.plot(x, y3, label='Tangent')

# Collect handles and labels from all subplots
handles, labels = [], []
for ax in fig.axes:
    for h, l in zip(*ax.get_legend_handles_labels()):
        handles.append(h)
        labels.append(l)

# Create a single legend for all subplots
fig.legend(handles, labels, loc='upper center', bbox_to_anchor=(0.5, -0.05), ncol=3)

plt.suptitle('How to Create a Single Legend for All Subplots in Matplotlib - Method 2')
plt.tight_layout()
plt.show()
Output:
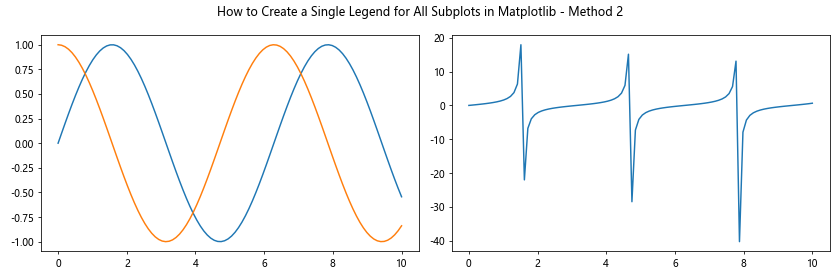
This method allows us to create a single legend for all subplots in Matplotlib, even when the subplots contain different numbers of elements or lines.
Customizing the Single Legend for All Subplots
Now that we know how to create a single legend for all subplots in Matplotlib, let’s explore some ways to customize it to better suit our visualization needs.
Adjusting Legend Position
One important aspect of creating a single legend for all subplots in Matplotlib is positioning it correctly. Here’s an example of how to adjust the legend position:
import matplotlib.pyplot as plt
import numpy as np

# Create sample data
x = np.linspace(0, 10, 100)
y1 = np.sin(x)
y2 = np.cos(x)

# Create subplots
fig, (ax1, ax2) = plt.subplots(1, 2, figsize=(12, 4))

# Plot data on subplots
line1, = ax1.plot(x, y1, label='Sine')
line2, = ax2.plot(x, y2, label='Cosine')

# Create a single legend for all subplots with custom position
fig.legend(handles=[line1, line2], loc='upper right', bbox_to_anchor=(1.1, 1), title='How2Matplotlib.com')

plt.suptitle('How to Create a Single Legend for All Subplots in Matplotlib - Custom Position')
plt.tight_layout()
plt.show()
Output:
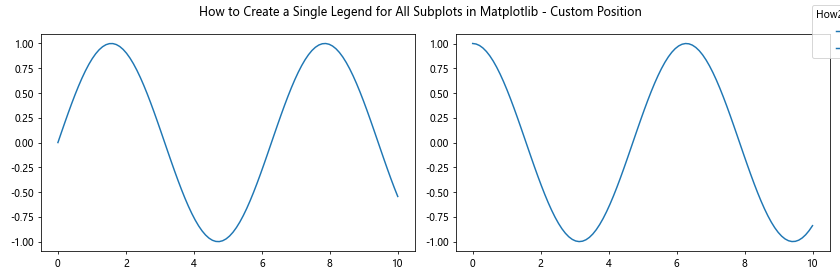
In this example, we’ve positioned the legend to the right of the subplots using the loc and bbox_to_anchor parameters.
Styling the Legend
To make our single legend for all subplots in Matplotlib more visually appealing, we can apply various styling options. Here’s an example:
import matplotlib.pyplot as plt
import numpy as np

# Create sample data
x = np.linspace(0, 10, 100)
y1 = np.sin(x)
y2 = np.cos(x)

# Create subplots
fig, (ax1, ax2) = plt.subplots(1, 2, figsize=(12, 4))

# Plot data on subplots
line1, = ax1.plot(x, y1, label='Sine')
line2, = ax2.plot(x, y2, label='Cosine')

# Create a styled single legend for all subplots
fig.legend(handles=[line1, line2], loc='upper center', bbox_to_anchor=(0.5, -0.05), ncol=2,
           title='How2Matplotlib.com', title_fontsize='large', frameon=True, fancybox=True, shadow=True)

plt.suptitle('How to Create a Single Legend for All Subplots in Matplotlib - Styled Legend')
plt.tight_layout()
plt.show()
Output:
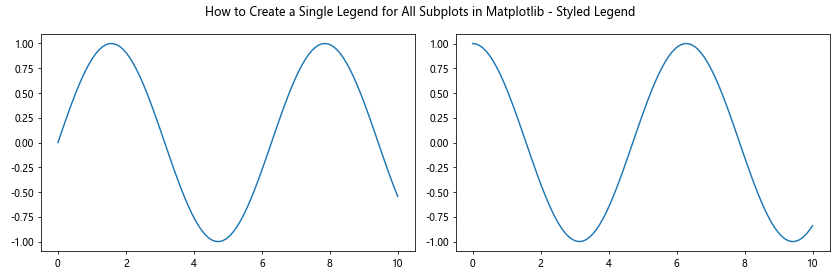
This example demonstrates how to add a title to the legend, adjust font sizes, and add visual elements like a frame and shadow.
Handling Multiple Data Series in Subplots
When creating a single legend for all subplots in Matplotlib, you may encounter situations where you have multiple data series in each subplot. Here’s how to handle this scenario:
import matplotlib.pyplot as plt
import numpy as np

# Create sample data
x = np.linspace(0, 10, 100)
y1 = np.sin(x)
y2 = np.cos(x)
y3 = np.tan(x)
y4 = np.exp(-x/10)

# Create subplots
fig, (ax1, ax2) = plt.subplots(1, 2, figsize=(12, 4))

# Plot data on subplots
line1, = ax1.plot(x, y1, label='Sine')
line2, = ax1.plot(x, y2, label='Cosine')
line3, = ax2.plot(x, y3, label='Tangent')
line4, = ax2.plot(x, y4, label='Exponential')

# Create a single legend for all subplots
fig.legend(handles=[line1, line2, line3, line4], loc='upper center', bbox_to_anchor=(0.5, -0.05), ncol=4)

plt.suptitle('How to Create a Single Legend for All Subplots in Matplotlib - Multiple Series')
plt.tight_layout()
plt.show()
Output:
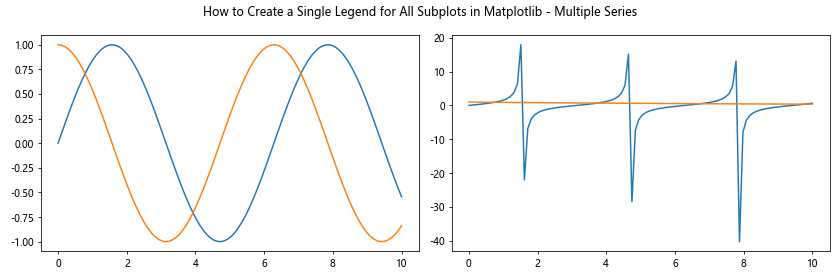
This example shows how to create a single legend for all subplots in Matplotlib when each subplot contains multiple data series.
Creating a Single Legend for Subplots with Different Plot Types
Another challenge you might face when creating a single legend for all subplots in Matplotlib is dealing with different plot types. Here’s an example of how to handle this:
import matplotlib.pyplot as plt
import numpy as np

# Create sample data
x = np.linspace(0, 10, 100)
y1 = np.sin(x)
y2 = np.random.normal(0, 1, 100)

# Create subplots
fig, (ax1, ax2) = plt.subplots(1, 2, figsize=(12, 4))

# Plot data on subplots
line1, = ax1.plot(x, y1, label='Sine')
bars = ax2.bar(x[::10], y2[::10], label='Random Data')

# Create a single legend for all subplots
fig.legend(handles=[line1, bars], loc='upper center', bbox_to_anchor=(0.5, -0.05), ncol=2)

plt.suptitle('How to Create a Single Legend for All Subplots in Matplotlib - Different Plot Types')
plt.tight_layout()
plt.show()
Output:
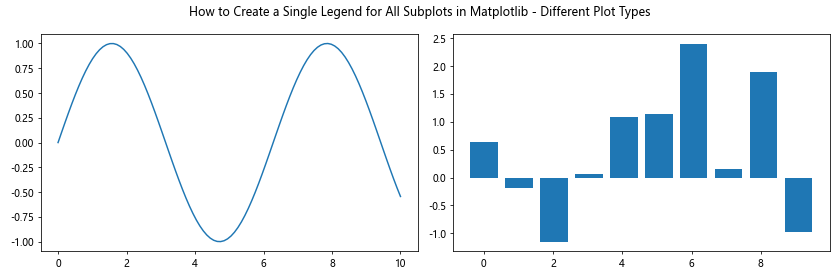
This example demonstrates how to create a single legend for all subplots in Matplotlib when dealing with different plot types, such as line plots and bar plots.
Handling Subplots with Shared Axes
When creating a single legend for all subplots in Matplotlib, you may encounter situations where subplots share axes. Here’s how to handle this scenario:
import matplotlib.pyplot as plt
import numpy as np

# Create sample data
x = np.linspace(0, 10, 100)
y1 = np.sin(x)
y2 = np.cos(x)

# Create subplots with shared x-axis
fig, (ax1, ax2) = plt.subplots(2, 1, figsize=(8, 6), sharex=True)

# Plot data on subplots
line1, = ax1.plot(x, y1, label='Sine')
line2, = ax2.plot(x, y2, label='Cosine')

# Remove x-axis label from the top subplot
ax1.set_xlabel('')

# Create a single legend for all subplots
fig.legend(handles=[line1, line2], loc='upper right', bbox_to_anchor=(1, 0.95))

plt.suptitle('How to Create a Single Legend for All Subplots in Matplotlib - Shared Axes')
plt.tight_layout()
plt.show()
Output:
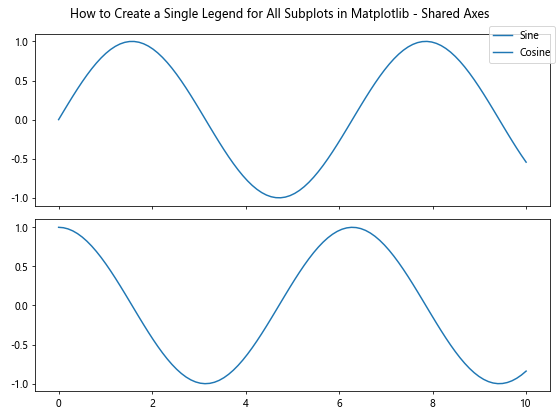
This example shows how to create a single legend for all subplots in Matplotlib when dealing with subplots that share axes.
Creating a Single Legend for Subplots with Different Scales
When creating a single legend for all subplots in Matplotlib, you might need to handle subplots with different scales. Here’s an example of how to approach this:
import matplotlib.pyplot as plt
import numpy as np

# Create sample data
x = np.linspace(0, 10, 100)
y1 = np.sin(x)
y2 = 1000 * np.cos(x)

# Create subplots
fig, (ax1, ax2) = plt.subplots(1, 2, figsize=(12, 4))

# Plot data on subplots
line1, = ax1.plot(x, y1, label='Sine')
line2, = ax2.plot(x, y2, label='Cosine (scaled)')

# Set different y-axis scales
ax1.set_ylim(-1.5, 1.5)
ax2.set_ylim(-1500, 1500)

# Create a single legend for all subplots
fig.legend(handles=[line1, line2], loc='upper center', bbox_to_anchor=(0.5, -0.05), ncol=2)

plt.suptitle('How to Create a Single Legend for All Subplots in Matplotlib - Different Scales')
plt.tight_layout()
plt.show()
Output:
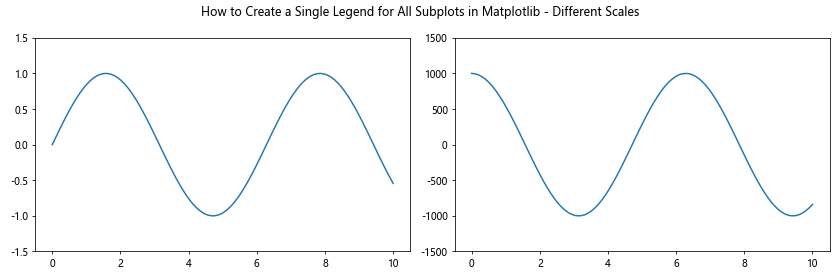
This example demonstrates how to create a single legend for all subplots in Matplotlib when dealing with subplots that have different scales.
Handling Subplots with Different Numbers of Data Series
When creating a single legend for all subplots in Matplotlib, you may encounter situations where subplots have different numbers of data series. Here’s how to handle this scenario:
import matplotlib.pyplot as plt
import numpy as np

# Create sample data
x = np.linspace(0, 10, 100)
y1 = np.sin(x)
y2 = np.cos(x)
y3 = np.tan(x)

# Create subplots
fig, (ax1, ax2) = plt.subplots(1, 2, figsize=(12, 4))

# Plot data on subplots
line1, = ax1.plot(x, y1, label='Sine')
line2, = ax1.plot(x, y2, label='Cosine')
line3, = ax2.plot(x, y3, label='Tangent')

# Create a single legend for all subplots
handles = [line1, line2, line3]
labels = [h.get_label() for h in handles]
fig.legend(handles, labels, loc='upper center', bbox_to_anchor=(0.5, -0.05), ncol=3)

plt.suptitle('How to Create a Single Legend for All Subplots in Matplotlib - Different Numbers of Series')
plt.tight_layout()
plt.show()
Output:
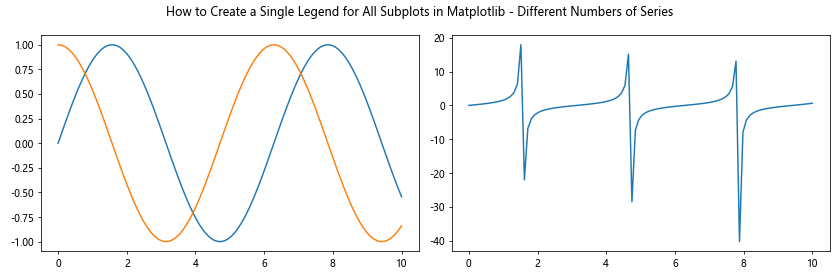
This example shows how to create a single legend for all subplots in Matplotlib when dealing with subplots that have different numbers of data series.
Creating a Single Legend for Subplots with Custom Markers and Colors
When creating a single legend for all subplots in Matplotlib, you might want to use custom markers and colors for different data series. Here’s an example of how to achieve this:
import matplotlib.pyplot as plt
import numpy as np

# Create sample data
x = np.linspace(0, 10, 100)
y1 = np.sin(x)
y2 = np.cos(x)
y3 = np.tan(x)

# Create subplots
fig, (ax1, ax2) = plt.subplots(1, 2, figsize=(12, 4))# Plot data on subplots with custom markers and colors
line1, = ax1.plot(x, y1, 'r-', marker='o', label='Sine')
line2, = ax1.plot(x, y2, 'b--', marker='s', label='Cosine')
line3, = ax2.plot(x, y3, 'g:', marker='^', label='Tangent')

# Create a single legend for all subplots
fig.legend(handles=[line1, line2, line3], loc='upper center', bbox_to_anchor=(0.5, -0.05), ncol=3)

plt.suptitle('How to Create a Single Legend for All Subplots in Matplotlib - Custom Markers and Colors')
plt.tight_layout()
plt.show()
Output:
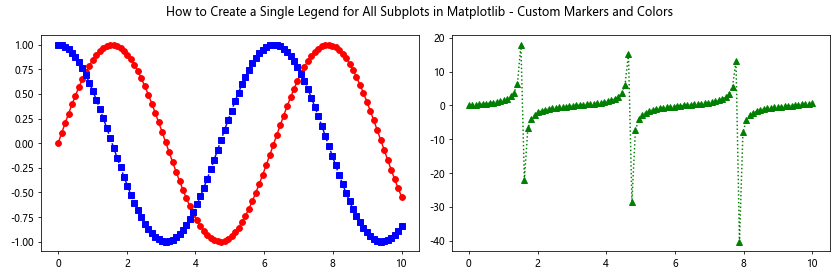
This example demonstrates how to create a single legend for all subplots in Matplotlib while using custom markers and colors for different data series.
Handling Subplots with Different Aspect Ratios
When creating a single legend for all subplots in Matplotlib, you may need to deal with subplots that have different aspect ratios. Here’s how to approach this situation:
import matplotlib.pyplot as plt
import numpy as np

# Create sample data
x = np.linspace(0, 10, 100)
y1 = np.sin(x)
y2 = np.cos(x)

# Create subplots with different aspect ratios
fig = plt.figure(figsize=(12, 6))
ax1 = fig.add_subplot(121, aspect=1)
ax2 = fig.add_subplot(122, aspect=2)

# Plot data on subplots
line1, = ax1.plot(x, y1, label='Sine')
line2, = ax2.plot(x, y2, label='Cosine')

# Create a single legend for all subplots
fig.legend(handles=[line1, line2], loc='upper center', bbox_to_anchor=(0.5, -0.05), ncol=2)

plt.suptitle('How to Create a Single Legend for All Subplots in Matplotlib - Different Aspect Ratios')
plt.tight_layout()
plt.show()
Output:
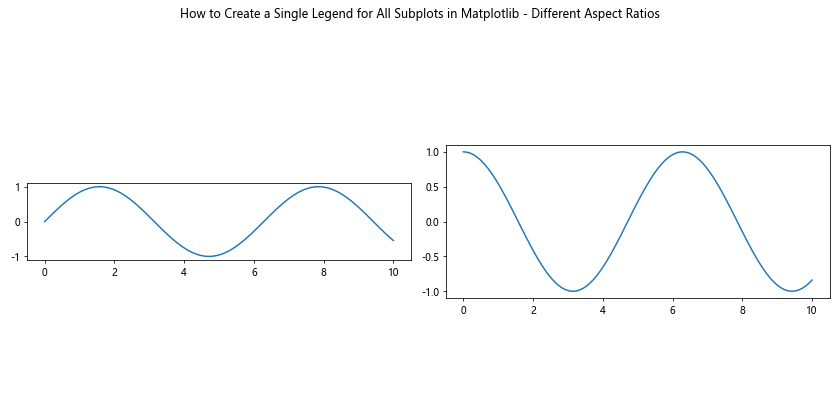
This example shows how to create a single legend for all subplots in Matplotlib when dealing with subplots that have different aspect ratios.
Handling Subplots with Logarithmic Scales
When creating a single legend for all subplots in Matplotlib, you may need to deal with subplots that use logarithmic scales. Here’s how to handle this scenario:
import matplotlib.pyplot as plt
import numpy as np

# Create sample data
x = np.logspace(0, 2, 100)
y1 = np.log10(x)
y2 = np.exp(x)

# Create subplots
fig, (ax1, ax2) = plt.subplots(1, 2, figsize=(12, 4))

# Plot data on subplots with logarithmic scales
line1, = ax1.semilogx(x, y1, label='Log')
line2, = ax2.semilogy(x, y2, label='Exp')

# Create a single legend for all subplots
fig.legend(handles=[line1, line2], loc='upper center', bbox_to_anchor=(0.5, -0.05), ncol=2)

plt.suptitle('How to Create a Single Legend for All Subplots in Matplotlib - Logarithmic Scales')
plt.tight_layout()
plt.show()
Output:
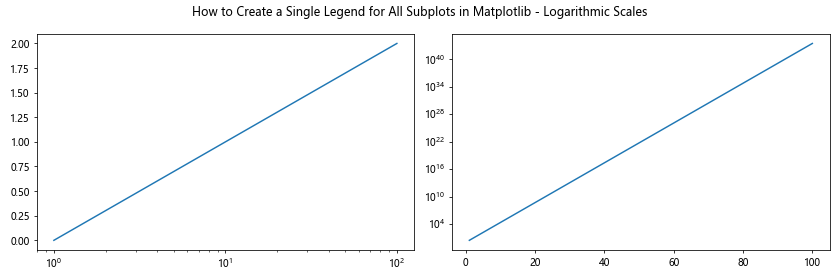
This example shows how to create a single legend for all subplots in Matplotlib when dealing with subplots that use logarithmic scales.
Creating a Single Legend for Subplots with Categorical Data
When creating a single legend for all subplots in Matplotlib, you might need to handle subplots with categorical data. Here’s an example of how to approach this:
import matplotlib.pyplot as plt
import numpy as np

# Create sample data
categories = ['A', 'B', 'C', 'D', 'E']
values1 = [3, 7, 2, 5, 8]
values2 = [5, 2, 6, 3, 4]

# Create subplots
fig, (ax1, ax2) = plt.subplots(1, 2, figsize=(12, 4))

# Plot data on subplots
bars1 = ax1.bar(categories, values1, label='Dataset 1')
bars2 = ax2.bar(categories, values2, label='Dataset 2')

# Create a single legend for all subplots
fig.legend(handles=[bars1, bars2], loc='upper center', bbox_to_anchor=(0.5, -0.05), ncol=2)

plt.suptitle('How to Create a Single Legend for All Subplots in Matplotlib - Categorical Data')
plt.tight_layout()
plt.show()
Output:
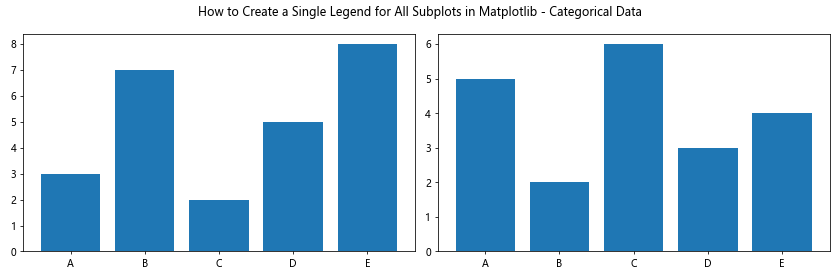
This example demonstrates how to create a single legend for all subplots in Matplotlib when dealing with subplots that contain categorical data.
Best Practices for Creating a Single Legend for All Subplots
When learning how to create a single legend for all subplots in Matplotlib, it’s important to keep in mind some best practices:
- Consistency: Ensure that the legend entries are consistent across all subplots in terms of color, marker style, and line style.
Clarity: Use clear and concise labels for each legend entry to avoid confusion.
Positioning: Choose a legend position that doesn’t obscure important data in the subplots.
Size: Adjust the figure size and subplot layout to accommodate the legend without crowding the visualization.
Readability: Use an appropriate font size and style for the legend text to ensure it’s easily readable.
Color contrast: Ensure that the legend text and background have sufficient contrast for easy visibility.
Grouping: If you have many legend entries, consider grouping them logically or using multiple columns.
Consistency with data: Make sure the legend accurately represents the data shown in the subplots.
By following these best practices, you can create effective and informative legends when learning how to create a single legend for all subplots in Matplotlib.