How to Create Scatterplot with Both Negative and Positive Axes Using Matplotlib
How to create scatterplot with both negative and positive axes is an essential skill for data visualization in Python. Matplotlib, a powerful plotting library, provides various tools and techniques to create scatterplots that span across both negative and positive axes. This comprehensive guide will walk you through the process of creating such scatterplots, offering detailed explanations and practical examples to help you master this visualization technique.
Understanding Scatterplots with Negative and Positive Axes
Before diving into the creation process, it’s crucial to understand what a scatterplot with both negative and positive axes represents. This type of plot allows you to visualize data points that have both positive and negative values on either or both axes. It’s particularly useful when dealing with datasets that include a range of values across zero, such as financial data, temperature variations, or coordinate systems.
To create a scatterplot with both negative and positive axes using Matplotlib, you’ll need to consider several key aspects:
- Setting up the plot area
- Defining the data points
- Customizing the axes
- Adding visual elements to enhance readability
Let’s explore each of these aspects in detail and learn how to create scatterplot with both negative and positive axes effectively.
Setting Up the Plot Area
The first step in creating a scatterplot with both negative and positive axes is to set up the plot area. Matplotlib provides various functions to create and customize the figure and axes objects. Here’s a basic example to get you started:
import matplotlib.pyplot as plt
import numpy as np

# Create a figure and axis object
fig, ax = plt.subplots(figsize=(8, 6))

# Generate some sample data
x = np.linspace(-5, 5, 100)
y = x**2 - 4

# Create the scatterplot
ax.scatter(x, y, label='how2matplotlib.com')

# Set labels and title
ax.set_xlabel('X-axis')
ax.set_ylabel('Y-axis')
ax.set_title('How to Create Scatterplot with Both Negative and Positive Axes')

# Add legend
ax.legend()

# Show the plot
plt.show()
Output:
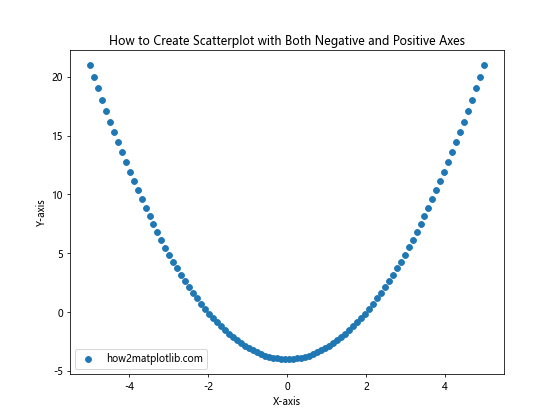
In this example, we create a figure and axis object using plt.subplots(). We then generate sample data using NumPy’s linspace function to create x-values ranging from -5 to 5, and calculate corresponding y-values using a quadratic function. The scatter() function is used to create the actual scatterplot.
Defining Data Points for Negative and Positive Axes
When learning how to create scatterplot with both negative and positive axes, it’s important to understand how to define and manipulate data points that span across both positive and negative values. Let’s look at an example that demonstrates this:
import matplotlib.pyplot as plt
import numpy as np

# Generate data points
np.random.seed(42)
x = np.random.uniform(-10, 10, 100)
y = np.random.uniform(-10, 10, 100)

# Create the scatterplot
fig, ax = plt.subplots(figsize=(8, 8))
ax.scatter(x, y, c='blue', alpha=0.6, label='how2matplotlib.com')

# Set labels and title
ax.set_xlabel('X-axis')
ax.set_ylabel('Y-axis')
ax.set_title('Scatterplot with Both Negative and Positive Axes')

# Add a legend
ax.legend()

# Show the plot
plt.show()
Output:
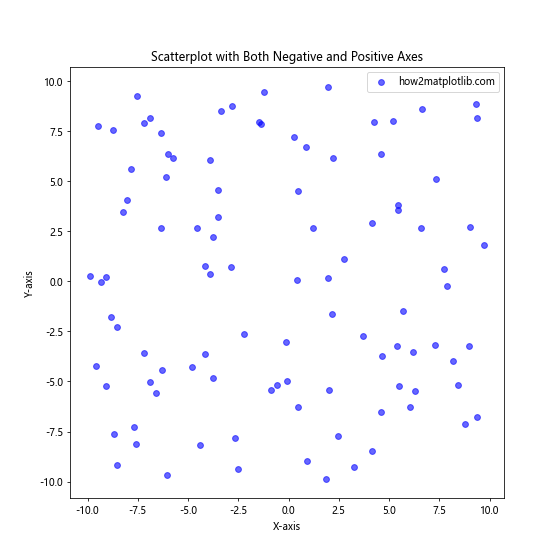
In this example, we use NumPy’s random.uniform() function to generate random data points that span from -10 to 10 on both axes. This ensures that our scatterplot will have points in all four quadrants of the coordinate system.
Customizing Axes for Negative and Positive Values
When creating a scatterplot with both negative and positive axes, it’s often necessary to customize the axes to improve readability and emphasize certain aspects of the data. Matplotlib offers several methods to achieve this. Let’s explore some techniques:
Adding Grid Lines
Grid lines can help viewers better estimate the position of data points. Here’s how to add grid lines to your scatterplot:
import matplotlib.pyplot as plt
import numpy as np

# Generate data
x = np.linspace(-5, 5, 100)
y = x**3

# Create the scatterplot
fig, ax = plt.subplots(figsize=(8, 6))
ax.scatter(x, y, c='red', alpha=0.7, label='how2matplotlib.com')

# Add grid lines
ax.grid(True, linestyle='--', alpha=0.7)

# Set labels and title
ax.set_xlabel('X-axis')
ax.set_ylabel('Y-axis')
ax.set_title('How to Create Scatterplot with Grid Lines')

# Add legend
ax.legend()

# Show the plot
plt.show()
Output:
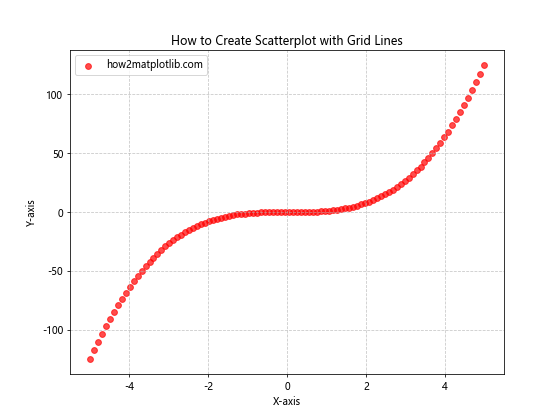
In this example, we use the grid() method to add grid lines to our plot. The linestyle parameter is set to dashed lines, and alpha is used to control the transparency.
Customizing Tick Marks and Labels
To improve the readability of your scatterplot, you may want to customize the tick marks and labels on both axes. Here’s an example:
import matplotlib.pyplot as plt
import numpy as np

# Generate data
x = np.linspace(-10, 10, 100)
y = x**2 - 25

# Create the scatterplot
fig, ax = plt.subplots(figsize=(10, 8))
ax.scatter(x, y, c='green', alpha=0.8, label='how2matplotlib.com')

# Customize tick marks and labels
ax.set_xticks(np.arange(-10, 11, 2))
ax.set_yticks(np.arange(-30, 81, 20))
ax.tick_params(axis='both', which='major', labelsize=10)

# Set labels and title
ax.set_xlabel('X-axis')
ax.set_ylabel('Y-axis')
ax.set_title('How to Create Scatterplot with Custom Tick Marks')

# Add legend
ax.legend()

# Show the plot
plt.show()
Output:
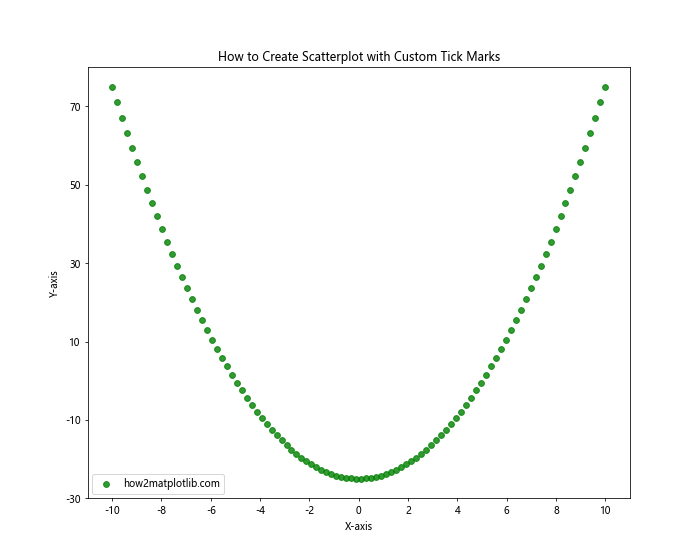
In this example, we use set_xticks() and set_yticks() to specify custom tick locations. The tick_params() method is used to adjust the appearance of the tick labels.
Adding Visual Elements to Enhance Readability
When creating a scatterplot with both negative and positive axes, adding visual elements can greatly enhance the plot’s readability and interpretability. Let’s explore some techniques to achieve this:
Adding a Zero Line
A zero line can help emphasize the transition between positive and negative values. Here’s how to add a zero line to your scatterplot:
import matplotlib.pyplot as plt
import numpy as np

# Generate data
x = np.linspace(-5, 5, 100)
y = x**3 - 2*x

# Create the scatterplot
fig, ax = plt.subplots(figsize=(8, 6))
ax.scatter(x, y, c='purple', alpha=0.7, label='how2matplotlib.com')

# Add zero lines
ax.axhline(y=0, color='k', linestyle='--', linewidth=1)
ax.axvline(x=0, color='k', linestyle='--', linewidth=1)

# Set labels and title
ax.set_xlabel('X-axis')
ax.set_ylabel('Y-axis')
ax.set_title('How to Create Scatterplot with Zero Lines')

# Add legend
ax.legend()

# Show the plot
plt.show()
Output:
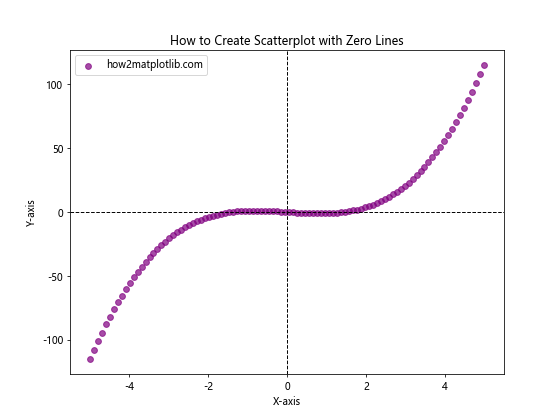
In this example, we use axhline() and axvline() to add horizontal and vertical zero lines, respectively. The color, linestyle, and linewidth parameters are used to customize the appearance of these lines.
Using Color to Distinguish Positive and Negative Values
Color can be an effective way to visually distinguish between positive and negative values in your scatterplot. Here’s an example:
import matplotlib.pyplot as plt
import numpy as np

# Generate data
np.random.seed(42)
x = np.random.uniform(-10, 10, 200)
y = np.random.uniform(-10, 10, 200)

# Create the scatterplot
fig, ax = plt.subplots(figsize=(8, 8))

# Plot points with different colors based on quadrant
ax.scatter(x[np.logical_and(x >= 0, y >= 0)], y[np.logical_and(x >= 0, y >= 0)], c='red', label='Quadrant I')
ax.scatter(x[np.logical_and(x < 0, y >= 0)], y[np.logical_and(x < 0, y >= 0)], c='blue', label='Quadrant II')
ax.scatter(x[np.logical_and(x < 0, y < 0)], y[np.logical_and(x < 0, y < 0)], c='green', label='Quadrant III')
ax.scatter(x[np.logical_and(x >= 0, y < 0)], y[np.logical_and(x >= 0, y < 0)], c='orange', label='Quadrant IV')

# Add zero lines
ax.axhline(y=0, color='k', linestyle='--', linewidth=1)
ax.axvline(x=0, color='k', linestyle='--', linewidth=1)

# Set labels and title
ax.set_xlabel('X-axis')
ax.set_ylabel('Y-axis')
ax.set_title('How to Create Scatterplot with Colored Quadrants')

# Add legend
ax.legend()

# Show the plot
plt.show()
Output:
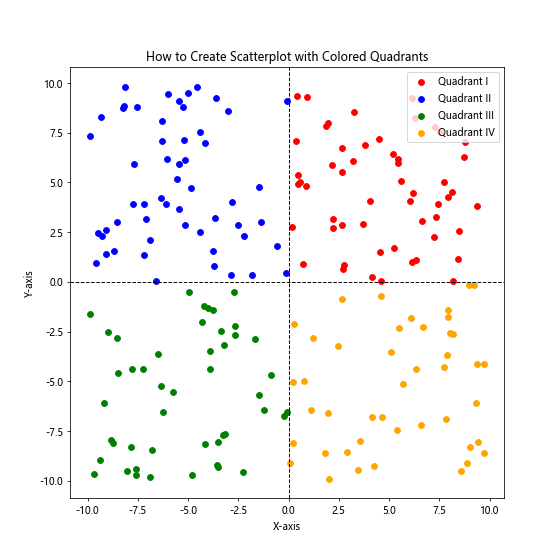
In this example, we use logical indexing to separate the data points into four quadrants and assign different colors to each quadrant. This technique helps to visually distinguish between positive and negative values on both axes.
Advanced Techniques for Scatterplots with Negative and Positive Axes
As you become more proficient in creating scatterplots with both negative and positive axes, you may want to explore more advanced techniques to enhance your visualizations. Let's look at some advanced methods:
Using a Diverging Colormap
A diverging colormap can be an effective way to represent data that spans across positive and negative values. Here's an example:
import matplotlib.pyplot as plt
import numpy as np

# Generate data
x = np.linspace(-5, 5, 100)
y = np.linspace(-5, 5, 100)
X, Y = np.meshgrid(x, y)
Z = X*Y

# Create the scatterplot
fig, ax = plt.subplots(figsize=(10, 8))
scatter = ax.scatter(X, Y, c=Z, cmap='RdYlBu', s=50, alpha=0.8)

# Add a colorbar
cbar = plt.colorbar(scatter)
cbar.set_label('Z-value')

# Set labels and title
ax.set_xlabel('X-axis')
ax.set_ylabel('Y-axis')
ax.set_title('How to Create Scatterplot with Diverging Colormap')

# Add text for how2matplotlib.com
ax.text(0.05, 0.95, 'how2matplotlib.com', transform=ax.transAxes, fontsize=10, va='top')

# Show the plot
plt.show()
Output:
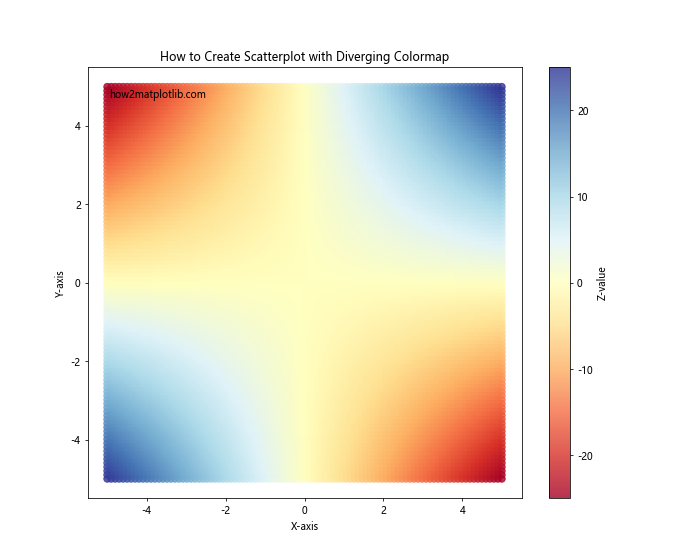
In this example, we use a 2D grid of points and assign colors based on the product of X and Y coordinates. The 'RdYlBu' colormap is used to represent positive and negative values with different colors.
Adding Annotations to Specific Points
Annotations can provide additional context to specific data points in your scatterplot. Here's how to add annotations:
import matplotlib.pyplot as plt
import numpy as np

# Generate data
np.random.seed(42)
x = np.random.uniform(-10, 10, 20)
y = np.random.uniform(-10, 10, 20)

# Create the scatterplot
fig, ax = plt.subplots(figsize=(10, 8))
scatter = ax.scatter(x, y, c=x*y, cmap='viridis', s=100, alpha=0.8)

# Add annotations to specific points
for i, (xi, yi) in enumerate(zip(x, y)):
    if abs(xi*yi) > 50:
        ax.annotate(f'Point {i}', (xi, yi), xytext=(5, 5), textcoords='offset points')

# Add a colorbar
cbar = plt.colorbar(scatter)
cbar.set_label('X*Y value')

# Set labels and title
ax.set_xlabel('X-axis')
ax.set_ylabel('Y-axis')
ax.set_title('How to Create Scatterplot with Annotations')

# Add text for how2matplotlib.com
ax.text(0.05, 0.95, 'how2matplotlib.com', transform=ax.transAxes, fontsize=10, va='top')

# Show the plot
plt.show()
Output:
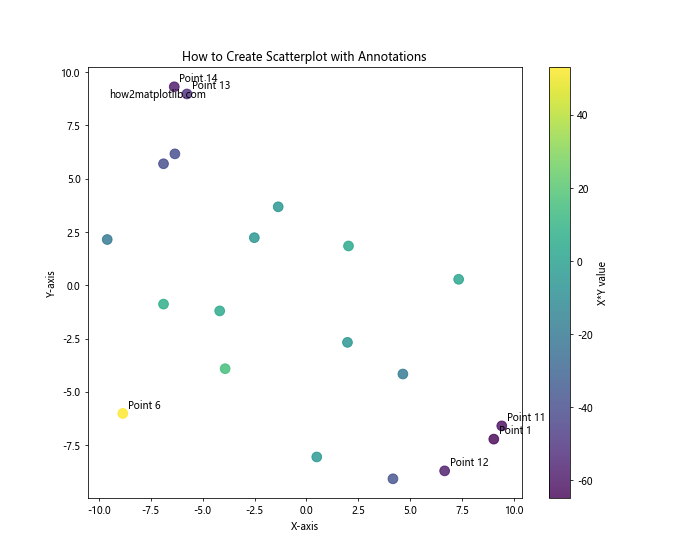
In this example, we add annotations to points where the product of x and y coordinates exceeds a certain threshold. This technique can be useful for highlighting specific data points of interest.
Handling Large Datasets in Scatterplots with Negative and Positive Axes
When dealing with large datasets, creating a scatterplot with both negative and positive axes can become challenging due to overplotting and performance issues. Here are some techniques to handle large datasets effectively:
Using Alpha Blending
Alpha blending can help visualize dense areas in your scatterplot. Here's an example:
import matplotlib.pyplot as plt
import numpy as np

# Generate a large dataset
np.random.seed(42)
x = np.random.normal(0, 5, 10000)
y = np.random.normal(0, 5, 10000)

# Create the scatterplot
fig, ax = plt.subplots(figsize=(10, 8))
ax.scatter(x, y, alpha=0.1, s=5)

# Set labels and title
ax.set_xlabel('X-axis')
ax.set_ylabel('Y-axis')
ax.set_title('How to Create Scatterplot with Alpha Blending for Large Datasets')

# Add text for how2matplotlib.com
ax.text(0.05, 0.95, 'how2matplotlib.com', transform=ax.transAxes, fontsize=10, va='top')

# Show the plot
plt.show()
Output:
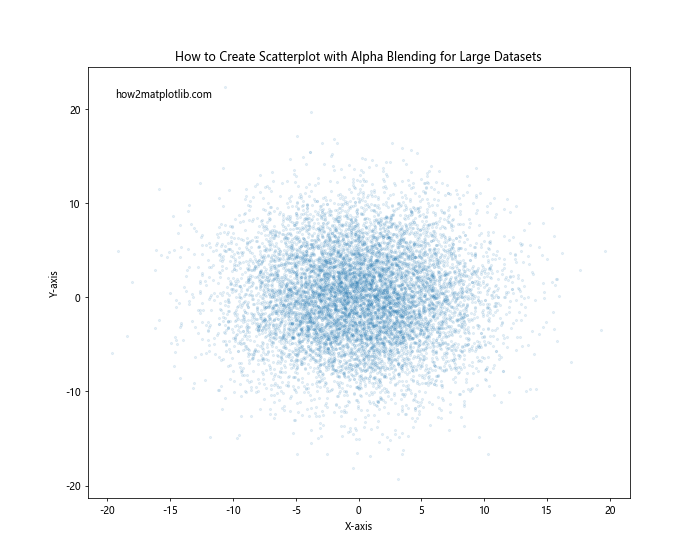
In this example, we use a low alpha value (0.1) to make dense areas more visible. This technique works well for visualizing the distribution of large datasets.
Using Hexbin Plots
For very large datasets, hexbin plots can be more effective than traditional scatterplots. Here's how to create a hexbin plot:
import matplotlib.pyplot as plt
import numpy as np

# Generate a large dataset
np.random.seed(42)
x = np.random.normal(0, 5, 100000)
y = np.random.normal(0, 5, 100000)

# Create the hexbin plot
fig, ax = plt.subplots(figsize=(10, 8))
hb = ax.hexbin(x, y, gridsize=50, cmap='viridis')

# Add a colorbar
cbar = plt.colorbar(hb)
cbar.set_label('Count')

# Set labels and title
ax.set_xlabel('X-axis')
ax.set_ylabel('Y-axis')
ax.set_title('How to Create Hexbin Plot for Large Datasets')

# Add text for how2matplotlib.com
ax.text(0.05, 0.95, 'how2matplotlib.com', transform=ax.transAxes, fontsize=10, va='top', color='white')

# Show the plot
plt.show()
Output:
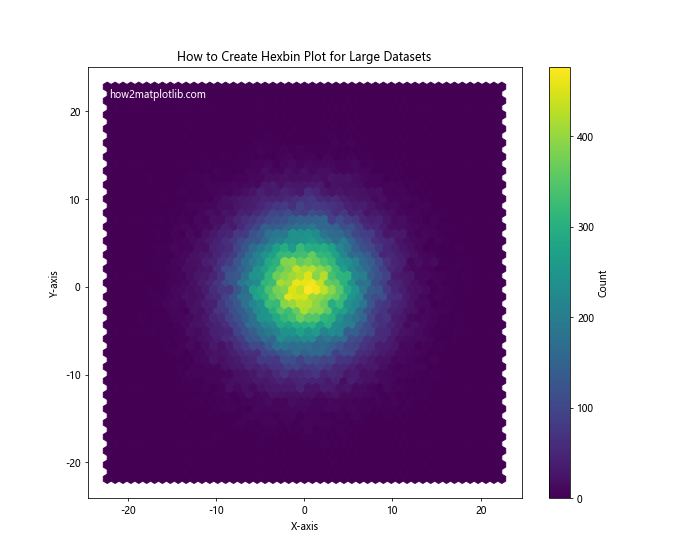
This example uses the hexbin() function to create a hexagonal binning plot, which is more suitable for visualizing the density of large datasets.
Combining Multiple Scatterplots with Negative and Positive Axes
Sometimes, you may need to compare multiple datasets in the same plot. Let's explore how to create multiple scatterplots with both negative and positive axes:### Creating Subplots with Shared Axes
When comparing multiple datasets, using subplots with shared axes can be very effective. Here's an example:
import matplotlib.pyplot as plt
import numpy as np

# Generate multiple datasets
np.random.seed(42)
x1 = np.random.uniform(-10, 10, 100)
y1 = x1**2 + np.random.normal(0, 10, 100)
x2 = np.random.uniform(-10, 10, 100)
y2 = -x2**2 + np.random.normal(0, 10, 100)

# Create subplots with shared axes
fig, (ax1, ax2) = plt.subplots(1, 2, figsize=(12, 5), sharex=True, sharey=True)

# Plot the first dataset
ax1.scatter(x1, y1, c='blue', alpha=0.7)
ax1.set_title('Dataset 1')
ax1.set_xlabel('X-axis')
ax1.set_ylabel('Y-axis')

# Plot the second dataset
ax2.scatter(x2, y2, c='red', alpha=0.7)
ax2.set_title('Dataset 2')
ax2.set_xlabel('X-axis')

# Add a main title
fig.suptitle('How to Create Scatterplot with Multiple Datasets', fontsize=16)

# Add text for how2matplotlib.com
fig.text(0.5, 0.02, 'how2matplotlib.com', ha='center', fontsize=10)

# Adjust layout and show the plot
plt.tight_layout()
plt.show()
Output:
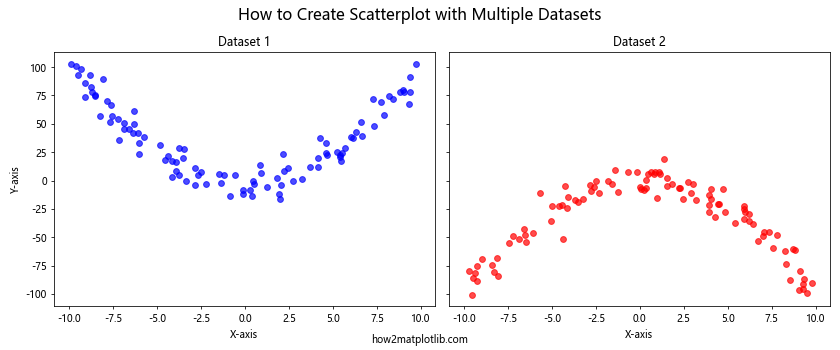
In this example, we create two subplots with shared x and y axes. This allows for easy comparison between the two datasets while maintaining the ability to visualize both positive and negative values.
Enhancing Scatterplots with Statistical Information
When creating scatterplots with both negative and positive axes, it can be helpful to include statistical information to provide more context. Let's explore some ways to add statistical elements to your plots:
Adding a Regression Line
A regression line can help visualize the trend in your data. Here's how to add a regression line to your scatterplot:
import matplotlib.pyplot as plt
import numpy as np
from scipy import stats

# Generate data
np.random.seed(42)
x = np.random.uniform(-10, 10, 100)
y = 2*x + np.random.normal(0, 5, 100)

# Perform linear regression
slope, intercept, r_value, p_value, std_err = stats.linregress(x, y)
line = slope * x + intercept

# Create the scatterplot
fig, ax = plt.subplots(figsize=(10, 8))
ax.scatter(x, y, c='purple', alpha=0.7, label='Data')
ax.plot(x, line, color='red', label=f'Regression line (R² = {r_value**2:.2f})')

# Set labels and title
ax.set_xlabel('X-axis')
ax.set_ylabel('Y-axis')
ax.set_title('How to Create Scatterplot with Regression Line')

# Add legend
ax.legend()

# Add text for how2matplotlib.com
ax.text(0.05, 0.95, 'how2matplotlib.com', transform=ax.transAxes, fontsize=10, va='top')

# Show the plot
plt.show()
Output:
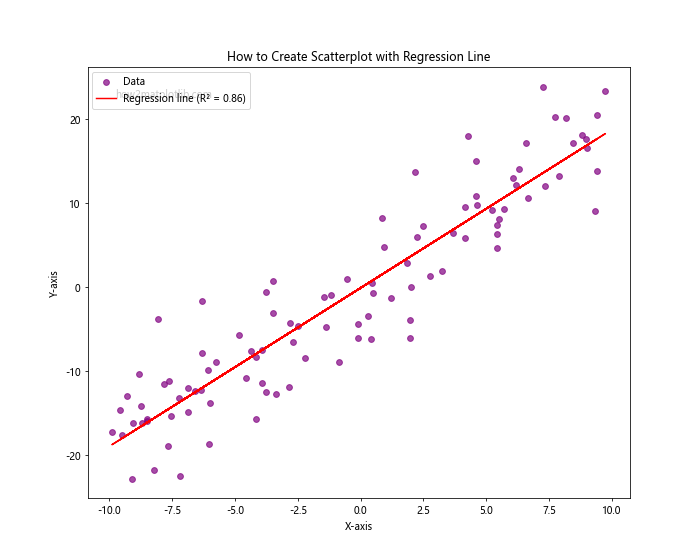
In this example, we use SciPy's stats.linregress() function to calculate the regression line and add it to the plot. We also include the R² value in the legend to provide additional statistical information.
Adding Confidence Intervals
Confidence intervals can provide information about the uncertainty in your data. Here's an example of how to add confidence intervals to your scatterplot:
import matplotlib.pyplot as plt
import numpy as np
from scipy import stats

# Generate data
np.random.seed(42)
x = np.linspace(-10, 10, 100)
y = 2*x + np.random.normal(0, 4, 100)

# Perform linear regression
slope, intercept, r_value, p_value, std_err = stats.linregress(x, y)
line = slope * x + intercept

# Calculate confidence intervals
n = len(x)
m = np.mean(x)
se = np.sqrt(np.sum((y - line)**2) / (n-2) / np.sum((x - m)**2))
ci = 1.96 * se * np.sqrt(1/n + (x - m)**2 / np.sum((x - m)**2))

# Create the scatterplot
fig, ax = plt.subplots(figsize=(10, 8))
ax.scatter(x, y, c='green', alpha=0.7, label='Data')
ax.plot(x, line, color='red', label='Regression line')
ax.fill_between(x, line - ci, line + ci, color='gray', alpha=0.2, label='95% Confidence Interval')

# Set labels and title
ax.set_xlabel('X-axis')
ax.set_ylabel('Y-axis')
ax.set_title('How to Create Scatterplot with Confidence Intervals')

# Add legend
ax.legend()

# Add text for how2matplotlib.com
ax.text(0.05, 0.95, 'how2matplotlib.com', transform=ax.transAxes, fontsize=10, va='top')

# Show the plot
plt.show()
Output:
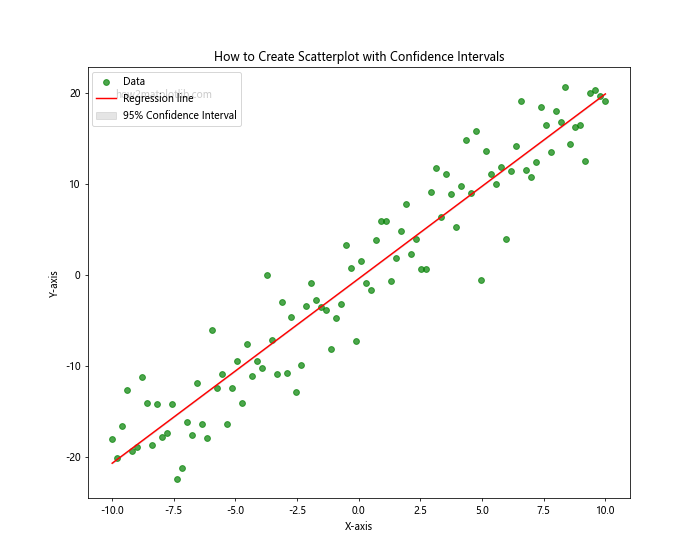
In this example, we calculate the 95% confidence interval for the regression line and add it to the plot using fill_between(). This provides a visual representation of the uncertainty in the trend line.
Customizing the Appearance of Scatterplots with Negative and Positive Axes
To create visually appealing and informative scatterplots with both negative and positive axes, you may want to customize various aspects of the plot's appearance. Let's explore some advanced customization techniques:
Using Custom Markers and Colors
Matplotlib offers a wide range of markers and colors that you can use to customize your scatterplot. Here's an example:
import matplotlib.pyplot as plt
import numpy as np

# Generate data
np.random.seed(42)
x = np.random.uniform(-10, 10, 50)
y = np.random.uniform(-10, 10, 50)
sizes = np.random.uniform(20, 200, 50)
colors = np.random.uniform(0, 1, 50)

# Create the scatterplot
fig, ax = plt.subplots(figsize=(10, 8))
scatter = ax.scatter(x, y, c=colors, s=sizes, cmap='viridis',
                     marker='*', alpha=0.7, edgecolors='black', linewidth=1)

# Add a colorbar
cbar = plt.colorbar(scatter)
cbar.set_label('Color Value')

# Set labels and title
ax.set_xlabel('X-axis')
ax.set_ylabel('Y-axis')
ax.set_title('How to Create Scatterplot with Custom Markers and Colors')

# Add text for how2matplotlib.com
ax.text(0.05, 0.95, 'how2matplotlib.com', transform=ax.transAxes, fontsize=10, va='top')

# Show the plot
plt.show()
Output:
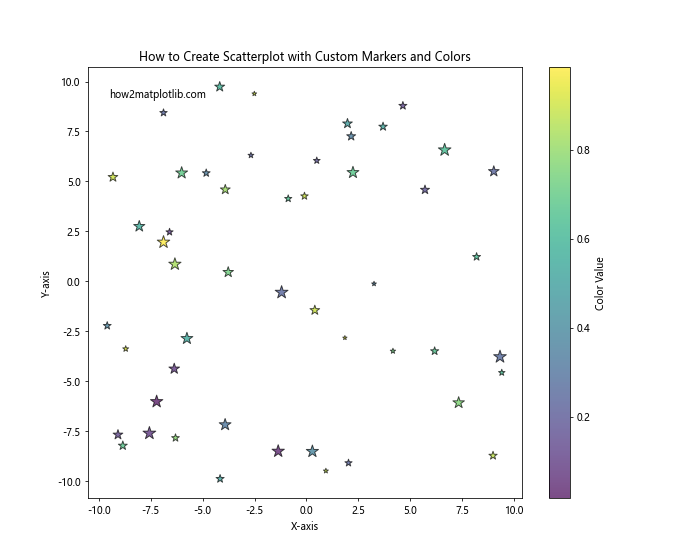
In this example, we use star-shaped markers with varying sizes and colors. The edgecolors and linewidth parameters are used to add black outlines to the markers, improving their visibility.
Handling Special Cases in Scatterplots with Negative and Positive Axes
When creating scatterplots with both negative and positive axes, you may encounter special cases that require specific handling. Let's explore some of these scenarios:
Dealing with Outliers
Outliers can significantly affect the scale of your scatterplot. Here's an example of how to handle outliers:
import matplotlib.pyplot as plt
import numpy as np

# Generate data with outliers
np.random.seed(42)
x = np.random.normal(0, 1, 100)
y = np.random.normal(0, 1, 100)
x[0], y[0] = 10, 10  # Add an outlier

# Create the scatterplot
fig, (ax1, ax2) = plt.subplots(1, 2, figsize=(15, 6))

# Plot without handling outliers
ax1.scatter(x, y, c='blue', alpha=0.7)
ax1.set_title('Without Outlier Handling')
ax1.set_xlabel('X-axis')
ax1.set_ylabel('Y-axis')

# Plot with outlier handling
ax2.scatter(x, y, c='red', alpha=0.7)
ax2.set_xlim(-3, 3)
ax2.set_ylim(-3, 3)
ax2.set_title('With Outlier Handling')
ax2.set_xlabel('X-axis')
ax2.set_ylabel('Y-axis')

# Add a main title
fig.suptitle('How to Create Scatterplot with Outlier Handling', fontsize=16)

# Add text for how2matplotlib.com
fig.text(0.5, 0.02, 'how2matplotlib.com', ha='center', fontsize=10)

# Adjust layout and show the plot
plt.tight_layout()
plt.show()
Output:
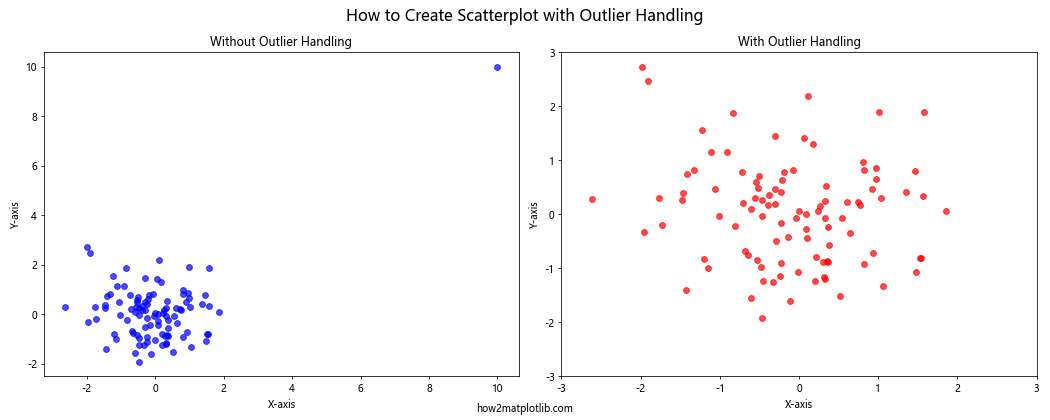
In this example, we create two subplots: one without outlier handling and one with outlier handling. In the second subplot, we use set_xlim() and set_ylim() to focus on the main cluster of data points, effectively handling the outlier.
Logarithmic Scales
When dealing with data that spans several orders of magnitude, using logarithmic scales can be helpful. Here's how to create a scatterplot with logarithmic scales:
import matplotlib.pyplot as plt
import numpy as np

# Generate data
np.random.seed(42)
x = np.random.uniform(0.1, 1000, 100)
y = x**2 * np.random.uniform(0.1, 10, 100)

# Create the scatterplot
fig, ax = plt.subplots(figsize=(10, 8))
ax.scatter(x, y, c='purple', alpha=0.7)

# Set logarithmic scales
ax.set_xscale('log')
ax.set_yscale('log')

# Set labels and title
ax.set_xlabel('X-axis (log scale)')
ax.set_ylabel('Y-axis (log scale)')
ax.set_title('How to Create Scatterplot with Logarithmic Scales')

# Add text for how2matplotlib.com
ax.text(0.05, 0.95, 'how2matplotlib.com', transform=ax.transAxes, fontsize=10, va='top')

# Show the plot
plt.show()
Output:
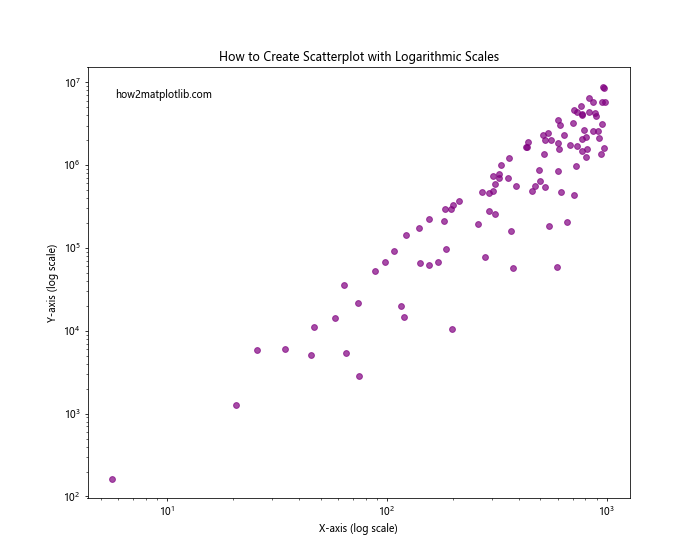
In this example, we use set_xscale('log') and set_yscale('log') to set logarithmic scales for both axes. This is particularly useful when visualizing data with exponential relationships.
Advanced Techniques for Scatterplots with Negative and Positive Axes
As you become more proficient in creating scatterplots with both negative and positive axes, you may want to explore more advanced techniques. Let's look at some advanced methods:
3D Scatterplots
While we've focused on 2D scatterplots so far, Matplotlib also supports 3D scatterplots. Here's an example:
import matplotlib.pyplot as plt
import numpy as np

# Generate 3D data
np.random.seed(42)
x = np.random.uniform(-5, 5, 100)
y = np.random.uniform(-5, 5, 100)
z = x**2 + y**2 + np.random.normal(0, 1, 100)

# Create the 3D scatterplot
fig = plt.figure(figsize=(10, 8))
ax = fig.add_subplot(111, projection='3d')
scatter = ax.scatter(x, y, z, c=z, cmap='viridis', s=50)

# Add a colorbar
cbar = fig.colorbar(scatter)
cbar.set_label('Z-value')

# Set labels and title
ax.set_xlabel('X-axis')
ax.set_ylabel('Y-axis')
ax.set_zlabel('Z-axis')
ax.set_title('How to Create 3D Scatterplot with Negative and Positive Axes')

# Add text for how2matplotlib.com
ax.text2D(0.05, 0.95, 'how2matplotlib.com', transform=ax.transAxes, fontsize=10, va='top')

# Show the plot
plt.show()
Output:
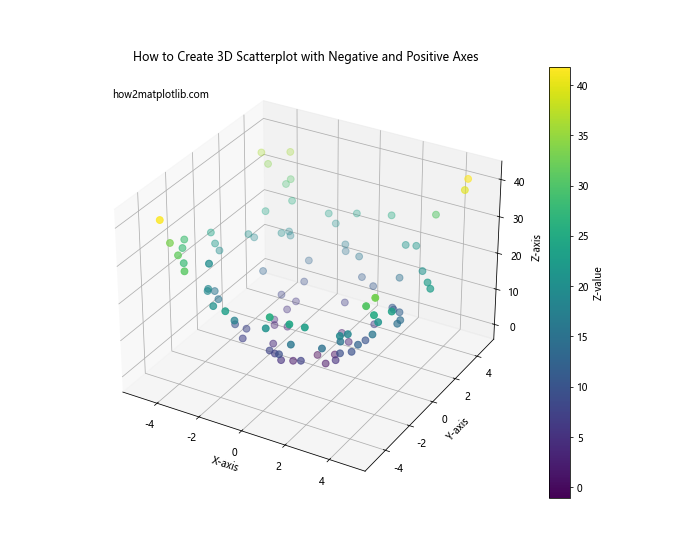
In this example, we create a 3D scatterplot using the projection='3d' parameter when adding a subplot. This allows us to visualize data in three dimensions, with both negative and positive values on all axes.
Animated Scatterplots
Creating animated scatterplots can be a powerful way to visualize changing data over time. Here's a basic example of how to create an animated scatterplot:
import matplotlib.pyplot as plt
import numpy as np
from matplotlib.animation import FuncAnimation

# Set up the figure and axis
fig, ax = plt.subplots(figsize=(10, 8))
ax.set_xlim(-10, 10)
ax.set_ylim(-10, 10)

# Initialize an empty scatter plot
scat = ax.scatter([], [], c='blue', alpha=0.7)

# Animation update function
def update(frame):
    x = np.random.uniform(-10, 10, 100)
    y = np.random.uniform(-10, 10, 100)
    scat.set_offsets(np.c_[x, y])
    return scat,

# Create the animation
anim = FuncAnimation(fig, update, frames=100, interval=100, blit=True)

# Set labels and title
ax.set_xlabel('X-axis')
ax.set_ylabel('Y-axis')
ax.set_title('How to Create Animated Scatterplot')

# Add text for how2matplotlib.com
ax.text(0.05, 0.95, 'how2matplotlib.com', transform=ax.transAxes, fontsize=10, va='top')

# Show the animation
plt.show()
Output:
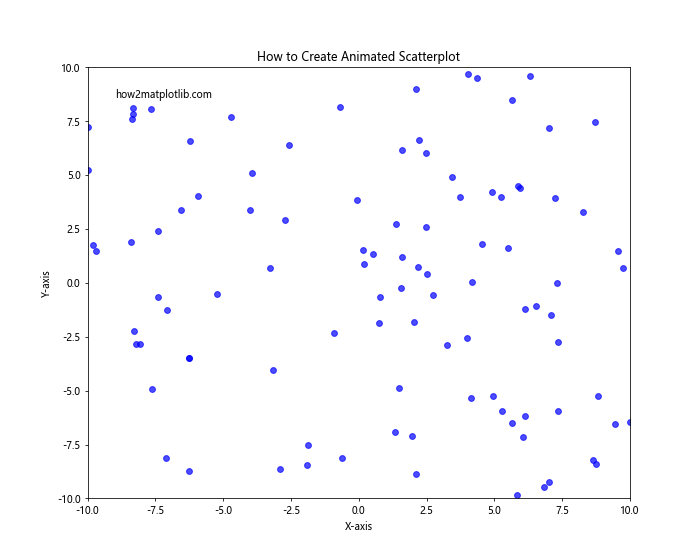
In this example, we use Matplotlib's FuncAnimation to create an animated scatterplot. The update function generates new random data for each frameof the animation, creating the illusion of moving points.
Best Practices for Creating Scatterplots with Negative and Positive Axes
When learning how to create scatterplot with both negative and positive axes, it's important to follow best practices to ensure your visualizations are effective and informative. Here are some key guidelines to keep in mind:
- Choose appropriate axis limits: Ensure that your axis limits encompass all data points while minimizing empty space. Use functions like
ax.set_xlim()andax.set_ylim()to set custom limits when necessary. Use clear and descriptive labels: Always label your axes and provide a clear title for your plot. This helps viewers understand what the data represents.
Consider color choices carefully: Use colors that are easily distinguishable and colorblind-friendly. The 'viridis' colormap is a good default choice for continuous data.
Add a legend when necessary: If your plot contains multiple datasets or categories, include a legend to explain what each color or marker represents.
Use appropriate marker sizes: Choose marker sizes that allow individual points to be visible without overwhelming the plot. Adjust sizes using the
sparameter in thescatter()function.Include error bars or confidence intervals when relevant: If your data includes uncertainty measurements, consider adding error bars or confidence intervals to provide a more complete picture.
Optimize for your audience: Consider the technical background of your audience when deciding how much detail to include in your plot.
Use consistent styling: If creating multiple plots for comparison, use consistent colors, markers, and styles to make comparisons easier.
Consider data density: For large datasets, use techniques like alpha blending or hexbin plots to avoid overplotting.
Add context with annotations: Use annotations to highlight important data points or trends in your scatterplot.
Troubleshooting Common Issues in Scatterplots with Negative and Positive Axes
Even experienced data visualizers can encounter issues when creating scatterplots with both negative and positive axes. Here are some common problems and their solutions: