How to Create Multiple Subplots in Matplotlib
How to Create Multiple Subplots in Matplotlib is an essential skill for data visualization enthusiasts and professionals alike. Matplotlib, a powerful plotting library in Python, offers various ways to create multiple subplots within a single figure. This article will delve deep into the intricacies of creating multiple subplots, providing you with a thorough understanding of the subject and equipping you with the necessary tools to enhance your data visualization projects.
Understanding the Basics of Multiple Subplots in Matplotlib
Before we dive into the specifics of how to create multiple subplots in Matplotlib, it’s crucial to understand the fundamental concepts. Multiple subplots allow you to display several plots within a single figure, enabling side-by-side comparisons or presenting related data in a cohesive manner. Matplotlib provides flexible methods to create and customize these subplots, giving you full control over the layout and appearance of your visualizations.
Let’s start with a simple example to illustrate how to create multiple subplots in Matplotlib:
import matplotlib.pyplot as plt
import numpy as np

# Create a figure with 2 subplots
fig, (ax1, ax2) = plt.subplots(1, 2, figsize=(10, 4))

# Generate data for the plots
x = np.linspace(0, 10, 100)
y1 = np.sin(x)
y2 = np.cos(x)

# Plot data on the first subplot
ax1.plot(x, y1)
ax1.set_title('Sine Wave - how2matplotlib.com')

# Plot data on the second subplot
ax2.plot(x, y2)
ax2.set_title('Cosine Wave - how2matplotlib.com')

# Add a main title to the figure
fig.suptitle('How to Create Multiple Subplots in Matplotlib', fontsize=16)

plt.tight_layout()
plt.show()
Output:
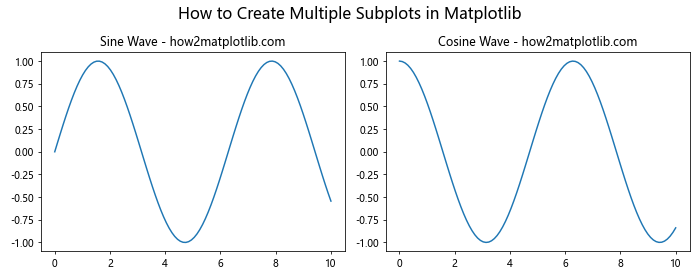
In this example, we create a figure with two subplots arranged horizontally. The plt.subplots() function returns a figure object and an array of axes objects, which we can use to plot data and customize each subplot individually.
Creating a Grid of Subplots
When learning how to create multiple subplots in Matplotlib, it’s important to understand how to arrange them in a grid layout. Matplotlib allows you to create a grid of subplots with varying numbers of rows and columns. This flexibility is particularly useful when you need to display multiple related plots in an organized manner.
Here’s an example demonstrating how to create a grid of subplots:
import matplotlib.pyplot as plt
import numpy as np

# Create a 2x2 grid of subplots
fig, axs = plt.subplots(2, 2, figsize=(10, 8))

# Generate data for the plots
x = np.linspace(0, 10, 100)
y1 = np.sin(x)
y2 = np.cos(x)
y3 = np.tan(x)
y4 = np.exp(x)

# Plot data on each subplot
axs[0, 0].plot(x, y1)
axs[0, 0].set_title('Sine Wave - how2matplotlib.com')

axs[0, 1].plot(x, y2)
axs[0, 1].set_title('Cosine Wave - how2matplotlib.com')

axs[1, 0].plot(x, y3)
axs[1, 0].set_title('Tangent Wave - how2matplotlib.com')

axs[1, 1].plot(x, y4)
axs[1, 1].set_title('Exponential Function - how2matplotlib.com')

# Add a main title to the figure
fig.suptitle('How to Create Multiple Subplots in Matplotlib: Grid Layout', fontsize=16)

plt.tight_layout()
plt.show()
Output:
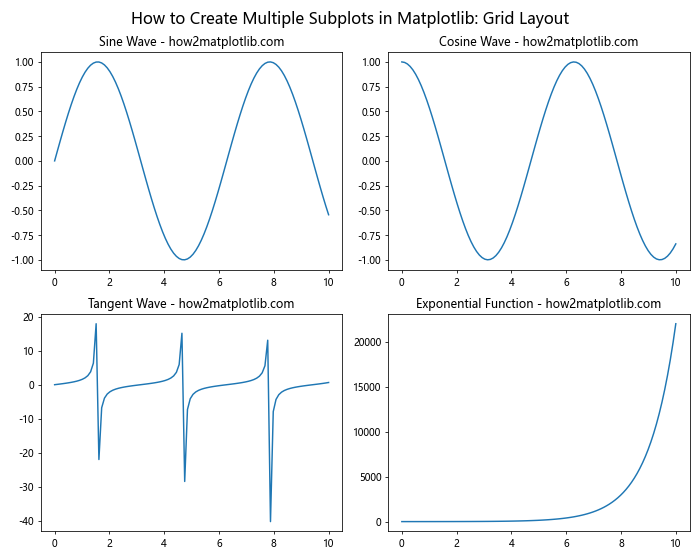
In this example, we create a 2×2 grid of subplots using plt.subplots(2, 2). The resulting axs object is a 2D array of axes, which we can access using indexing to plot data on each subplot.
Customizing Subplot Layouts
When learning how to create multiple subplots in Matplotlib, it’s essential to understand how to customize the layout of your subplots. Matplotlib provides various methods to adjust the spacing between subplots, align them, and create complex layouts.
Let’s explore an example that demonstrates how to create a custom layout with subplots of different sizes:
import matplotlib.pyplot as plt
import numpy as np

# Create a figure
fig = plt.figure(figsize=(12, 8))

# Create subplots with custom sizes
ax1 = fig.add_subplot(221)  # Top-left
ax2 = fig.add_subplot(222)  # Top-right
ax3 = fig.add_subplot(212)  # Bottom (spans two columns)

# Generate data for the plots
x = np.linspace(0, 10, 100)
y1 = np.sin(x)
y2 = np.cos(x)
y3 = np.tan(x)

# Plot data on each subplot
ax1.plot(x, y1)
ax1.set_title('Sine Wave - how2matplotlib.com')

ax2.plot(x, y2)
ax2.set_title('Cosine Wave - how2matplotlib.com')

ax3.plot(x, y3)
ax3.set_title('Tangent Wave - how2matplotlib.com')

# Add a main title to the figure
fig.suptitle('How to Create Multiple Subplots in Matplotlib: Custom Layout', fontsize=16)

plt.tight_layout()
plt.show()
Output:
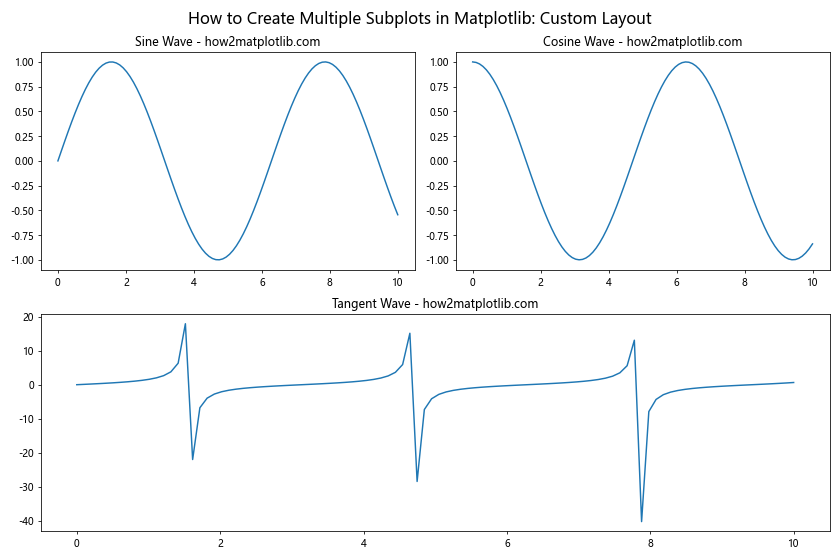
In this example, we use fig.add_subplot() to create subplots with custom sizes and positions. The arguments (221, 222, 212) specify the grid position and span of each subplot.
Using GridSpec for Advanced Layouts
For more complex layouts when creating multiple subplots in Matplotlib, you can use the GridSpec class. GridSpec allows you to create a grid-like structure and place subplots within specific grid cells, giving you fine-grained control over the layout.
Here’s an example demonstrating how to use GridSpec:
import matplotlib.pyplot as plt
import matplotlib.gridspec as gridspec
import numpy as np

# Create a figure
fig = plt.figure(figsize=(12, 8))

# Create a GridSpec object
gs = gridspec.GridSpec(3, 3)

# Create subplots using GridSpec
ax1 = fig.add_subplot(gs[0, :])  # Top row, spans all columns
ax2 = fig.add_subplot(gs[1, 0])  # Middle-left
ax3 = fig.add_subplot(gs[1, 1:])  # Middle-right, spans two columns
ax4 = fig.add_subplot(gs[2, :])  # Bottom row, spans all columns

# Generate data for the plots
x = np.linspace(0, 10, 100)
y1 = np.sin(x)
y2 = np.cos(x)
y3 = np.tan(x)
y4 = np.exp(x)

# Plot data on each subplot
ax1.plot(x, y1)
ax1.set_title('Sine Wave - how2matplotlib.com')

ax2.plot(x, y2)
ax2.set_title('Cosine Wave - how2matplotlib.com')

ax3.plot(x, y3)
ax3.set_title('Tangent Wave - how2matplotlib.com')

ax4.plot(x, y4)
ax4.set_title('Exponential Function - how2matplotlib.com')

# Add a main title to the figure
fig.suptitle('How to Create Multiple Subplots in Matplotlib: GridSpec Layout', fontsize=16)

plt.tight_layout()
plt.show()
Output:
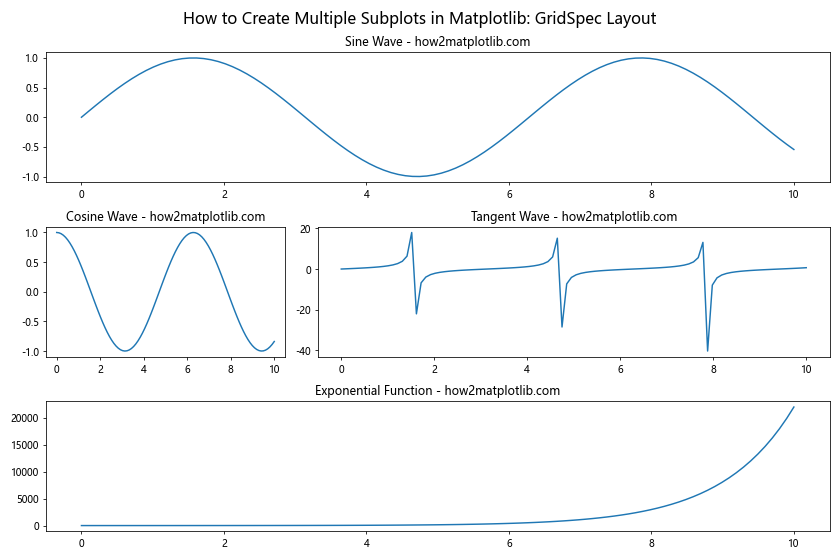
In this example, we create a 3×3 grid using GridSpec and place subplots in specific grid cells. This allows for more flexible and complex layouts than the standard subplot function.
Sharing Axes Between Subplots
When creating multiple subplots in Matplotlib, you may want to share axes between subplots to maintain consistent scales or reduce redundant information. Matplotlib provides options to share x-axes, y-axes, or both between subplots.
Here’s an example demonstrating how to share axes:
import matplotlib.pyplot as plt
import numpy as np

# Create a figure with shared axes
fig, (ax1, ax2, ax3) = plt.subplots(3, 1, figsize=(8, 10), sharex=True)

# Generate data for the plots
x = np.linspace(0, 10, 100)
y1 = np.sin(x)
y2 = np.cos(x)
y3 = np.tan(x)

# Plot data on each subplot
ax1.plot(x, y1)
ax1.set_title('Sine Wave - how2matplotlib.com')

ax2.plot(x, y2)
ax2.set_title('Cosine Wave - how2matplotlib.com')

ax3.plot(x, y3)
ax3.set_title('Tangent Wave - how2matplotlib.com')

# Add a main title to the figure
fig.suptitle('How to Create Multiple Subplots in Matplotlib: Shared Axes', fontsize=16)

plt.tight_layout()
plt.show()
Output:
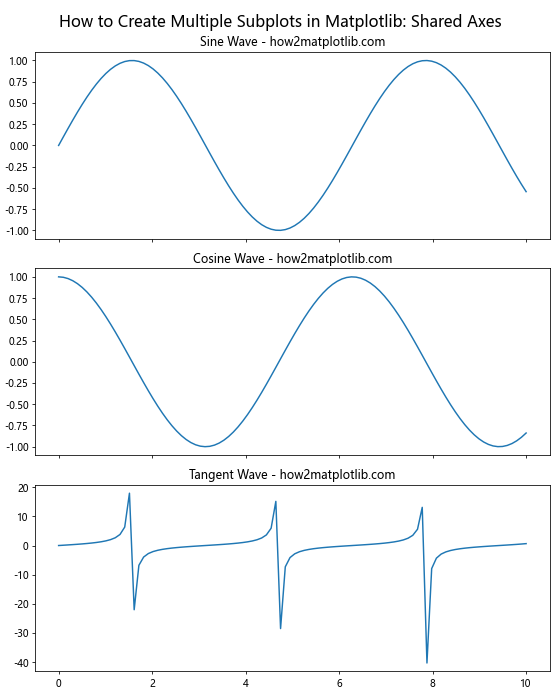
In this example, we use the sharex=True parameter when creating the subplots to share the x-axis across all three subplots. This ensures that the x-axis scale and limits are consistent across all subplots.
Adding Colorbars to Subplots
When creating multiple subplots in Matplotlib, you may need to add colorbars to visualize the range of values in your plots. Colorbars are particularly useful for heatmaps, contour plots, and other color-coded visualizations.
Here’s an example demonstrating how to add colorbars to subplots:
import matplotlib.pyplot as plt
import numpy as np

# Create a figure with 2 subplots
fig, (ax1, ax2) = plt.subplots(1, 2, figsize=(12, 5))

# Generate data for the plots
x = np.linspace(-5, 5, 100)
y = np.linspace(-5, 5, 100)
X, Y = np.meshgrid(x, y)
Z1 = np.sin(np.sqrt(X**2 + Y**2))
Z2 = np.cos(np.sqrt(X**2 + Y**2))

# Create heatmaps on each subplot
im1 = ax1.imshow(Z1, cmap='viridis', extent=[-5, 5, -5, 5])
ax1.set_title('Sine Heatmap - how2matplotlib.com')

im2 = ax2.imshow(Z2, cmap='plasma', extent=[-5, 5, -5, 5])
ax2.set_title('Cosine Heatmap - how2matplotlib.com')

# Add colorbars to each subplot
fig.colorbar(im1, ax=ax1, label='Sine Values')
fig.colorbar(im2, ax=ax2, label='Cosine Values')

# Add a main title to the figure
fig.suptitle('How to Create Multiple Subplots in Matplotlib: Colorbars', fontsize=16)

plt.tight_layout()
plt.show()
Output:
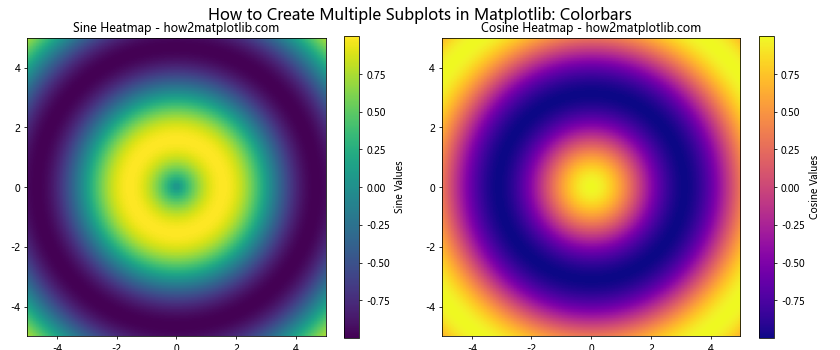
In this example, we create two heatmaps using imshow() and add colorbars to each subplot using fig.colorbar(). The ax parameter in fig.colorbar() specifies which subplot the colorbar should be associated with.
Creating Subplots with Different Scales
When learning how to create multiple subplots in Matplotlib, you may encounter situations where you need to display data with vastly different scales on the same figure. Matplotlib allows you to create subplots with independent scales to accommodate such scenarios.
Here’s an example demonstrating how to create subplots with different scales:
import matplotlib.pyplot as plt
import numpy as np

# Create a figure with 2 subplots
fig, (ax1, ax2) = plt.subplots(1, 2, figsize=(12, 5))

# Generate data for the plots
x1 = np.linspace(0, 10, 100)
y1 = np.sin(x1)

x2 = np.linspace(0, 1000, 100)
y2 = np.exp(x2 / 100)

# Plot data on each subplot
ax1.plot(x1, y1)
ax1.set_title('Sine Wave - how2matplotlib.com')
ax1.set_xlabel('X')
ax1.set_ylabel('Y')

ax2.plot(x2, y2)
ax2.set_title('Exponential Growth - how2matplotlib.com')
ax2.set_xlabel('X')
ax2.set_ylabel('Y')

# Use logarithmic scale for the y-axis of the second subplot
ax2.set_yscale('log')

# Add a main title to the figure
fig.suptitle('How to Create Multiple Subplots in Matplotlib: Different Scales', fontsize=16)

plt.tight_layout()
plt.show()
Output:
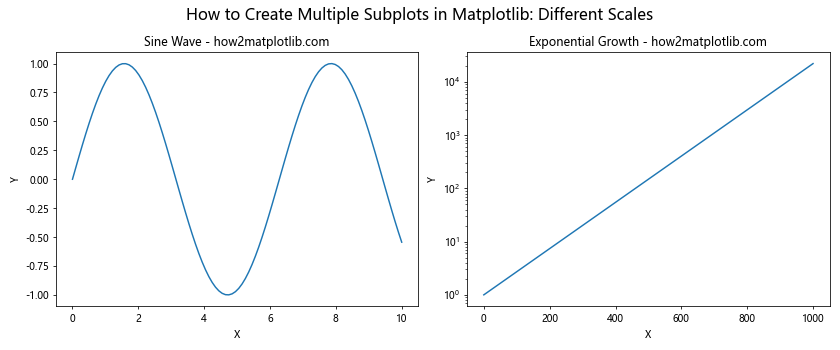
In this example, we create two subplots with different scales. The first subplot uses a linear scale for both axes, while the second subplot uses a logarithmic scale for the y-axis to better visualize the exponential growth.
Adding Annotations to Subplots
When creating multiple subplots in Matplotlib, adding annotations can help highlight important features or provide additional context to your visualizations. Matplotlib offers various annotation tools, such as text, arrows, and shapes.
Here’s an example demonstrating how to add annotations to subplots:
import matplotlib.pyplot as plt
import numpy as np

# Create a figure with 2 subplots
fig, (ax1, ax2) = plt.subplots(1, 2, figsize=(12, 5))

# Generate data for the plots
x = np.linspace(0, 10, 100)
y1 = np.sin(x)
y2 = np.cos(x)

# Plot data on each subplot
ax1.plot(x, y1)
ax1.set_title('Sine Wave - how2matplotlib.com')

ax2.plot(x, y2)
ax2.set_title('Cosine Wave - how2matplotlib.com')

# Add annotations to the first subplot
ax1.annotate('Peak', xy=(np.pi/2, 1), xytext=(np.pi/2 + 1, 0.8),
             arrowprops=dict(facecolor='black', shrink=0.05))

ax1.text(7, 0.5, 'Sine wave\nperiod: 2π', ha='center', va='center',
         bbox=dict(boxstyle='round', facecolor='white', edgecolor='gray'))

# Add annotations to the second subplot
ax2.annotate('Trough', xy=(np.pi, -1), xytext=(np.pi + 1, -0.8),
             arrowprops=dict(facecolor='black', shrink=0.05))

ax2.add_patch(plt.Circle((0, 1), 0.2, fill=False, edgecolor='red'))
ax2.text(0.3, 1, 'Start point', ha='left', va='center')

# Add a main title to the figure
fig.suptitle('How to Create Multiple Subplots in Matplotlib: Annotations', fontsize=16)

plt.tight_layout()
plt.show()
Output:
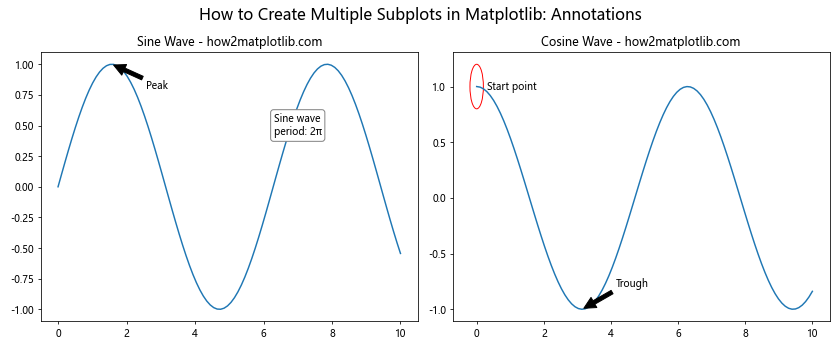
In this example, we add various annotations to the subplots, including text boxes, arrows, and shapes. These annotations help highlight specific features of the plots and provide additional information to the viewer.
Creating Subplots with Different Plot Types
One of the advantages of knowing how to create multiple subplots in Matplotlib is the ability to combine different types of plots in a single figure. This can be particularly useful when you want to present related data using various visualization techniques.
Here’s an example demonstrating how to createsubplots with different plot types:
import matplotlib.pyplot as plt
import numpy as np

# Create a figure with 4 subplots
fig, ((ax1, ax2), (ax3, ax4)) = plt.subplots(2, 2, figsize=(12, 10))

# Generate data for the plots
x = np.linspace(0, 10, 100)
y1 = np.sin(x)
y2 = np.random.normal(0, 1, 100)
y3 = np.cumsum(np.random.randn(100))

# Line plot
ax1.plot(x, y1)
ax1.set_title('Line Plot - how2matplotlib.com')

# Scatter plot
ax2.scatter(x, y2)
ax2.set_title('Scatter Plot - how2matplotlib.com')

# Bar plot
ax3.bar(range(10), np.random.rand(10))
ax3.set_title('Bar Plot - how2matplotlib.com')

# Step plot
ax4.step(x, y3)
ax4.set_title('Step Plot - how2matplotlib.com')

# Add a main title to the figure
fig.suptitle('How to Create Multiple Subplots in Matplotlib: Different Plot Types', fontsize=16)

plt.tight_layout()
plt.show()
Output:
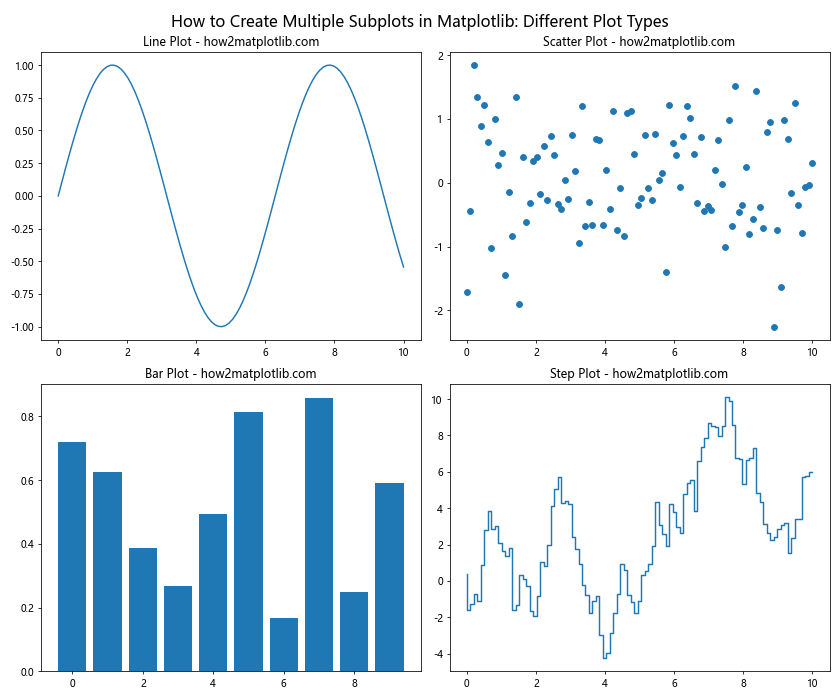
In this example, we create four subplots, each with a different type of plot: a line plot, a scatter plot, a bar plot, and a step plot. This demonstrates the versatility of Matplotlib in creating various types of visualizations within a single figure.
Adjusting Subplot Spacing
When creating multiple subplots in Matplotlib, you may need to adjust the spacing between subplots to improve the overall layout and readability of your figure. Matplotlib provides several methods to control subplot spacing.
Here’s an example demonstrating how to adjust subplot spacing:
import matplotlib.pyplot as plt
import numpy as np

# Create a figure with 4 subplots
fig, axs = plt.subplots(2, 2, figsize=(12, 10))

# Generate data for the plots
x = np.linspace(0, 10, 100)
y1 = np.sin(x)
y2 = np.cos(x)
y3 = np.tan(x)
y4 = np.exp(x)

# Plot data on each subplot
axs[0, 0].plot(x, y1)
axs[0, 0].set_title('Sine Wave - how2matplotlib.com')

axs[0, 1].plot(x, y2)
axs[0, 1].set_title('Cosine Wave - how2matplotlib.com')

axs[1, 0].plot(x, y3)
axs[1, 0].set_title('Tangent Wave - how2matplotlib.com')

axs[1, 1].plot(x, y4)
axs[1, 1].set_title('Exponential Function - how2matplotlib.com')

# Add a main title to the figure
fig.suptitle('How to Create Multiple Subplots in Matplotlib: Adjusting Spacing', fontsize=16)

# Adjust subplot spacing
plt.subplots_adjust(left=0.1, right=0.9, top=0.9, bottom=0.1, wspace=0.4, hspace=0.4)

plt.show()
Output:
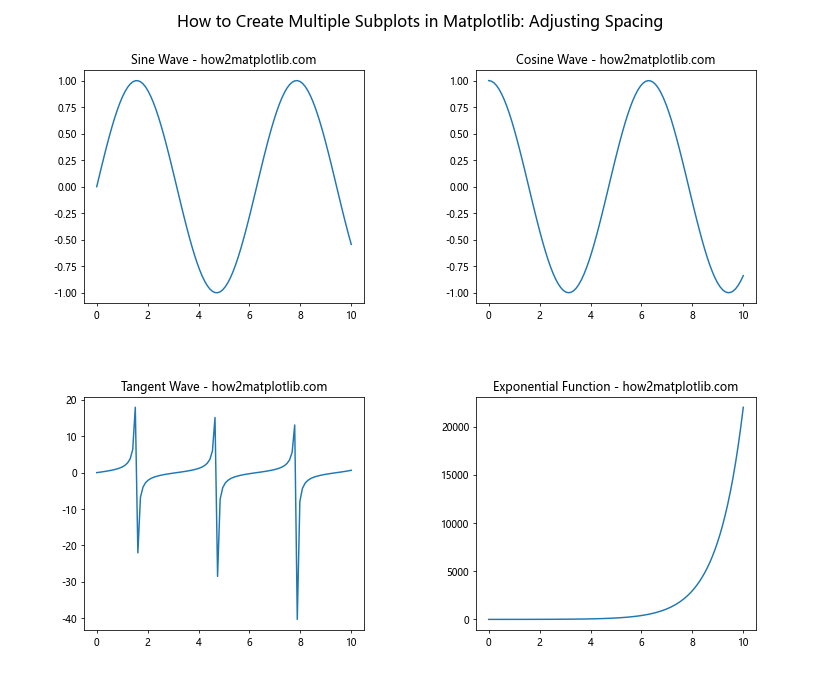
In this example, we use plt.subplots_adjust() to control the spacing between subplots. The parameters left, right, top, and bottom control the overall figure margins, while wspace and hspace control the width and height spacing between subplots, respectively.
Creating Subplots with Insets
When learning how to create multiple subplots in Matplotlib, you may encounter situations where you want to add a smaller plot within a larger plot. These smaller plots, called insets, can be useful for showing zoomed-in views or additional details.
Here’s an example demonstrating how to create subplots with insets:
import matplotlib.pyplot as plt
import numpy as np

# Create a figure with 1 subplot
fig, ax = plt.subplots(figsize=(10, 6))

# Generate data for the main plot
x = np.linspace(0, 10, 1000)
y = np.sin(x) * np.exp(-x/10)

# Plot data on the main subplot
ax.plot(x, y)
ax.set_title('Main Plot with Inset - how2matplotlib.com')

# Create an inset
axins = ax.inset_axes([0.6, 0.6, 0.3, 0.3])
axins.plot(x, y)
axins.set_xlim(1, 2)
axins.set_ylim(0.5, 0.8)
axins.set_xticklabels([])
axins.set_yticklabels([])

# Add a zoomed-in area indicator
ax.indicate_inset_zoom(axins, edgecolor="black")

# Add a main title to the figure
fig.suptitle('How to Create Multiple Subplots in Matplotlib: Insets', fontsize=16)

plt.tight_layout()
plt.show()
Output:
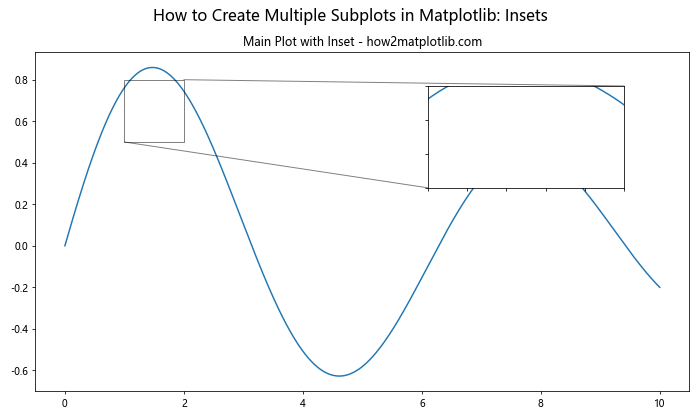
In this example, we create a main plot and add an inset using ax.inset_axes(). The inset shows a zoomed-in view of a specific area of the main plot. We use ax.indicate_inset_zoom() to draw a box on the main plot indicating the zoomed-in area.
Creating Subplots with Different Aspect Ratios
When creating multiple subplots in Matplotlib, you may need to adjust the aspect ratios of individual subplots to better suit your data or visualization requirements. Matplotlib allows you to control the aspect ratio of each subplot independently.
Here’s an example demonstrating how to create subplots with different aspect ratios:
import matplotlib.pyplot as plt
import numpy as np

# Create a figure with 3 subplots
fig = plt.figure(figsize=(12, 8))

# Create subplots with different aspect ratios
ax1 = fig.add_subplot(221, aspect='equal')
ax2 = fig.add_subplot(222, aspect=2)
ax3 = fig.add_subplot(212, aspect=0.5)

# Generate data for the plots
x = np.linspace(0, 10, 100)
y1 = np.sin(x)
y2 = np.cos(x)
y3 = np.tan(x)

# Plot data on each subplot
ax1.plot(x, y1)
ax1.set_title('Aspect Ratio 1:1 - how2matplotlib.com')

ax2.plot(x, y2)
ax2.set_title('Aspect Ratio 2:1 - how2matplotlib.com')

ax3.plot(x, y3)
ax3.set_title('Aspect Ratio 1:2 - how2matplotlib.com')

# Add a main title to the figure
fig.suptitle('How to Create Multiple Subplots in Matplotlib: Different Aspect Ratios', fontsize=16)

plt.tight_layout()
plt.show()
Output:
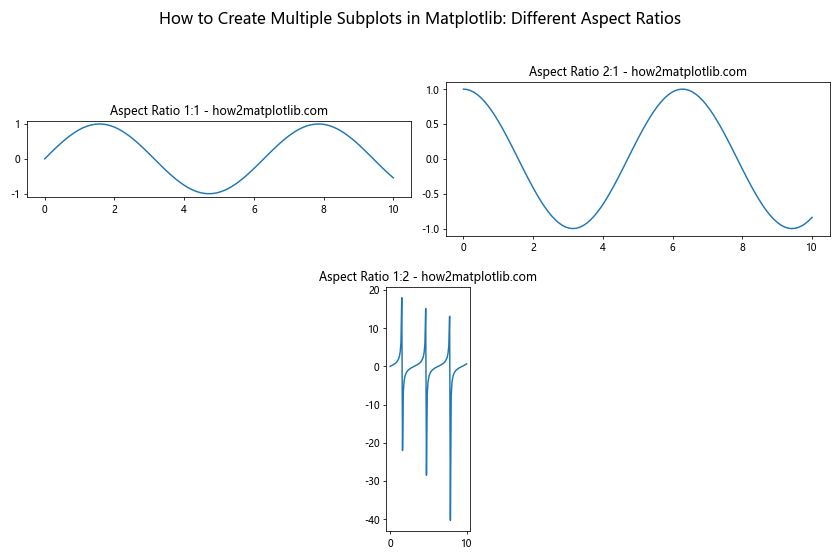
In this example, we create three subplots with different aspect ratios using the aspect parameter in fig.add_subplot(). The first subplot has an equal aspect ratio (1:1), the second subplot has an aspect ratio of 2:1, and the third subplot has an aspect ratio of 1:2.
Creating 3D Subplots
When exploring how to create multiple subplots in Matplotlib, you may want to include 3D plots alongside 2D plots. Matplotlib’s mplot3d toolkit allows you to create 3D subplots within the same figure as 2D subplots.
Here’s an example demonstrating how to create a figure with both 2D and 3D subplots:
import matplotlib.pyplot as plt
import numpy as np
from mpl_toolkits.mplot3d import Axes3D

# Create a figure with 2 subplots (1 2D and 1 3D)
fig = plt.figure(figsize=(12, 6))

# Create a 2D subplot
ax1 = fig.add_subplot(121)

# Create a 3D subplot
ax2 = fig.add_subplot(122, projection='3d')

# Generate data for the plots
x = np.linspace(-5, 5, 100)
y = np.linspace(-5, 5, 100)
X, Y = np.meshgrid(x, y)
Z = np.sin(np.sqrt(X**2 + Y**2))

# Plot data on the 2D subplot
im = ax1.imshow(Z, cmap='viridis', extent=[-5, 5, -5, 5])
ax1.set_title('2D Heatmap - how2matplotlib.com')
fig.colorbar(im, ax=ax1, label='Z values')

# Plot data on the 3D subplot
surf = ax2.plot_surface(X, Y, Z, cmap='viridis')
ax2.set_title('3D Surface Plot - how2matplotlib.com')
fig.colorbar(surf, ax=ax2, label='Z values')

# Add a main title to the figure
fig.suptitle('How to Create Multiple Subplots in Matplotlib: 2D and 3D', fontsize=16)

plt.tight_layout()
plt.show()
Output:
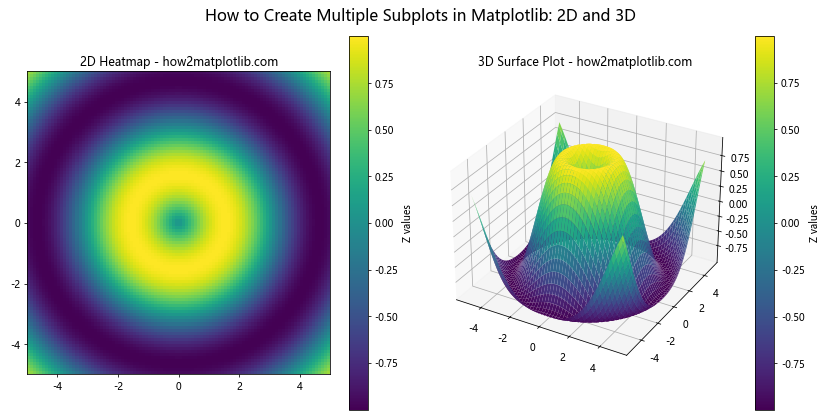
In this example, we create a figure with two subplots: a 2D heatmap and a 3D surface plot. We use projection='3d' when creating the 3D subplot to enable 3D plotting capabilities.
Creating Subplots with Different Sizes
When creating multiple subplots in Matplotlib, you may want to have subplots of different sizes within the same figure. This can be useful when you want to emphasize certain plots or accommodate different types of visualizations.
Here’s an example demonstrating how to create subplots with different sizes:
import matplotlib.pyplot as plt
import matplotlib.gridspec as gridspec
import numpy as np

# Create a figure
fig = plt.figure(figsize=(12, 8))

# Create a GridSpec object with custom ratios
gs = gridspec.GridSpec(2, 2, width_ratios=[2, 1], height_ratios=[1, 2])

# Create subplots using GridSpec
ax1 = fig.add_subplot(gs[0, 0])
ax2 = fig.add_subplot(gs[0, 1])
ax3 = fig.add_subplot(gs[1, :])

# Generate data for the plots
x = np.linspace(0, 10, 100)
y1 = np.sin(x)
y2 = np.cos(x)
y3 = np.tan(x)

# Plot data on each subplot
ax1.plot(x, y1)
ax1.set_title('Sine Wave - how2matplotlib.com')

ax2.plot(x, y2)
ax2.set_title('Cosine Wave - how2matplotlib.com')

ax3.plot(x, y3)
ax3.set_title('Tangent Wave - how2matplotlib.com')

# Add a main title to the figure
fig.suptitle('How to Create Multiple Subplots in Matplotlib: Different Sizes', fontsize=16)

plt.tight_layout()
plt.show()
Output:
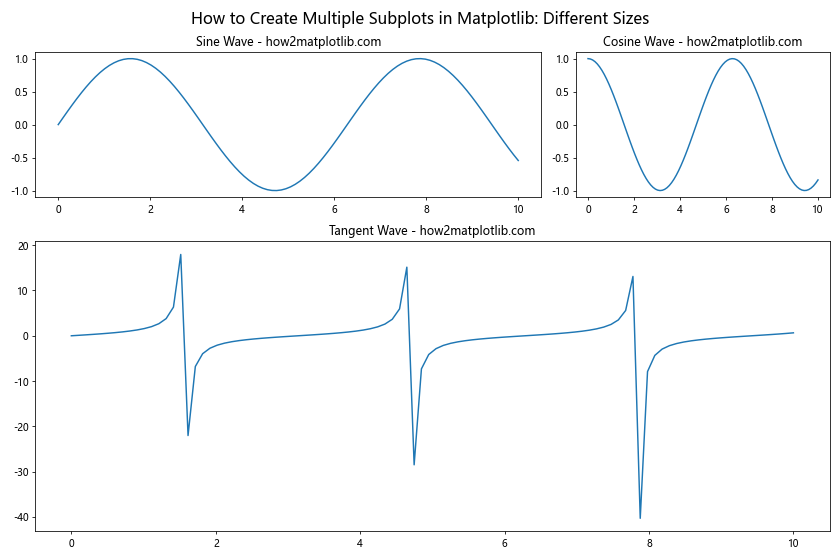
In this example, we use GridSpec to create a custom layout with subplots of different sizes. The width_ratios and height_ratios parameters in gridspec.GridSpec() allow us to specify the relative sizes of the columns and rows in the grid.
Conclusion
In this comprehensive guide on how to create multiple subplots in Matplotlib, we’ve explored various techniques and approaches to create complex and informative visualizations. From basic grid layouts to advanced customizations, Matplotlib offers a wide range of tools to help you present your data effectively.
We’ve covered topics such as:
- Creating basic grid layouts
- Customizing subplot layouts
- Using GridSpec for advanced layouts
- Sharing axes between subplots
- Adding colorbars to subplots
- Creating subplots with different scales
- Adding annotations to subplots
- Combining different plot types
- Adjusting subplot spacing
- Creating subplots with insets
- Working with different aspect ratios
- Incorporating 3D subplots
- Using polar coordinates
- Creating subplots with different sizes
By mastering these techniques, you’ll be well-equipped to create sophisticated and informative visualizations using Matplotlib. Remember to experiment with different layouts and customizations to find the best way to present your data effectively.