How to Create Different Subplot Sizes in Matplotlib
How to Create Different Subplot Sizes in Matplotlib is an essential skill for data visualization enthusiasts and professionals alike. Matplotlib, a powerful plotting library in Python, offers various ways to create subplots with different sizes, allowing for more flexible and customized visualizations. In this comprehensive guide, we’ll explore the different methods and techniques to create subplots of varying sizes using Matplotlib.
Understanding the Basics of Subplots in Matplotlib
Before diving into creating different subplot sizes, it’s crucial to understand the basics of subplots in Matplotlib. Subplots are individual plots arranged in a grid-like structure within a single figure. They allow you to display multiple plots side by side or in a grid layout, making it easier to compare and analyze different datasets or visualizations.
To create subplots in Matplotlib, you typically use the plt.subplots() function. Here’s a simple example:
import matplotlib.pyplot as plt

fig, (ax1, ax2) = plt.subplots(1, 2, figsize=(10, 5))
ax1.plot([1, 2, 3, 4], [1, 4, 2, 3], label='Data 1')
ax2.plot([1, 2, 3, 4], [4, 3, 2, 1], label='Data 2')
ax1.set_title('Subplot 1 - how2matplotlib.com')
ax2.set_title('Subplot 2 - how2matplotlib.com')
ax1.legend()
ax2.legend()
plt.tight_layout()
plt.show()
Output:
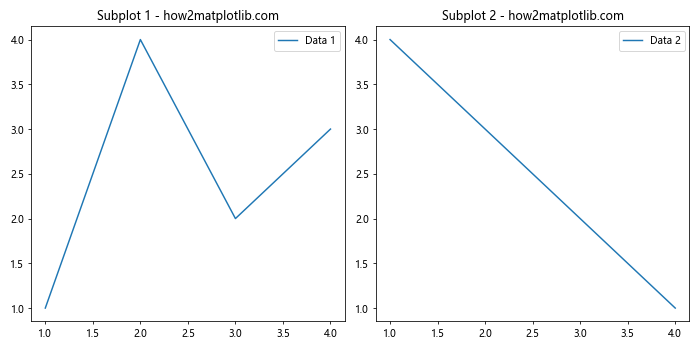
In this example, we create two subplots of equal size arranged horizontally. However, our focus is on creating subplots with different sizes, so let’s explore various methods to achieve this.
Method 1: Using GridSpec to Create Different Subplot Sizes
One of the most flexible ways to create subplots with different sizes in Matplotlib is by using the GridSpec class. GridSpec allows you to define a grid of subplots with custom sizes and arrangements.
Here’s an example of how to use GridSpec to create subplots with different sizes:
import matplotlib.pyplot as plt
import matplotlib.gridspec as gridspec

fig = plt.figure(figsize=(12, 8))
gs = gridspec.GridSpec(2, 2, width_ratios=[2, 1], height_ratios=[1, 2])

ax1 = fig.add_subplot(gs[0, 0])
ax2 = fig.add_subplot(gs[0, 1])
ax3 = fig.add_subplot(gs[1, :])

ax1.plot([1, 2, 3, 4], [1, 4, 2, 3])
ax2.plot([1, 2, 3, 4], [4, 3, 2, 1])
ax3.plot([1, 2, 3, 4], [2, 3, 4, 1])

ax1.set_title('Subplot 1 - how2matplotlib.com')
ax2.set_title('Subplot 2 - how2matplotlib.com')
ax3.set_title('Subplot 3 - how2matplotlib.com')

plt.tight_layout()
plt.show()
Output:
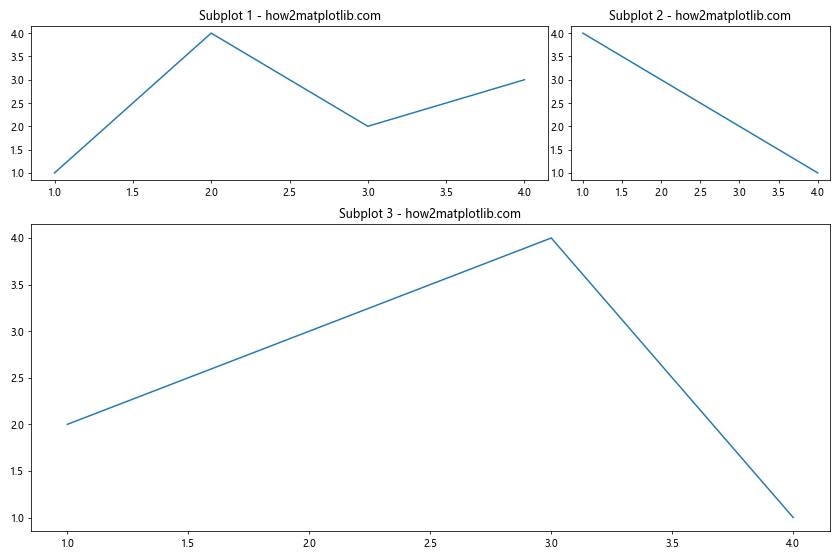
In this example, we create a 2×2 grid with different width and height ratios. The first row has two subplots with a 2:1 width ratio, while the second row has a single subplot spanning both columns. This demonstrates how GridSpec allows you to create subplots with different sizes and arrangements.
Method 2: Using add_axes() for Precise Subplot Placement
Another method to create subplots with different sizes is by using the add_axes() function. This method gives you precise control over the position and size of each subplot within the figure.
Here’s an example of how to use add_axes() to create subplots with different sizes:
import matplotlib.pyplot as plt

fig = plt.figure(figsize=(12, 8))

ax1 = fig.add_axes([0.1, 0.5, 0.4, 0.4])
ax2 = fig.add_axes([0.55, 0.5, 0.4, 0.4])
ax3 = fig.add_axes([0.1, 0.1, 0.85, 0.3])

ax1.plot([1, 2, 3, 4], [1, 4, 2, 3])
ax2.plot([1, 2, 3, 4], [4, 3, 2, 1])
ax3.plot([1, 2, 3, 4], [2, 3, 4, 1])

ax1.set_title('Subplot 1 - how2matplotlib.com')
ax2.set_title('Subplot 2 - how2matplotlib.com')
ax3.set_title('Subplot 3 - how2matplotlib.com')

plt.show()
Output:
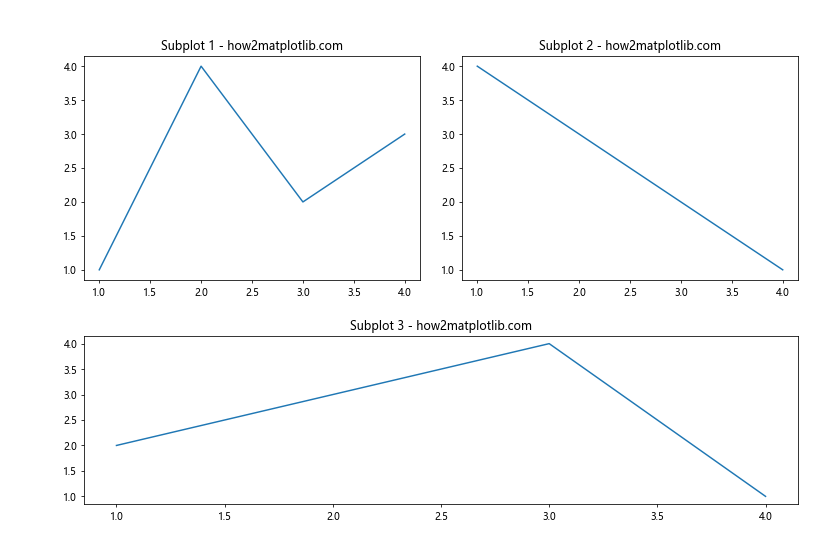
In this example, we create three subplots with different sizes and positions. The add_axes() function takes a list of four values: [left, bottom, width, height], where each value is a fraction of the figure dimensions. This method allows for precise control over subplot placement and size.
Method 3: Combining subplot() and set_position()
Another approach to create subplots with different sizes is by combining the subplot() function with set_position(). This method allows you to create subplots in a grid-like structure and then adjust their sizes individually.
Here’s an example of how to use this method:
import matplotlib.pyplot as plt

fig = plt.figure(figsize=(12, 8))

ax1 = fig.add_subplot(221)
ax2 = fig.add_subplot(222)
ax3 = fig.add_subplot(212)

ax1.plot([1, 2, 3, 4], [1, 4, 2, 3])
ax2.plot([1, 2, 3, 4], [4, 3, 2, 1])
ax3.plot([1, 2, 3, 4], [2, 3, 4, 1])

ax1.set_title('Subplot 1 - how2matplotlib.com')
ax2.set_title('Subplot 2 - how2matplotlib.com')
ax3.set_title('Subplot 3 - how2matplotlib.com')

ax1.set_position([0.1, 0.5, 0.35, 0.35])
ax2.set_position([0.55, 0.5, 0.35, 0.35])
ax3.set_position([0.1, 0.1, 0.8, 0.3])

plt.show()
Output:
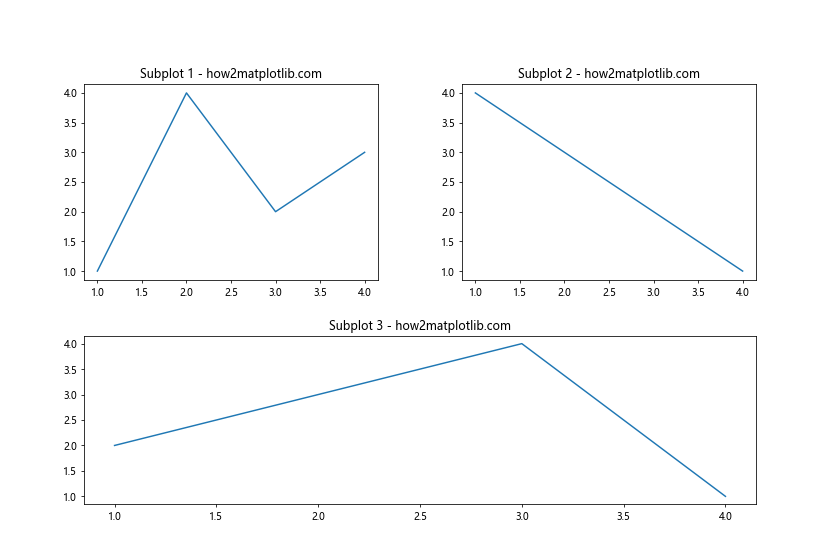
In this example, we first create subplots using the add_subplot() function with a 2×2 grid. Then, we use set_position() to adjust the size and position of each subplot individually. This method provides flexibility in arranging subplots with different sizes.
Creating Complex Layouts with Nested GridSpec
For more complex layouts with subplots of different sizes, you can use nested GridSpec objects. This approach allows you to create hierarchical grid structures, giving you even more control over subplot sizes and arrangements.
Here’s an example of how to create a complex layout using nested GridSpec:
import matplotlib.pyplot as plt
import matplotlib.gridspec as gridspec

fig = plt.figure(figsize=(12, 8))
outer_grid = gridspec.GridSpec(2, 2, wspace=0.2, hspace=0.2)

inner_grid1 = gridspec.GridSpecFromSubplotSpec(2, 1, subplot_spec=outer_grid[0, 0])
inner_grid2 = gridspec.GridSpecFromSubplotSpec(1, 2, subplot_spec=outer_grid[0, 1])
inner_grid3 = gridspec.GridSpecFromSubplotSpec(1, 1, subplot_spec=outer_grid[1, :])

ax1 = fig.add_subplot(inner_grid1[0])
ax2 = fig.add_subplot(inner_grid1[1])
ax3 = fig.add_subplot(inner_grid2[0])
ax4 = fig.add_subplot(inner_grid2[1])
ax5 = fig.add_subplot(inner_grid3[0])

ax1.plot([1, 2, 3, 4], [1, 4, 2, 3])
ax2.plot([1, 2, 3, 4], [4, 3, 2, 1])
ax3.plot([1, 2, 3, 4], [2, 3, 4, 1])
ax4.plot([1, 2, 3, 4], [3, 1, 4, 2])
ax5.plot([1, 2, 3, 4], [1, 2, 3, 4])

ax1.set_title('Subplot 1 - how2matplotlib.com')
ax2.set_title('Subplot 2 - how2matplotlib.com')
ax3.set_title('Subplot 3 - how2matplotlib.com')
ax4.set_title('Subplot 4 - how2matplotlib.com')
ax5.set_title('Subplot 5 - how2matplotlib.com')

plt.tight_layout()
plt.show()
Output:
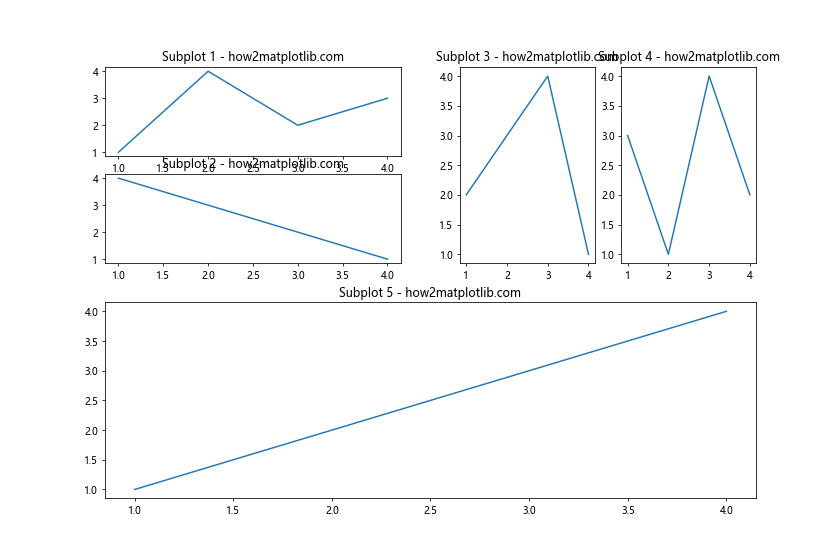
In this example, we create a complex layout with five subplots of different sizes. We use an outer GridSpec to define the main structure and then create nested GridSpec objects for more detailed control over subplot sizes and arrangements.
Adjusting Subplot Sizes Dynamically
Sometimes, you may need to adjust subplot sizes dynamically based on the content or data being displayed. Matplotlib provides several methods to achieve this, including tight_layout() and constrained_layout.
Here’s an example of how to use tight_layout() to automatically adjust subplot sizes:
import matplotlib.pyplot as plt

fig, (ax1, ax2, ax3) = plt.subplots(3, 1, figsize=(8, 10))

ax1.plot([1, 2, 3, 4], [1, 4, 2, 3])
ax2.plot([1, 2, 3, 4], [4, 3, 2, 1])
ax3.plot([1, 2, 3, 4], [2, 3, 4, 1])

ax1.set_title('Subplot 1 - how2matplotlib.com')
ax2.set_title('Subplot 2 - how2matplotlib.com')
ax3.set_title('Subplot 3 - how2matplotlib.com')

ax1.set_ylabel('Y-axis label with\nmultiple lines\nfor demonstration')
ax2.set_ylabel('Short label')
ax3.set_ylabel('Another multi-line\nY-axis label')

plt.tight_layout()
plt.show()
Output:
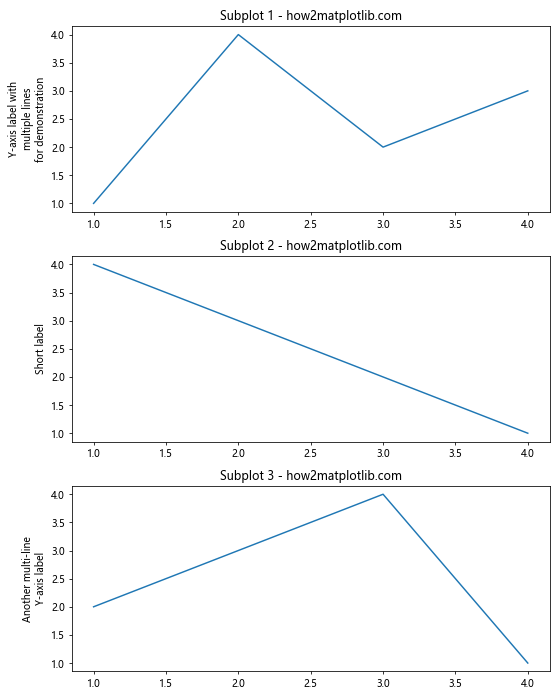
In this example, we create three subplots with different y-axis label lengths. The tight_layout() function automatically adjusts the subplot sizes to accommodate the varying label lengths, ensuring that all labels are visible and not overlapping.
Creating Subplots with Unequal Spacing
In some cases, you may want to create subplots with unequal spacing between them. This can be achieved using the gridspec_kw parameter in the plt.subplots() function or by manually adjusting the spacing using GridSpec.
Here’s an example of how to create subplots with unequal spacing:
import matplotlib.pyplot as plt

fig, axs = plt.subplots(2, 2, figsize=(10, 8),
                        gridspec_kw={'width_ratios': [2, 1],
                                     'height_ratios': [1, 2],
                                     'wspace': 0.3,
                                     'hspace': 0.5})

axs[0, 0].plot([1, 2, 3, 4], [1, 4, 2, 3])
axs[0, 1].plot([1, 2, 3, 4], [4, 3, 2, 1])
axs[1, 0].plot([1, 2, 3, 4], [2, 3, 4, 1])
axs[1, 1].plot([1, 2, 3, 4], [3, 1, 4, 2])

axs[0, 0].set_title('Subplot 1 - how2matplotlib.com')
axs[0, 1].set_title('Subplot 2 - how2matplotlib.com')
axs[1, 0].set_title('Subplot 3 - how2matplotlib.com')
axs[1, 1].set_title('Subplot 4 - how2matplotlib.com')

plt.show()
Output:
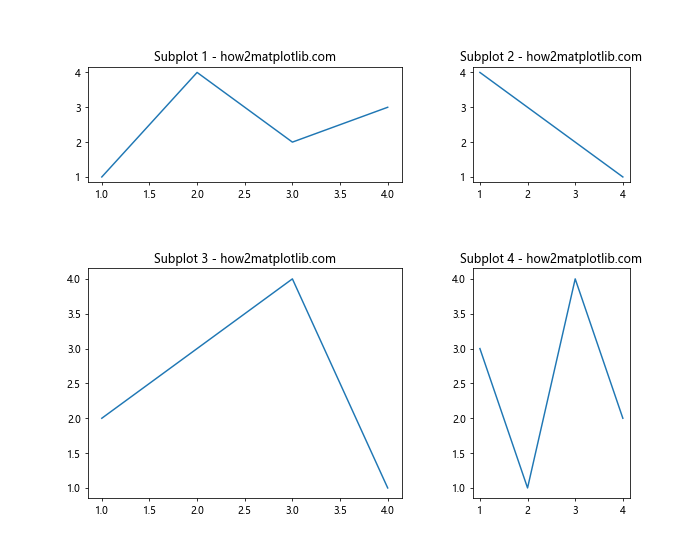
In this example, we create a 2×2 grid of subplots with unequal sizes and spacing. The width_ratios and height_ratios parameters control the relative sizes of the subplots, while wspace and hspace control the horizontal and vertical spacing between subplots, respectively.
Combining Different Plot Types in Subplots of Various Sizes
One of the advantages of creating subplots with different sizes is the ability to combine various plot types in a single figure. This can be particularly useful when you want to highlight certain aspects of your data or provide different perspectives on the same dataset.
Here’s an example of how to combine different plot types in subplots of various sizes:
import matplotlib.pyplot as plt
import numpy as np

fig = plt.figure(figsize=(12, 8))
gs = plt.GridSpec(2, 3, width_ratios=[1, 1, 2], height_ratios=[1, 1.5])

ax1 = fig.add_subplot(gs[0, 0])
ax2 = fig.add_subplot(gs[0, 1])
ax3 = fig.add_subplot(gs[0, 2])
ax4 = fig.add_subplot(gs[1, :])

x = np.linspace(0, 10, 100)
y1 = np.sin(x)
y2 = np.cos(x)

ax1.plot(x, y1)
ax1.set_title('Line Plot - how2matplotlib.com')

ax2.scatter(x[::10], y2[::10])
ax2.set_title('Scatter Plot - how2matplotlib.com')

ax3.bar(x[::10], y1[::10])
ax3.set_title('Bar Plot - how2matplotlib.com')

ax4.pcolormesh(x.reshape(10, 10), y1.reshape(10, 10), y2.reshape(10, 10))
ax4.set_title('Heatmap - how2matplotlib.com')

plt.tight_layout()
plt.show()
Output:
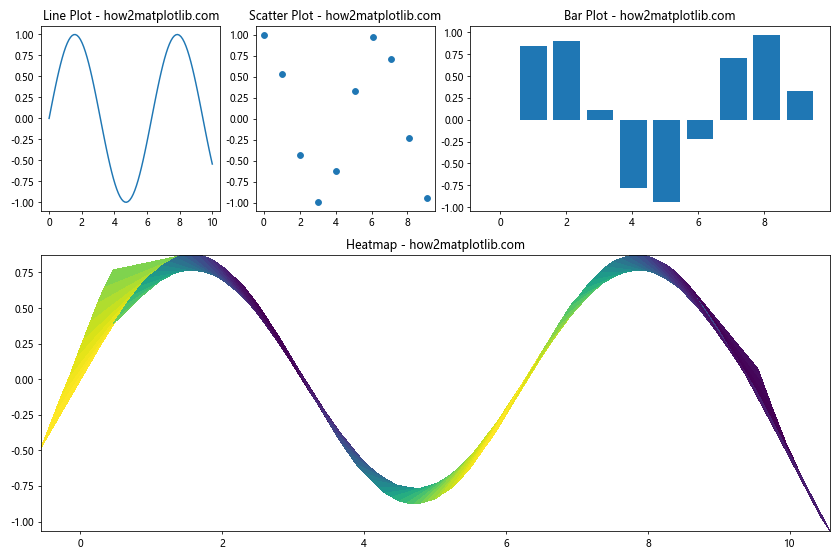
In this example, we create four subplots of different sizes and combine various plot types: a line plot, a scatter plot, a bar plot, and a heatmap. This demonstrates how you can use subplots of different sizes to effectively showcase multiple aspects of your data in a single figure.
Creating Subplots with Shared Axes
When creating subplots with different sizes, you may want to share axes between certain subplots to maintain consistency and facilitate comparison. Matplotlib provides options to share x-axes, y-axes, or both between subplots.
Here’s an example of how to create subplots with shared axes:
import matplotlib.pyplot as plt
import numpy as np

fig = plt.figure(figsize=(12, 8))
gs = plt.GridSpec(2, 2, width_ratios=[2, 1], height_ratios=[1, 2])

ax1 = fig.add_subplot(gs[0, 0])
ax2 = fig.add_subplot(gs[0, 1], sharey=ax1)
ax3 = fig.add_subplot(gs[1, 0], sharex=ax1)
ax4 = fig.add_subplot(gs[1, 1])

x = np.linspace(0, 10, 100)
y1 = np.sin(x)
y2 = np.cos(x)

ax1.plot(x, y1)
ax2.plot(x, y2)
ax3.plot(x, y1 * y2)
ax4.plot(x, y1 + y2)

ax1.set_title('Subplot 1 - how2matplotlib.com')
ax2.set_title('Subplot 2 - how2matplotlib.com')
ax3.set_title('Subplot 3 - how2matplotlib.com')
ax4.set_title('Subplot 4 - how2matplotlib.com')

plt.tight_layout()
plt.show()
Output:
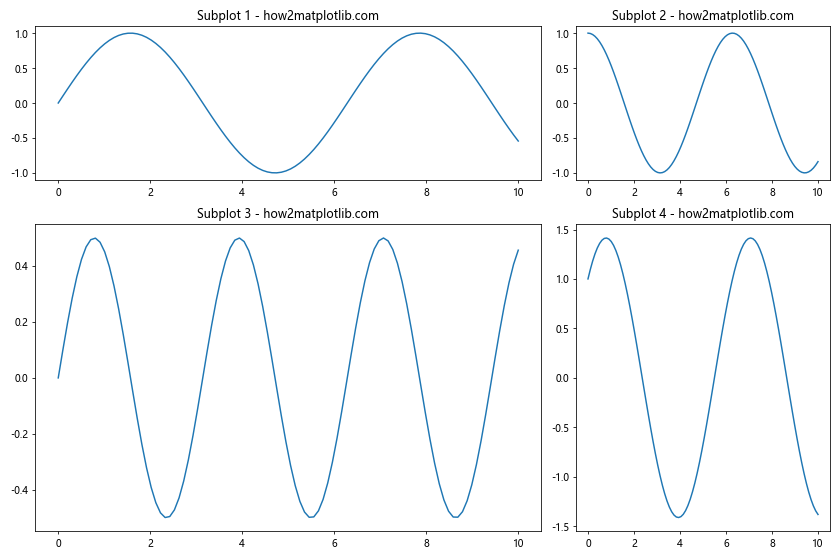
In this example, we create four subplots with different sizes and share axes between some of them. Subplot 2 shares its y-axis with Subplot 1, while Subplot 3 shares its x-axis with Subplot 1. This approach helps maintain consistency across related plots and makes it easier to compare data across subplots.
Adding Colorbars to Subplots of Different Sizes
When working with plots that use color mappings, such as heatmaps or scatter plots with color-coded data points, it’s often necessary to add colorbars to provide context for the color scale. Adding colorbars to subplots of different sizes requires some additional considerations to ensure proper alignment and sizing.
Here’s an example of how to add colorbars to subplots of different sizes:
import matplotlib.pyplot as plt
import numpy as np

fig = plt.figure(figsize=(12, 8))
gs = plt.GridSpec(2, 2, width_ratios=[2, 1], height_ratios=[1, 2])

ax1 = fig.add_subplot(gs[0, 0])
ax2 = fig.add_subplot(gs[0, 1])
ax3 = fig.add_subplot(gs[1, :])

x = np.linspace(0, 10, 100)
y = np.linspace(0, 10, 100)
X, Y = np.meshgrid(x, y)
Z1 = np.sin(X) * np.cos(Y)
Z2 = np.cos(X) * np.sin(Y)

im1 = ax1.pcolormesh(X, Y, Z1, cmap='viridis')
im2 = ax2.pcolormesh(X, Y, Z2, cmap='plasma')
im3 = ax3.pcolormesh(X, Y, Z1 * Z2, cmap='coolwarm')

fig.colorbar(im1, ax=ax1, label='Colorbar 1 - how2matplotlib.com')
fig.colorbar(im2, ax=ax2, label='Colorbar 2 - how2matplotlib.com')
fig.colorbar(im3, ax=ax3, orientation='horizontal', label='Colorbar 3 - how2matplotlib.com')

ax1.set_title('Subplot 1 - how2matplotlib.com')
ax2.set_title('Subplot 2 - how2matplotlib.com')
ax3.set_title('Subplot 3 - how2matplotlib.com')

plt.tight_layout()
plt.show()
Output:
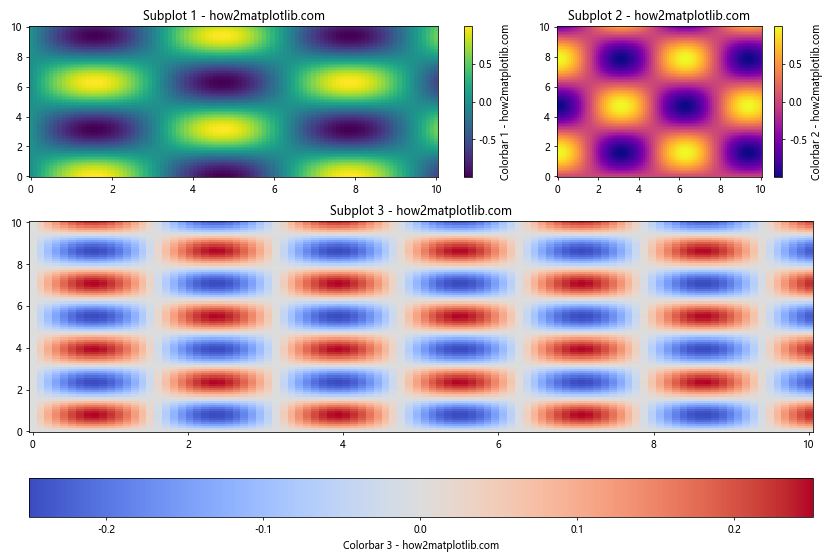
In this example, we create three subplots of different sizes, each containing a heatmap. We add colorbars to each subplot, adjusting their orientation and size to fit the layout. The fig.colorbar() function is used to create and position the colorbars relative to their respective subplots.
Creating Inset Axes within Subplots
Sometimes, you may want to add smaller plots within larger subplots to highlight specific details or provide additional context. Matplotlib allows you to create inset axes within subplots using the inset_axes() function.
Here’s an example of how to create inset axes within subplots of different sizes:
import matplotlib.pyplot as plt
import numpy as np
from mpl_toolkits.axes_grid1.inset_locator import inset_axes

fig, (ax1, ax2) = plt.subplots(1, 2, figsize=(12, 6), width_ratios=[2, 1])

x = np.linspace(0, 10, 1000)
y1 = np.sin(x)
y2 = np.cos(x)

ax1.plot(x, y1, label='sin(x)')
ax1.set_title('Main Plot 1 - how2matplotlib.com')
ax1.legend()

ax2.plot(x, y2, label='cos(x)')
ax2.set_title('Main Plot 2 - how2matplotlib.com')
ax2.legend()

# Create inset axes for ax1
axins1 = inset_axes(ax1, width="40%", height="30%", loc=1)
axins1.plot(x, y1)
axins1.set_xlim(4, 6)
axins1.set_ylim(-0.2, 1)
axins1.set_title('Inset 1 - how2matplotlib.com')

# Create inset axes for ax2
axins2 = inset_axes(ax2, width="50%", height="40%", loc=3)
axins2.plot(x, y2)
axins2.set_xlim(2, 4)
axins2.set_ylim(-1, 0.2)
axins2.set_title('Inset 2 - how2matplotlib.com')

plt.tight_layout()
plt.show()
Output:
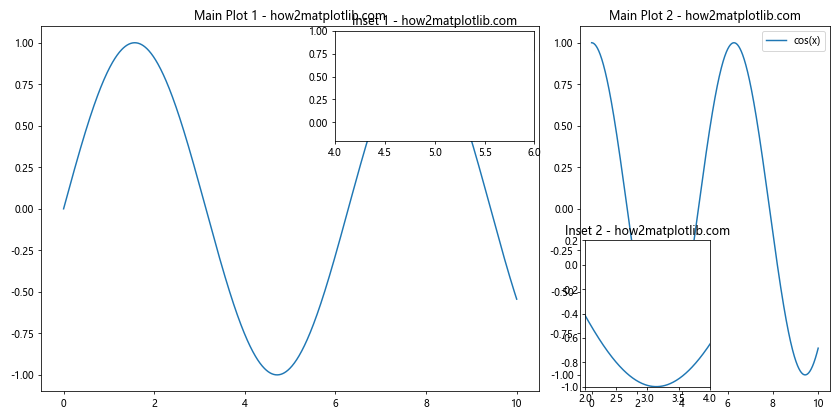
In this example, we create two main subplots of different sizes and add inset axes to each of them. The inset axes highlight specific regions of the main plots, providing a zoomed-in view of the data. The inset_axes() function allows you to specify the size and position of the inset axes relative to their parent subplot.
Combining Subplots with Different Aspect Ratios
When creating subplots with different sizes, you may encounter situations where you need to combine plots with different aspect ratios. Matplotlib provides tools to handle this scenario effectively.
Here’s an example of how to combine subplots with different aspect ratios:
import matplotlib.pyplot as plt
import numpy as np

fig = plt.figure(figsize=(12, 8))
gs = plt.GridSpec(2, 2, width_ratios=[1, 2], height_ratios=[2, 1])

ax1 = fig.add_subplot(gs[0, 0])
ax2 = fig.add_subplot(gs[0, 1])
ax3 = fig.add_subplot(gs[1, :])

x = np.linspace(0, 10, 100)
y1 = np.sin(x)
y2 = np.cos(x)

ax1.plot(x, y1)
ax1.set_title('Square Plot - how2matplotlib.com')
ax1.set_aspect('equal', adjustable='box')

ax2.plot(x, y2)
ax2.set_title('Wide Plot - how2matplotlib.com')
ax2.set_aspect(0.5)

ax3.plot(x, y1 * y2)
ax3.set_title('Full Width Plot - how2matplotlib.com')
ax3.set_aspect('auto')

plt.tight_layout()
plt.show()
Output:
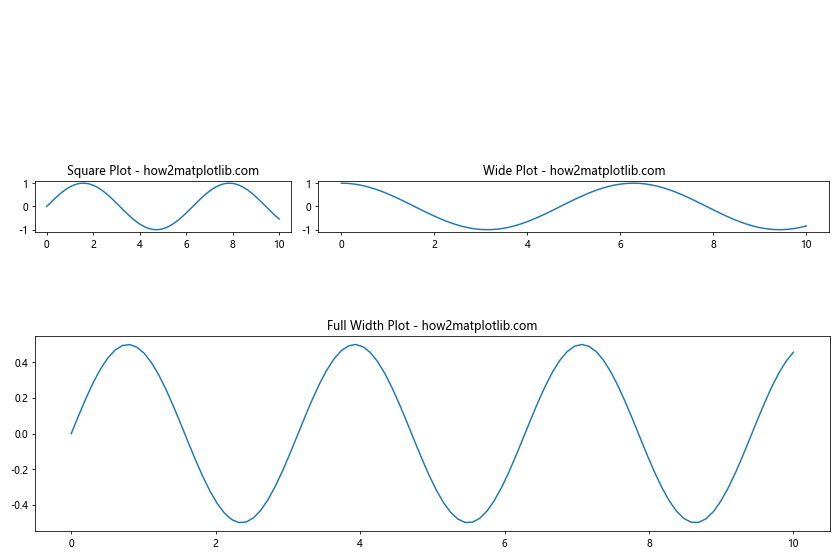
In this example, we create three subplots with different aspect ratios: a square plot, a wide plot, and a full-width plot. We use the set_aspect() method to control the aspect ratio of each subplot, allowing us to combine plots with different proportions effectively.
Creating Subplots with Overlapping Content
In some cases, you may want to create subplots with overlapping content to highlight relationships between different plots or to save space. Matplotlib allows you to create overlapping subplots using the zorder parameter and transparent backgrounds.
Here’s an example of how to create subplots with overlapping content:
import matplotlib.pyplot as plt
import numpy as np

fig, ax = plt.subplots(figsize=(10, 8))

x = np.linspace(0, 10, 100)
y1 = np.sin(x)
y2 = np.cos(x)

ax.plot(x, y1, color='blue', label='sin(x)')
ax.set_xlabel('X-axis')
ax.set_ylabel('Y-axis')
ax.set_title('Main Plot - how2matplotlib.com')
ax.legend(loc='upper left')

# Create an overlapping subplot
ax_inset = fig.add_axes([0.5, 0.5, 0.35, 0.35])
ax_inset.plot(x, y2, color='red', label='cos(x)')
ax_inset.set_title('Overlapping Plot - how2matplotlib.com')
ax_inset.legend(loc='upper right')
ax_inset.set_facecolor('white')
ax_inset.set_alpha(0.8)
ax_inset.set_zorder(2)

plt.show()
Output:
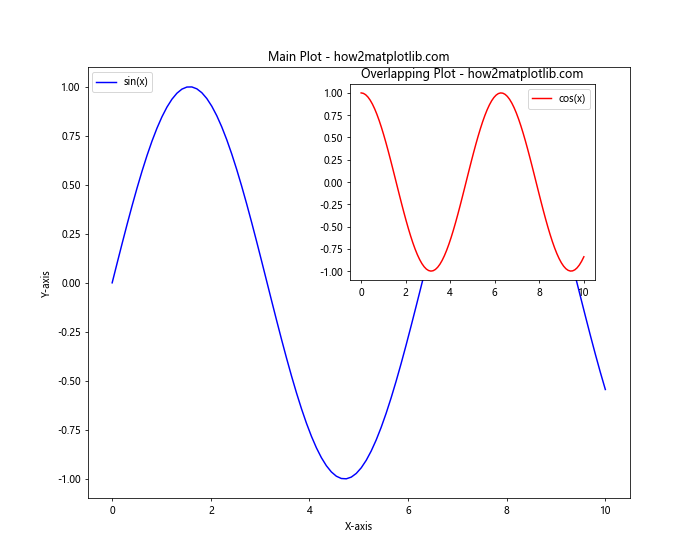
In this example, we create a main plot and an overlapping subplot. The overlapping subplot is positioned using fig.add_axes() with specific coordinates. We set a white background with partial transparency using set_facecolor() and set_alpha(). The set_zorder() method ensures that the overlapping subplot appears on top of the main plot.
Conclusion: Mastering Different Subplot Sizes in Matplotlib
Throughout this comprehensive guide, we’ve explored various methods and techniques for creating subplots with different sizes in Matplotlib. From using GridSpec for flexible layouts to employing add_axes() for precise control, we’ve covered a wide range of approaches to suit different visualization needs.
Key takeaways from this guide include:
- Understanding the basics of subplots and their importance in data visualization
- Using GridSpec for creating complex layouts with subplots of different sizes
- Employing add_axes() for precise subplot placement and sizing
- Combining subplot() and set_position() for flexible subplot arrangements
- Creating nested GridSpec structures for hierarchical layouts
- Adjusting subplot sizes dynamically using tight_layout() and constrained_layout
- Creating subplots with unequal spacing and combining different plot types
- Sharing axes between subplots of different sizes
- Adding colorbars to subplots with varying dimensions
- Creating inset axes within subplots for detailed views
- Adjusting subplot sizes for different screen resolutions
- Combining subplots with different aspect ratios
- Creating overlapping subplots for compact visualizations
By mastering these techniques, you’ll be able to create more sophisticated and visually appealing data visualizations using Matplotlib. Remember to experiment with different approaches and combinations to find the best layout for your specific data and storytelling needs.