How to Master Matplotlib Xticks Rotation: A Comprehensive Guide
Matplotlib xticks rotation is an essential technique for improving the readability and aesthetics of your plots. By rotating the x-axis labels, you can effectively handle long or overlapping text, making your visualizations more professional and easier to interpret. In this comprehensive guide, we’ll explore various aspects of matplotlib xticks rotation, providing you with the knowledge and tools to enhance your data visualization skills.
Understanding Matplotlib Xticks Rotation
Matplotlib xticks rotation refers to the process of changing the angle of the labels on the x-axis of a plot. This technique is particularly useful when dealing with long labels or when you have many labels that would otherwise overlap. By rotating the xticks, you can make your plots more legible and visually appealing.
Let’s start with a basic example to demonstrate matplotlib xticks rotation:
import matplotlib.pyplot as plt

# Data
x = ['Category A', 'Category B', 'Category C', 'Category D']
y = [10, 25, 15, 30]

# Create the plot
plt.figure(figsize=(8, 6))
plt.bar(x, y)

# Rotate xticks
plt.xticks(rotation=45)

# Add labels and title
plt.xlabel('Categories from how2matplotlib.com')
plt.ylabel('Values')
plt.title('Basic Matplotlib Xticks Rotation Example')

# Show the plot
plt.tight_layout()
plt.show()
Output:
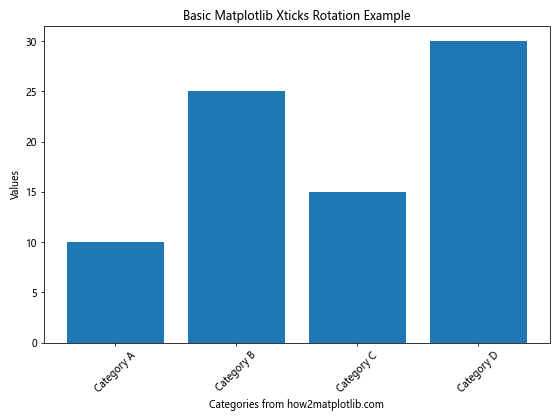
In this example, we’ve created a simple bar plot and applied a 45-degree rotation to the xticks using plt.xticks(rotation=45). This basic matplotlib xticks rotation technique immediately improves the readability of the x-axis labels.
Exploring Different Rotation Angles
Matplotlib xticks rotation allows you to experiment with various angles to find the best fit for your data. Common rotation angles include 45, 90, and -45 degrees, but you can use any angle between 0 and 360 degrees.
Let’s compare different matplotlib xticks rotation angles:
import matplotlib.pyplot as plt

# Data
x = ['Long Category A', 'Long Category B', 'Long Category C', 'Long Category D']
y = [15, 30, 25, 20]

# Create subplots
fig, (ax1, ax2, ax3) = plt.subplots(1, 3, figsize=(15, 5))

# Plot with 30-degree rotation
ax1.bar(x, y)
ax1.set_xticklabels(x, rotation=30)
ax1.set_title('30-degree Rotation')

# Plot with 45-degree rotation
ax2.bar(x, y)
ax2.set_xticklabels(x, rotation=45)
ax2.set_title('45-degree Rotation')

# Plot with 90-degree rotation
ax3.bar(x, y)
ax3.set_xticklabels(x, rotation=90)
ax3.set_title('90-degree Rotation')

# Add overall title
fig.suptitle('Comparing Matplotlib Xticks Rotation Angles - how2matplotlib.com')

# Adjust layout and show the plot
plt.tight_layout()
plt.show()
Output:
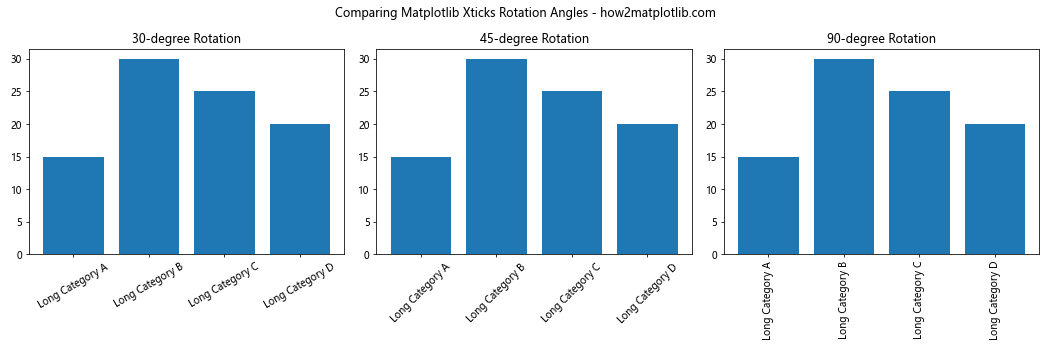
This example demonstrates how different matplotlib xticks rotation angles affect the appearance of your plot. The 30-degree rotation provides a slight tilt, the 45-degree rotation offers a balanced look, and the 90-degree rotation presents vertical labels.
Customizing Matplotlib Xticks Rotation
Matplotlib xticks rotation can be further customized to meet your specific needs. You can adjust the alignment, font properties, and even apply rotation to individual labels.
Here’s an example showcasing various customization options for matplotlib xticks rotation:
import matplotlib.pyplot as plt

# Data
x = ['A', 'B', 'C', 'D', 'E']
y = [10, 25, 15, 30, 20]

# Create the plot
plt.figure(figsize=(10, 6))
plt.bar(x, y)

# Customize xticks rotation
plt.xticks(rotation=45, ha='right', fontweight='bold', fontsize=12)

# Add labels and title
plt.xlabel('Categories from how2matplotlib.com', fontsize=14)
plt.ylabel('Values', fontsize=14)
plt.title('Customized Matplotlib Xticks Rotation', fontsize=16)

# Show the plot
plt.tight_layout()
plt.show()
Output:
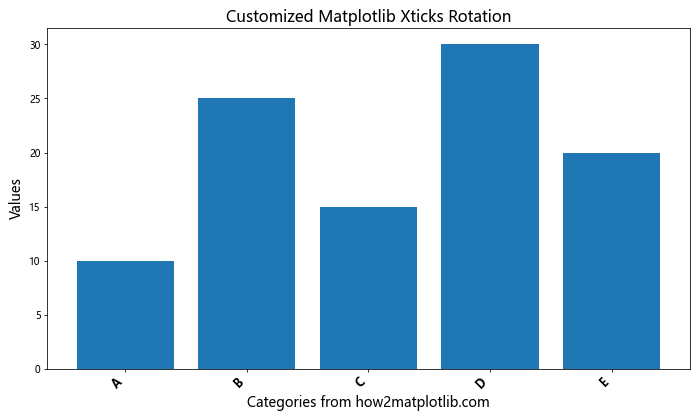
In this example, we’ve applied a 45-degree matplotlib xticks rotation while also adjusting the horizontal alignment (ha='right'), font weight, and font size. These customizations allow you to fine-tune the appearance of your x-axis labels.
Handling Long Labels with Matplotlib Xticks Rotation
One of the primary use cases for matplotlib xticks rotation is dealing with long labels that would otherwise overlap or extend beyond the plot area. Let’s explore how to effectively handle long labels using matplotlib xticks rotation:
import matplotlib.pyplot as plt

# Data
x = ['Very Long Category A', 'Extremely Long Category B', 'Incredibly Long Category C', 'Unbelievably Long Category D']
y = [15, 30, 25, 20]

# Create the plot
plt.figure(figsize=(12, 6))
plt.bar(x, y)

# Rotate and align the tick labels
plt.xticks(rotation=45, ha='right')

# Add labels and title
plt.xlabel('Categories from how2matplotlib.com', fontsize=12)
plt.ylabel('Values', fontsize=12)
plt.title('Handling Long Labels with Matplotlib Xticks Rotation', fontsize=14)

# Adjust the subplot layout
plt.tight_layout()

# Show the plot
plt.show()
Output:
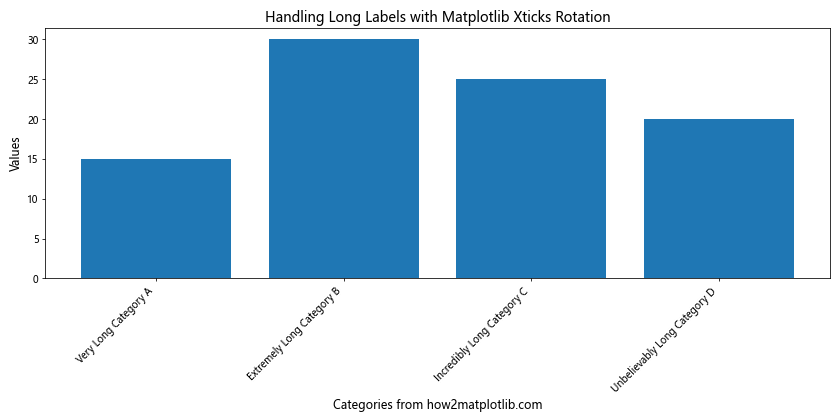
This example demonstrates how matplotlib xticks rotation can effectively handle long category labels. By rotating the labels and adjusting their alignment, we prevent overlap and ensure all text is visible.
Matplotlib Xticks Rotation in Time Series Plots
Time series plots often benefit from matplotlib xticks rotation, especially when dealing with date and time labels. Let’s create a time series plot with rotated xticks:
import matplotlib.pyplot as plt
import pandas as pd

# Create sample time series data
dates = pd.date_range(start='2023-01-01', end='2023-12-31', freq='M')
values = [10, 15, 13, 18, 20, 25, 23, 26, 28, 30, 27, 29]

# Create the plot
plt.figure(figsize=(12, 6))
plt.plot(dates, values, marker='o')

# Rotate and format the xticks
plt.xticks(rotation=45)
plt.gca().xaxis.set_major_formatter(plt.matplotlib.dates.DateFormatter('%Y-%m-%d'))

# Add labels and title
plt.xlabel('Date from how2matplotlib.com', fontsize=12)
plt.ylabel('Values', fontsize=12)
plt.title('Time Series Plot with Matplotlib Xticks Rotation', fontsize=14)

# Adjust the subplot layout
plt.tight_layout()

# Show the plot
plt.show()
Output:
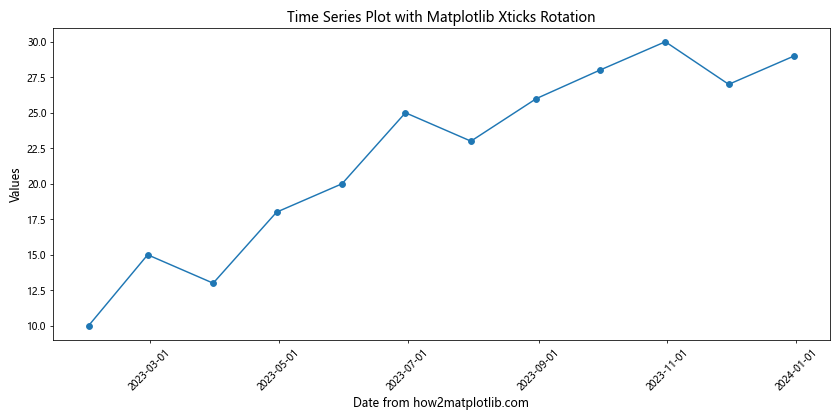
In this time series example, we’ve applied matplotlib xticks rotation to the date labels, making them easier to read. We’ve also used a date formatter to control the display format of the dates.
Matplotlib Xticks Rotation in Subplots
When working with multiple subplots, you may need to apply matplotlib xticks rotation to each subplot individually. Here’s an example demonstrating this technique:
import matplotlib.pyplot as plt

# Data
categories = ['A', 'B', 'C', 'D', 'E']
values1 = [10, 15, 13, 18, 20]
values2 = [8, 12, 15, 10, 14]

# Create subplots
fig, (ax1, ax2) = plt.subplots(2, 1, figsize=(10, 10))

# Plot data on the first subplot
ax1.bar(categories, values1)
ax1.set_title('Subplot 1')
ax1.set_xticklabels(categories, rotation=45, ha='right')

# Plot data on the second subplot
ax2.bar(categories, values2)
ax2.set_title('Subplot 2')
ax2.set_xticklabels(categories, rotation=45, ha='right')

# Add overall title
fig.suptitle('Matplotlib Xticks Rotation in Subplots - how2matplotlib.com', fontsize=16)

# Adjust the layout
plt.tight_layout()

# Show the plot
plt.show()
Output:
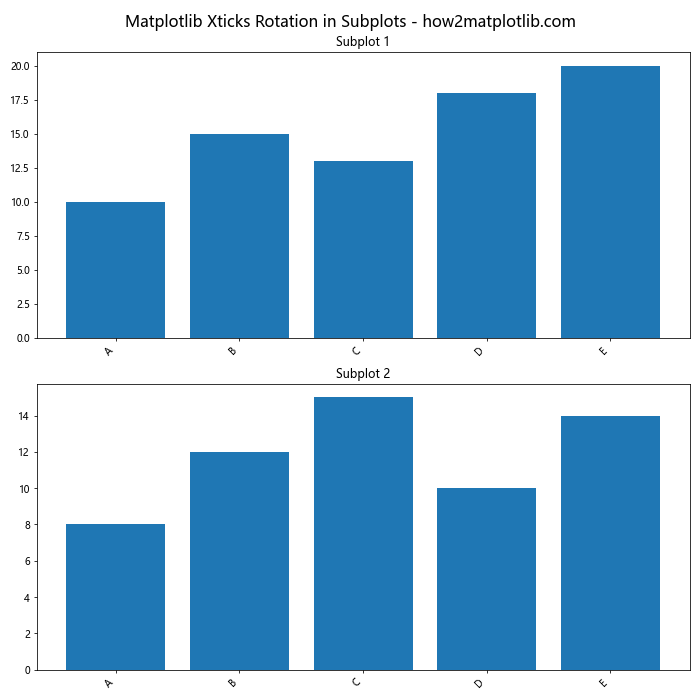
This example shows how to apply matplotlib xticks rotation to multiple subplots, ensuring consistency across your visualizations.
Advanced Matplotlib Xticks Rotation Techniques
For more complex visualizations, you might need to employ advanced matplotlib xticks rotation techniques. Let’s explore some of these methods:
1. Alternating Label Rotation
import matplotlib.pyplot as plt

# Data
x = ['Category A', 'Category B', 'Category C', 'Category D', 'Category E', 'Category F']
y = [10, 25, 15, 30, 20, 35]

# Create the plot
plt.figure(figsize=(12, 6))
plt.bar(x, y)

# Apply alternating rotation to xticks
for i, label in enumerate(plt.gca().get_xticklabels()):
    if i % 2 == 0:
        label.set_rotation(45)
    else:
        label.set_rotation(-45)
    label.set_ha('right' if i % 2 == 0 else 'left')

# Add labels and title
plt.xlabel('Categories from how2matplotlib.com', fontsize=12)
plt.ylabel('Values', fontsize=12)
plt.title('Alternating Matplotlib Xticks Rotation', fontsize=14)

# Adjust the layout
plt.tight_layout()

# Show the plot
plt.show()
Output:
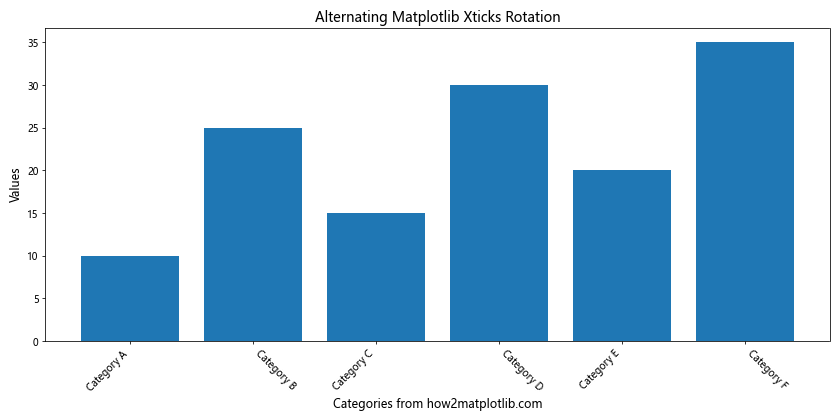
This advanced technique alternates the rotation direction of xticks, creating an interesting visual effect while maintaining readability.
2. Dynamic Rotation Based on Label Length
import matplotlib.pyplot as plt

# Data
x = ['Short', 'Medium Length', 'Very Long Category', 'Longer Category Name']
y = [10, 25, 15, 30]

# Create the plot
plt.figure(figsize=(12, 6))
plt.bar(x, y)

# Apply dynamic rotation based on label length
for label in plt.gca().get_xticklabels():
    if len(label.get_text()) > 10:
        label.set_rotation(45)
        label.set_ha('right')
    else:
        label.set_rotation(0)
        label.set_ha('center')

# Add labels and title
plt.xlabel('Categories from how2matplotlib.com', fontsize=12)
plt.ylabel('Values', fontsize=12)
plt.title('Dynamic Matplotlib Xticks Rotation', fontsize=14)

# Adjust the layout
plt.tight_layout()

# Show the plot
plt.show()
Output:
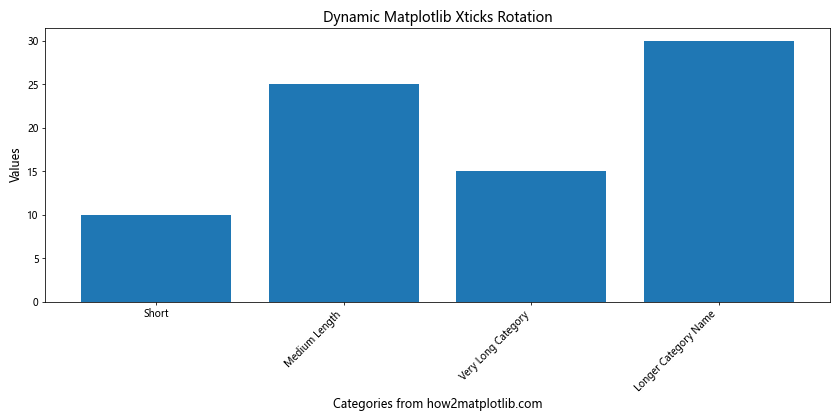
This example demonstrates how to dynamically adjust matplotlib xticks rotation based on the length of each label, providing optimal readability for mixed-length categories.
Matplotlib Xticks Rotation in Different Plot Types
Matplotlib xticks rotation can be applied to various types of plots. Let’s explore how to use this technique with different chart types:
1. Line Plot with Rotated Xticks
import matplotlib.pyplot as plt

# Data
x = ['Jan', 'Feb', 'Mar', 'Apr', 'May', 'Jun']
y = [10, 15, 13, 18, 20, 25]

# Create the line plot
plt.figure(figsize=(10, 6))
plt.plot(x, y, marker='o')

# Rotate xticks
plt.xticks(rotation=45)

# Add labels and title
plt.xlabel('Months from how2matplotlib.com', fontsize=12)
plt.ylabel('Values', fontsize=12)
plt.title('Line Plot with Matplotlib Xticks Rotation', fontsize=14)

# Adjust the layout
plt.tight_layout()

# Show the plot
plt.show()
Output:
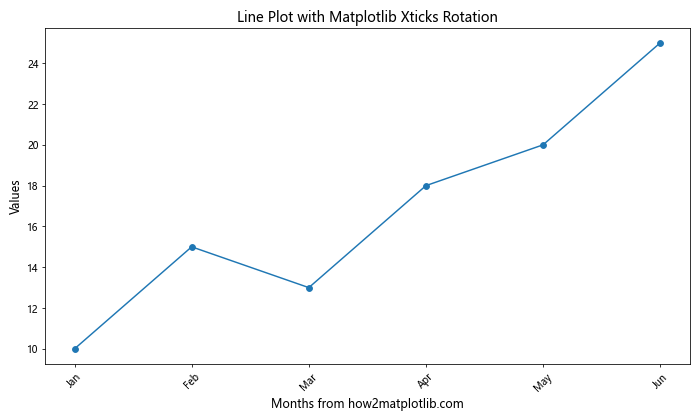
This example shows how to apply matplotlib xticks rotation to a simple line plot, improving the readability of the x-axis labels.
2. Scatter Plot with Rotated Xticks
import matplotlib.pyplot as plt
import numpy as np

# Data
x = np.arange(10)
y = np.random.rand(10)
labels = [f'Point {i}' for i in range(10)]

# Create the scatter plot
plt.figure(figsize=(10, 6))
plt.scatter(x, y)

# Set and rotate xticks
plt.xticks(x, labels, rotation=45, ha='right')

# Add labels and title
plt.xlabel('Categories from how2matplotlib.com', fontsize=12)
plt.ylabel('Values', fontsize=12)
plt.title('Scatter Plot with Matplotlib Xticks Rotation', fontsize=14)

# Adjust the layout
plt.tight_layout()

# Show the plot
plt.show()
Output:
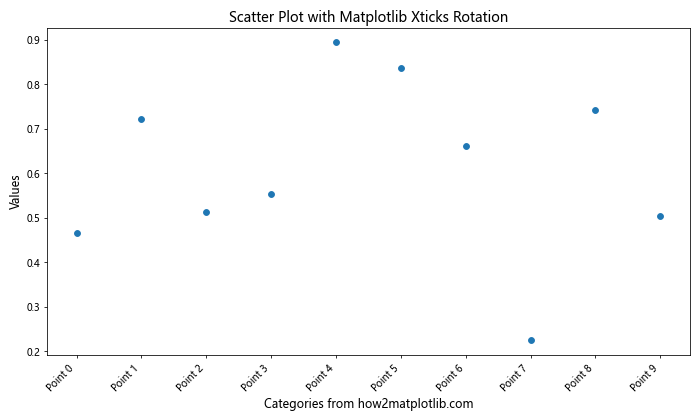
This scatter plot example demonstrates how matplotlib xticks rotation can be applied to numeric x-axis values with custom labels.
3. Stacked Bar Chart with Rotated Xticks
import matplotlib.pyplot as plt
import numpy as np

# Data
categories = ['A', 'B', 'C', 'D', 'E']
values1 = [10, 15, 13, 18, 20]
values2 = [5, 8, 7, 10, 12]

# Create the stacked bar chart
plt.figure(figsize=(10, 6))
plt.bar(categories, values1, label='Group 1')
plt.bar(categories, values2, bottom=values1, label='Group 2')

# Rotate xticks
plt.xticks(rotation=45, ha='right')

# Add labels and title
plt.xlabel('Categories from how2matplotlib.com', fontsize=12)
plt.ylabel('Values', fontsize=12)
plt.title('Stacked Bar Chart with Matplotlib Xticks Rotation', fontsize=14)
plt.legend()

# Adjust the layout
plt.tight_layout()

# Show the plot
plt.show()
Output:
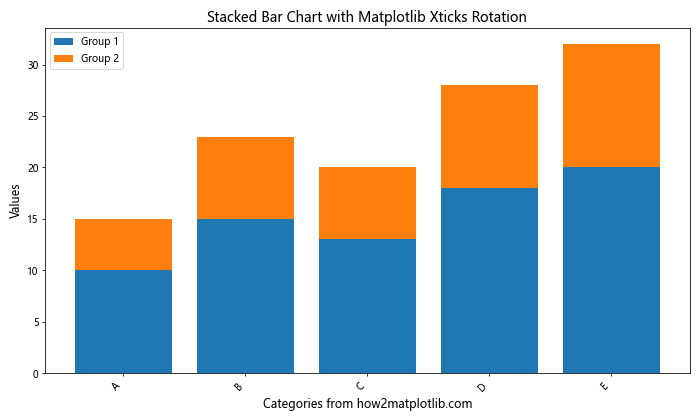
This example shows how matplotlib xticks rotation can be applied to a stacked bar chart, enhancing the overall readability of the plot.
Best Practices for Matplotlib Xticks Rotation
When working with matplotlib xticks rotation, it’s important to follow some best practices to ensure your plots are both visually appealing and easy to interpret. Here are some key guidelines:
- Choose the right angle: Experiment with different rotation angles to find the best balance between readability and space efficiency. Common angles include 45, 30, and 90 degrees.
Align labels properly: Use the
ha(horizontal alignment) parameter to ensure your rotated labels are aligned correctly. For example,ha='right'works well with 45-degree rotation.Adjust figure size: Increase the figure size if needed to accommodate rotated labels without overlapping or extending beyond the plot area.
Use
tight_layout(): Always callplt.tight_layout()before showing or saving your plot to automatically adjust the layout and prevent cut-off labels.Consider font size: Adjust the font size of your labels to maintain readability after rotation. Smaller fonts may be necessary for longer labels.
Be consistent: If you’re creating multiple plots, try to use consistent rotation angles and styles across all of them for a cohesive look.
Use subplots for complex data: If you have many categories or long labels, consider using subplots to give each category more space.
Let’s implement these best practices in an example: