Boxplot in Matplotlib
Boxplot in Matplotlib Introduction
A boxplot, also known as a box-and-whisker plot, is a type of chart often used to visualize the distribution of data and identify outliers. In this article, we will explore how to create boxplots using Matplotlib, a popular Python library for data visualization.
Boxplot in Matplotlib Getting Started
Before we can begin creating boxplots using Matplotlib, we need to install the library if it is not already installed. You can install Matplotlib using the following command:
pip install matplotlib
Once Matplotlib is installed, we can import the necessary modules and start creating our boxplots.
import matplotlib.pyplot as plt
import numpy as np
Basic Boxplot
Let’s start by creating a basic boxplot using random data. In this example, we will generate a random sample of numbers and create a boxplot to visualize the distribution.
import matplotlib.pyplot as plt
import numpy as np

data = np.random.normal(loc=0, scale=1, size=100)
plt.boxplot(data)
plt.show()
Output:
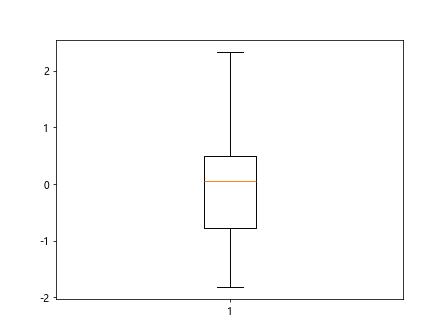
In the code snippet above, we first generate a random sample of 100 numbers from a normal distribution with mean 0 and standard deviation 1. We then create a boxplot using plt.boxplot(data) and display the plot using plt.show().
Horizontal Boxplot
We can also create a horizontal boxplot by setting the vert parameter to False in the boxplot() function. Let’s create a horizontal boxplot using the same random data as before.
import matplotlib.pyplot as plt
import numpy as np

data = np.random.normal(loc=0, scale=1, size=100)

plt.boxplot(data, vert=False)
plt.show()
Output:
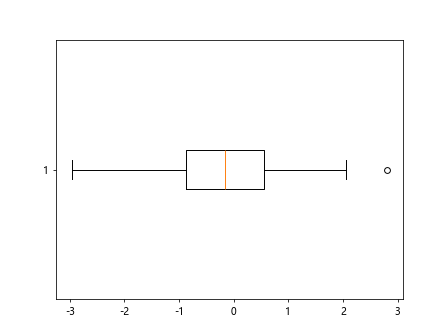
In the code above, we pass vert=False to the boxplot() function to create a horizontal boxplot.
Customizing Boxplot
We can customize the appearance of the boxplot by changing various parameters such as colors, widths, and styles. Let’s create a customized boxplot with different colors for the box and whiskers.
import matplotlib.pyplot as plt
import numpy as np

data = np.random.normal(loc=0, scale=1, size=100)

plt.boxplot(data, boxprops=dict(color="red"), whiskerprops=dict(color="blue"))
plt.show()
Output:
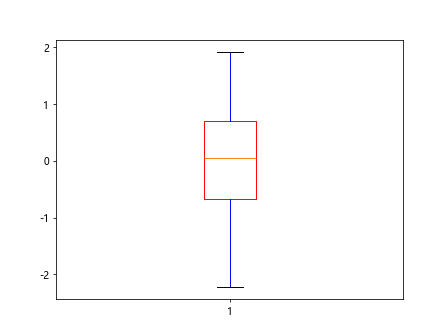
In the code snippet above, we customize the box color to red and the whiskers color to blue using the boxprops and whiskerprops arguments.
Grouped Boxplot
We can create grouped boxplots to compare the distribution of multiple datasets. Let’s generate two sets of random data and create a grouped boxplot to visualize the differences.
import matplotlib.pyplot as plt
import numpy as np

data1 = np.random.normal(loc=0, scale=1, size=100)
data2 = np.random.normal(loc=2, scale=1.5, size=100)

plt.boxplot([data1, data2])
plt.show()
Output:
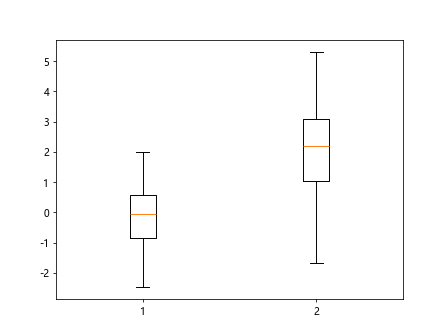
In the code above, we generate two sets of random data and pass them as a list to the boxplot() function to create a grouped boxplot.
Notched Boxplot
We can create a notched boxplot by setting the notch parameter to True in the boxplot() function. Notches on the boxplot can help us assess the uncertainty around the median.
import matplotlib.pyplot as plt
import numpy as np

data = np.random.normal(loc=0, scale=1, size=100)

plt.boxplot(data, notch=True)
plt.show()
Output:
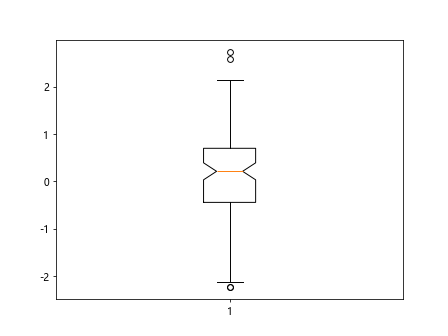
By setting notch=True, we create a notched boxplot that displays the confidence interval around the median.
Boxplot with Outliers
Boxplots are useful for identifying outliers in a dataset. We can create boxplots that highlight outliers using the showfliers parameter.
import matplotlib.pyplot as plt
import numpy as np

data_with_outliers = np.concatenate([data, [5, -5]])
plt.boxplot(data_with_outliers, showfliers=True)
plt.show()
In the code above, we concatenate outliers to the existing data and set showfliers=True to display the outliers in the boxplot.
Boxplot Color
We can change the color of the boxplot elements such as the box, whiskers, caps, and medians using the color parameter.
import matplotlib.pyplot as plt
import numpy as np

data = np.random.normal(loc=0, scale=1, size=100)

plt.boxplot(data, patch_artist=True, boxprops=dict(facecolor="lightblue"), whiskerprops=dict(color="green"))
plt.show()
Output:
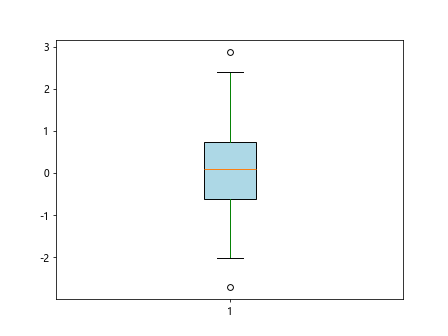
By setting patch_artist=True and using the boxprops and whiskerprops parameters, we can customize the color of various elements in the boxplot.
Boxplot Grid
We can add a grid to the boxplot to improve readability by setting the grid parameter to True.
import matplotlib.pyplot as plt
import numpy as np

data = np.random.normal(loc=0, scale=1, size=100)

plt.boxplot(data, grid=True)
plt.show()
Setting grid=True adds a grid to the boxplot, making it easier to read and interpret.
Boxplot Width
We can adjust the width of the boxplot using the widths parameter in the boxplot() function.
import matplotlib.pyplot as plt
import numpy as np

data = np.random.normal(loc=0, scale=1, size=100)

plt.boxplot(data, widths=0.3)
plt.show()
Output:
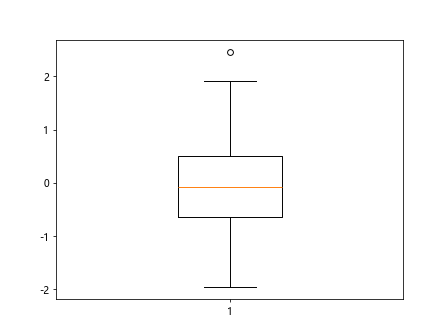
In the code snippet above, we set widths=0.3 to create a boxplot with narrower boxes.
Boxplot Orientation
We can change the orientation of the boxplot by setting the vert parameter to False for horizontal orientation.
import matplotlib.pyplot as plt
import numpy as np

data = np.random.normal(loc=0, scale=1, size=100)

plt.boxplot(data, vert=False)
plt.show()
Output:
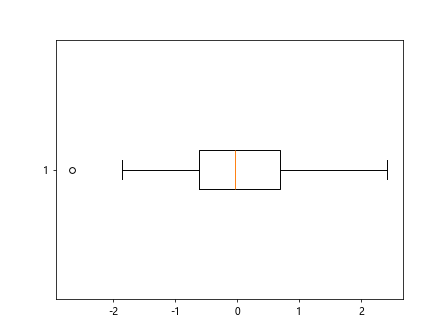
Setting vert=False creates a horizontal boxplot, as shown in the image above.
Boxplot Labels
We can add labels to the boxplot by setting the labels parameter to a list of strings representing the labels for each dataset.
import matplotlib.pyplot as plt
import numpy as np

data = np.random.normal(loc=0, scale=1, size=100)

labels = ["A", "B", "C", "D"]
data = [np.random.normal(loc=0, scale=1, size=100) for _ in range(len(labels))]

plt.boxplot(data, labels=labels)
plt.show()
Output:
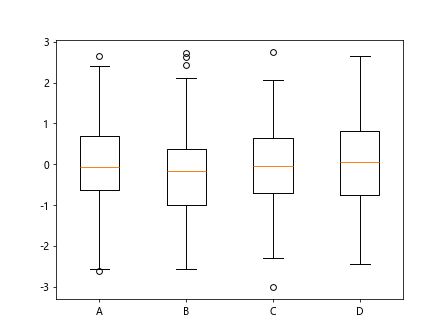
In the code snippet above, we create four datasets and pass a list of labels to the labels parameter in the boxplot() function for better understanding the boxplot.
Boxplot Notch Confidence Interval
We can adjust the confidence interval around the median for notched boxplots by setting the conf_intervals parameter.
import matplotlib.pyplot as plt
import numpy as np

data = np.random.normal(loc=0, scale=1, size=100)

plt.boxplot(data, notch=True, conf_intervals=[90])
plt.show()
By setting conf_intervals=[90], we change the confidence interval around the median to 90%, as shown in the image above.
Boxplot Capstyle
We can change the cap style of the boxplot by setting the capstyle parameter to control the style of the caps (whisker ends).
import matplotlib.pyplot as plt
import numpy as np

data = np.random.normal(loc=0, scale=1, size=100)

plt.boxplot(data, capstyle="round")
plt.show()
Setting capstyle="round" changes the cap style of the boxplot to round ends.
Boxplot Boxstyle
We can adjust the style of the box in the boxplot by setting the boxstyle parameter to control the shape of the box.
import matplotlib.pyplot as plt
import numpy as np

data = np.random.normal(loc=0, scale=1, size=100)

plt.boxplot(data, boxprops=dict(linewidth=2, linestyle="--", edgecolor="red"))
plt.show()
In the code above, we customize the box style by setting the linewidth, linestyle, and edgecolor for the box.
Boxplot Median Style
We can customize the appearance of the median line in the boxplot using the medianprops parameter.
import matplotlib.pyplot as plt
import numpy as np

data = np.random.normal(loc=0, scale=1, size=100)

plt.boxplot(data, medianprops=dict(color="purple", linewidth=2, linestyle="-."))
plt.show()
Output:
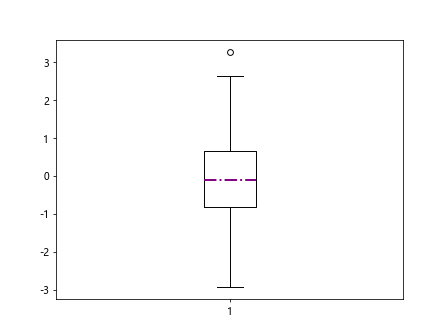
By setting the medianprops parameter, we adjust the color, linewidth, and linestyle of the median line in the boxplot.
Boxplot Whisker Style
We can change the style of the whiskers in the boxplot by setting the whiskerprops parameter.
import matplotlib.pyplot as plt
import numpy as np

data = np.random.normal(loc=0, scale=1, size=100)

plt.boxplot(data, whiskerprops=dict(color="orange", linestyle="dashed"))
plt.show()
Output:
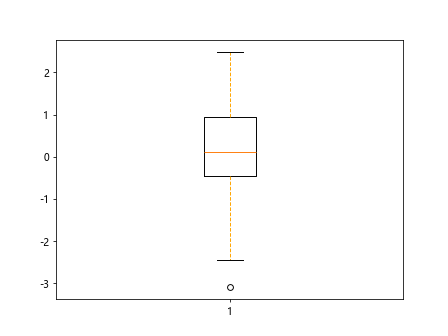
Setting whiskerprops allows us to adjust the color and linestyle of the whiskers in the boxplot.