Matplotlib Title Subplot
Matplotlib is a widely-used Python library for creating interactive plots and charts. It provides high-quality visualizations, which can be customized to meet specific requirements.
In this article, we will explore how to add titles to subplots in Matplotlib. Subplots allow us to create multiple plots within a single figure, making it easier to compare and analyze different datasets at once.
Adding Titles to Subplots
To add titles to subplots, we first need to create the subplots using the plt.subplots() function. We can then use the set_title() method on individual subplots to set their title.
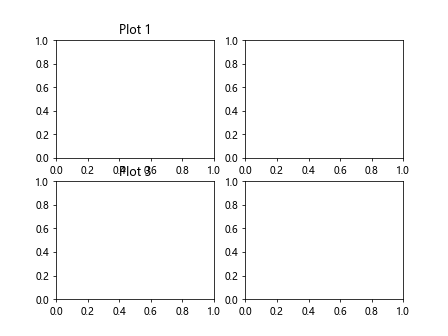
Here’s an example that demonstrates how to create a 2×2 grid of subplots and add titles to each of them:
import matplotlib.pyplot as plt

# Create subplots
fig, axs = plt.subplots(2, 2)

# Set titles for each subplot
axs[0, 0].set_title("Plot 1")
axs[0, 1].set_title("Plot 2")
axs[1, 0].set_title("Plot 3")
axs[1, 1].set_title("Plot 4")

plt.show()
Output:
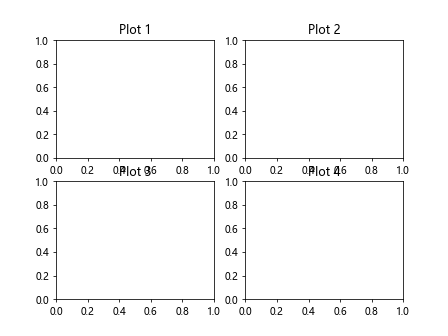
The plt.subplots(2, 2) function creates a 2×2 grid of subplots, and returns a figure object fig and an array of axes objects axs. We can access individual subplots using the indexing syntax axs[row, column], where row and column are zero-based indices.
The set_title() method is used to set the title for each subplot. Here, we set the titles to “Plot 1”, “Plot 2”, “Plot 3”, and “Plot 4” for the subplots in the top left, top right, bottom left, and bottom right positions, respectively.
When we call plt.show(), the subplots with their respective titles will be displayed.
Code Examples
Let’s look at some more code examples to further understand how to add titles to subplots in Matplotlib. The following examples demonstrate different scenarios:
Example 1: Setting a Single Title for All Subplots
In this example, we create a 2×2 grid of subplots and set a single title for all of them.
import matplotlib.pyplot as plt

# Create subplots
fig, axs = plt.subplots(2, 2)

# Set single title for all subplots
fig.suptitle("Subplots")

plt.show()
Output:
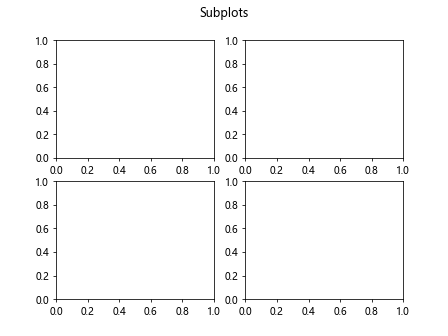
In this case, we use the fig.suptitle() method to set a single title for all of the subplots. The title is centered above the entire grid of subplots.
Example 2: Modifying Title Properties
In this example, we create a 2×2 grid of subplots and set titles with different properties for each of them.
import matplotlib.pyplot as plt

# Create subplots
fig, axs = plt.subplots(2, 2)

# Set titles with different properties
axs[0, 0].set_title("Plot 1", fontweight="bold", fontsize=12, color="red")
axs[0, 1].set_title("Plot 2", ha="right", fontsize=14, color="blue")
axs[1, 0].set_title("Plot 3", fontstyle="italic", fontsize=16, color="green")
axs[1, 1].set_title("Plot 4", ha="center", fontsize=18, color="purple")

plt.show()
Output:
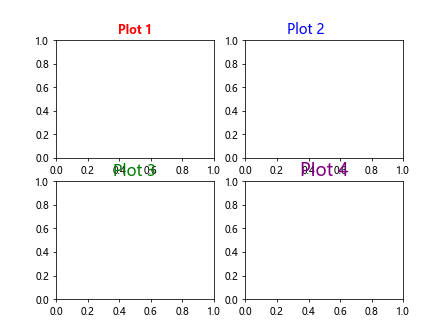
In this example, we set different title properties for each subplot using the respective keyword arguments of the set_title() method. We specify the font weight, font size, horizontal alignment (ha), and color for each title.
Example 3: Adding a Subtitle
In this example, we create a 1×2 grid of subplots and add a main title and a subtitle.
import matplotlib.pyplot as plt

# Create subplots
fig, axs = plt.subplots(1, 2)

# Set main and subtitle
fig.suptitle("Main Title")
fig.text(0.5, 0.9, "Subtitle", ha="center", fontsize=12)

plt.show()
Output:
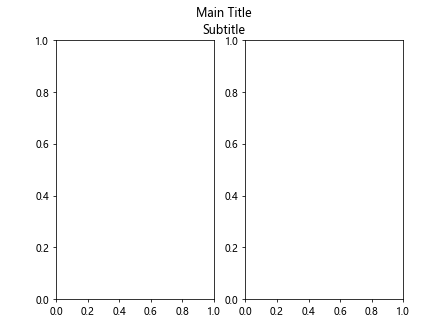
In this case, we use the fig.text() method to add a subtitle below the main title. We specify the x and y coordinates of the subtitle using normalized units (0 to 1), set the horizontal alignment to center, and specify the fontsize.
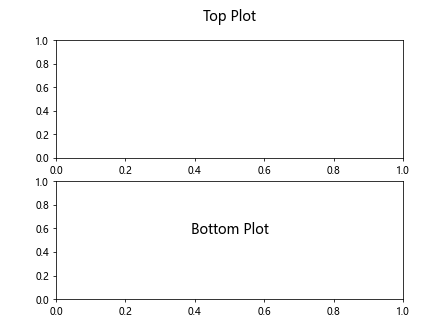
Example 4: Two Rows and One Column
In this example, we create a 2×1 grid of subplots and set titles for each row.
import matplotlib.pyplot as plt

# Create subplots
fig, axs = plt.subplots(2, 1)

# Set titles for each row
axs[0].set_title("Top Plot")
axs[1].set_title("Bottom Plot")

plt.show()
Output:
In this case, we set titles for each row by accessing the subplots using their zero-based index. The titles “Top Plot” and “Bottom Plot” are set for the subplots in the top and bottom rows, respectively.
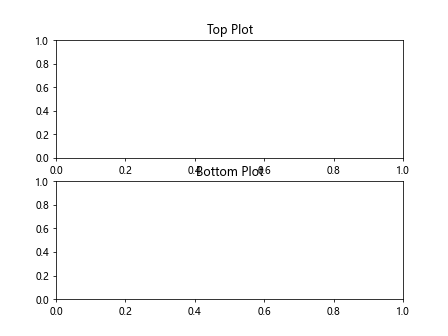
Example 5: Customizing the Title Position
In this example, we create a 2×1 grid of subplots and customize the position of the titles.
import matplotlib.pyplot as plt

# Create subplots
fig, axs = plt.subplots(2, 1)

# Set titles with custom position
axs[0].set_title("Top Plot", pad=20, fontsize=14)
axs[1].set_title("Bottom Plot", y=0.5, fontsize=14)

plt.show()
Output:
In this example, we use the pad parameter to add some spacing between the title and the plot. We set the y-coordinate of the second title using the y parameter to position it halfway vertically.
Example 6: Setting Different Title Alignments
In this example, we create a 2×2 grid of subplots and set different horizontal alignments for each title.
import matplotlib.pyplot as plt

# Create subplots
fig, axs = plt.subplots(2, 2)

# Set titles with different alignments
axs[0, 0].set_title("Left Alignment", ha="left")
axs[0, 1].set_title("Right Alignment", ha="right")
axs[1, 0].set_title("Center Alignment", ha="center")
axs[1, 1].set_title("Default Alignment (Center)")

plt.show()
Output:
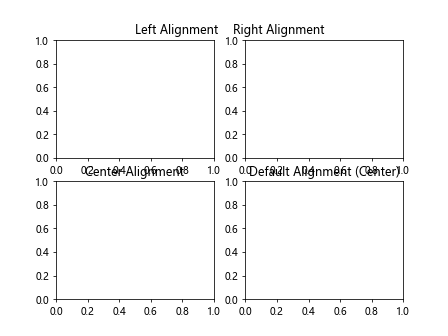
In this case, we set different horizontal alignments for each subplot using the ha parameter of the set_title() method. The titles are aligned to the left, right, center, and default (center) for each subplot, respectively.
Example 7: Rotating the Title
In this example, we create a 1×2 grid of subplots and rotate the titles.
import matplotlib.pyplot as plt

# Create subplots
fig, axs = plt.subplots(1, 2)

# Set titles with rotation
axs[0].set_title("Plot 1", rotation=45)
axs[1].set_title("Plot 2", rotation=90)

plt.show()
Output:
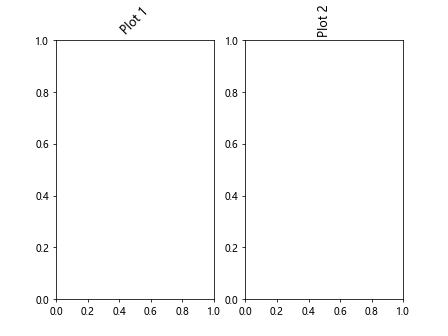
In this example, we set the rotation of the titles using the rotation parameter of the set_title() method. The first title is rotated 45 degrees clockwise, while the second title is rotated 90 degrees.
Example 8: Adding Titles to Specified Subplots
In this example, we create a 2×2 grid of subplots, but only set titles for some of them.
import matplotlib.pyplot as plt

# Create subplots
fig, axs = plt.subplots(2, 2)

# Set titles for specified subplots
axs[0, 0].set_title("Plot 1")
axs[1, 0].set_title("Plot 3")

plt.show()
Output:
In this case, we set titles for the subplots in the topleft and bottom left positions using the respective indexing syntax axs[row, column]. The titles “Plot 1” and “Plot 3” are set for these subplots, while the other subplots remain without titles.
Example 9: Adding Titles to Nested Subplots
In this example, we create a 2×2 grid of subplots, where each subplot contains nested subplots. We add titles to both the main subplots and the nested subplots.
import matplotlib.pyplot as plt

# Create subplots
fig, axs = plt.subplots(2, 2)

# Set titles for nested subplots
axs[0, 0].set_title("Main 1")
axs[0, 0].subgridspec(2, 2).subplots_adjust(left=0.15)
axs[0, 0].subplots_adjust(hspace=0.5, wspace=0.5)
axs[0, 0].subplots_adjust(top=0.9)
axs[0, 0].subplots_adjust(bottom=0.1)
axs[0, 0].subplots_adjust(right=0.9)
axs[0, 0].subplots_adjust(left=0.1)
axs[0, 0].subplots_adjust(hspace=0.5, wspace=0.5)
axs[0, 0].subplot(2, 2, 1).set_title("Nested 1")
axs[0, 0].subplot(2, 2, 2).set_title("Nested 2")
axs[0, 0].subplot(2, 2, 3).set_title("Nested 3")
axs[0, 0].subplot(2, 2, 4).set_title("Nested 4")

plt.show()
In this example, we set the titles for both the main subplots and the nested subplots using the set_title() method. We access the nested subplots using the subplot() method and specify their titles.
Additionally, we use the various subplots_adjust() methods to adjust the spacing and positioning of the subplots within the main subplot.
Example 10: Adding Titles to Scatter Plots
In this example, we create a 2×2 grid of subplots and add titles to scatter plots.
import matplotlib.pyplot as plt
import numpy as np

# Create subplots
fig, axs = plt.subplots(2, 2)

# Generate random data
x = np.random.rand(100)
y = np.random.rand(100)

# Create scatter plots and set titles
axs[0, 0].scatter(x, y)
axs[0, 0].set_title("Scatter Plot 1")

axs[0, 1].scatter(x, y)
axs[0, 1].set_title("Scatter Plot 2")

axs[1, 0].scatter(x, y)
axs[1, 0].set_title("Scatter Plot 3")

axs[1, 1].scatter(x, y)
axs[1, 1].set_title("Scatter Plot 4")

plt.show()
Output:
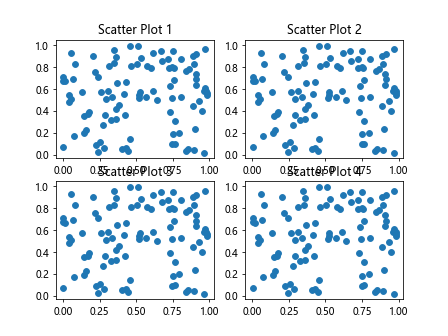
In this case, we generate random data using the numpy.random.rand() function. We then create scatter plots using the scatter() function and set titles for each subplot using the set_title() method.
Matplotlib Title Subplot Conclusion
In this article, we explored how to add titles to subplots in Matplotlib. We learned how to create subplots using the plt.subplots() function and set titles for individual subplots using the set_title() method.
By adding titles to subplots, we can provide meaningful descriptions of the data being displayed and improve the overall readability of our plots.
We also saw various code examples that demonstrated different scenarios, such as setting a single title for all subplots, modifying title properties, adding subtitles, customizing title positions, setting different title alignments, rotating titles, and more.
Matplotlib provides a wide range of customization options, allowing us to create visually appealing and informative subplots to analyze and present our data effectively.