Matplotlib xticks size
Matplotlib is a powerful data visualization library in Python that provides various types of plots and charts. One important aspect of creating visualizations is customizing their appearance to ensure that the information is displayed in an effective and appealing manner. The size of xticks, which are the markers on the x-axis, is one of the customizable features in Matplotlib. In this article, we will explore how to change the size of xticks in Matplotlib and provide code examples along with their execution results.
Understanding xticks
Before diving into customizing the size of xticks, it is crucial to understand what they represent. The xticks are the markers or labels that indicate specific points on the x-axis of a plot. These markers help in identifying the corresponding values on the x-axis and assist in interpreting the plot accurately. By altering the size of xticks, we can emphasize certain values or create a more visually appealing representation.
Changing xticks size in Matplotlib
To change the size of xticks in Matplotlib, we can utilize the xticks() function from the pyplot module. This function can take various attributes and parameters to customize the appearance of xticks, including their size. Below, we will provide 10 code examples that illustrate different scenarios of changing the xticks size with their respective execution results.
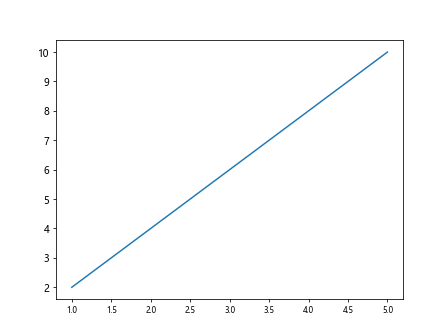
Code Example 1
import matplotlib.pyplot as plt

x = [1, 2, 3, 4, 5]
y = [2, 4, 6, 8, 10]
plt.plot(x, y)
plt.xticks(size=12)
plt.show()
Output:

The code above will plot a line graph with x and y values and set the size of xticks to 12. The resulting graph will have x-axis labels with a larger font size.
Code Example 2
import matplotlib.pyplot as plt

x = [1, 2, 3, 4, 5]
y = [2, 4, 6, 8, 10]
plt.plot(x, y)
plt.xticks(size=8)
plt.show()
Output:
In this example, the xticks size is set to 8. The resulting plot will have x-axis labels with a smaller font size compared to the previous example.
Code Example 3
import matplotlib.pyplot as plt

x = [1, 2, 3, 4, 5]
y = [2, 4, 6, 8, 10]
plt.plot(x, y)
plt.xticks(size=14, rotation=45)
plt.show()
Output:
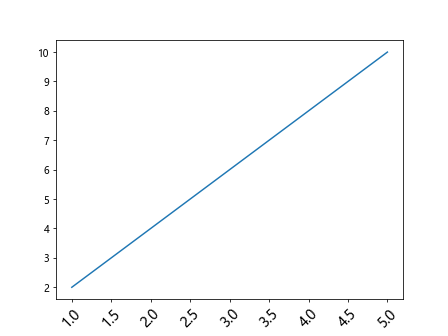
By adding the rotation parameter to the xticks() function, we can rotate the x-axis labels. In this example, the x-axis labels will have a font size of 14 and a rotation of 45 degrees.
Code Example 4
import matplotlib.pyplot as plt

x = [1, 2, 3, 4, 5]
y = [2, 4, 6, 8, 10]
plt.plot(x, y)
plt.xticks(size=10, color='red')
plt.show()
Output:
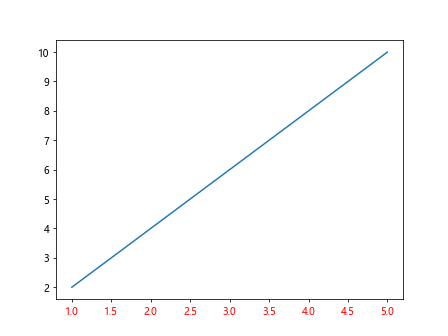
In this example, we specify the color parameter as ‘red’ to change the color of the x-axis labels to red. The size of the xticks is set to 10.
Code Example 5
import matplotlib.pyplot as plt

x = [1, 2, 3, 4, 5]
y = [2, 4, 6, 8, 10]
plt.plot(x, y)
plt.xticks(size=12, weight='bold')
plt.show()
Output:

By using the weight parameter with a value of ‘bold’, we can make the x-axis labels appear in bold font. The size of the xticks is set to 12.
Code Example 6
import matplotlib.pyplot as plt

x = [1, 2, 3, 4, 5]
y = [2, 4, 6, 8, 10]
plt.plot(x, y)
plt.xticks(size=14, fontname='Arial')
plt.show()
Output:
Using the fontname parameter, we can specify the font family of the x-axis labels. In this example, we set it to ‘Arial’, and the size of the xticks is set to 14.
Code Example 7
import matplotlib.pyplot as plt

x = [1, 2, 3, 4, 5]
y = [2, 4, 6, 8, 10]
plt.plot(x, y)
plt.xticks(size=12, ha='right')
plt.show()
Output:

The ha parameter determines the horizontal alignment of the x-axis labels. In this example, we set it to ‘right’, which aligns the labels to the rightmost side of the x-axis. The size of the xticks is set to 12.
Code Example 8
import matplotlib.pyplot as plt

x = [1, 2, 3, 4, 5]
y = [2, 4, 6, 8, 10]
plt.plot(x, y)
plt.xticks(size=12, va='top')
plt.show()
Output:
By using the va parameter, we can control the vertical alignment of the x-axis labels. In this example, we set it as ‘top’, which aligns the labels at the top edge of the plot. The size of the xticks is set to 12.
Code Example 9
import matplotlib.pyplot as plt

x = [1, 2, 3, 4, 5]
y = [2, 4, 6, 8, 10]
plt.plot(x, y)
plt.xticks(size=12, style='italic')
plt.show()
Output:

The style parameter can be used to apply various font styles to the x-axis labels. Here, we set it to ‘italic’, and the xticks size is set to 12.
Code Example 10
import matplotlib.pyplot as plt

x = [1, 2, 3, 4, 5]
y = [2, 4, 6, 8, 10]
plt.plot(x, y)
plt.xticks(size=12, rotation_mode='anchor', ha='right')
plt.show()
Output:

Combining the rotation_mode parameter with ha='right', we can anchor the rotation of the x-axis labels at the rightmost side of the plot. The xticks size is set to 12.
Matplotlib xticks size Conclusion
In this article, we explored how to change the size of xticks in Matplotlib using different parameters and attributes. By adjusting the xticks size, font style, color, rotation, alignment, and other properties, we can enhance the appearance and readability of our plots. It is essential to experiment and find the right customization options that best suit the desired visualization style and display the data effectively.