Matplotlib Title Position
Matplotlib is a powerful data visualization library in Python that provides a variety of methods and functions to create different types of charts and plots. One important aspect of creating visually appealing plots is the positioning of the title. The title of a plot provides a brief description or explanation of the plot, helping viewers understand the information being presented.
In this article, we will explore different ways to position the title in Matplotlib plots. We will cover some common techniques and provide code examples along with their corresponding output to illustrate the different positioning options available.
Default Title Positioning
By default, the title in a Matplotlib plot is positioned at the center, horizontally and vertically, at the top of the plot. Here’s an example:
import matplotlib.pyplot as plt

# Creating data
x = [1, 2, 3, 4, 5]
y = [10, 9, 7, 8, 6]

# Creating a plot
plt.plot(x, y)

# Adding a title
plt.title("Default Title Positioning")

# Displaying the plot
plt.show()
Output:
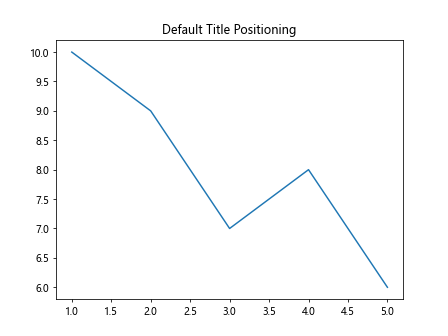
In the above example, the title “Default Title Positioning” is centered at the top of the plot.
Adjusting Title Position Horizontally
Matplotlib provides the pad parameter to adjust the spacing between the title and the plot in the horizontal direction. This parameter takes a float value representing the padding in points. Positive values move the title to the right, while negative values move it to the left. Here’s an example:
import matplotlib.pyplot as plt

# Creating data
x = [1, 2, 3, 4, 5]
y = [10, 9, 7, 8, 6]

# Creating a plot
plt.plot(x, y)

# Adding a title with horizontal adjustment
plt.title("Title Positioning with Horizontal Adjustment", pad=20)

# Displaying the plot
plt.show()
Output:
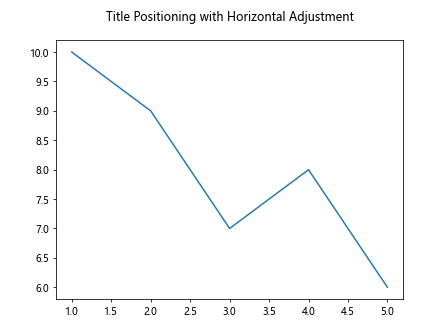
In the above example, the title is shifted 20 points to the right using the pad parameter.
Adjusting Title Position Vertically
Matplotlib also provides the verticalalignment parameter to adjust the vertical positioning of the title. This parameter can take different string values to represent different alignments. Some common values include:
'center': Positions the title at the vertical center.'top': Positions the title at the top.'bottom': Positions the title at the bottom.
Here’s an example:
import matplotlib.pyplot as plt

# Creating data
x = [1, 2, 3, 4, 5]
y = [10, 9, 7, 8, 6]

# Creating a plot
plt.plot(x, y)

# Adding a title with vertical adjustment
plt.title("Title Positioning with Vertical Adjustment", pad=20, verticalalignment='bottom')

# Displaying the plot
plt.show()
Output:
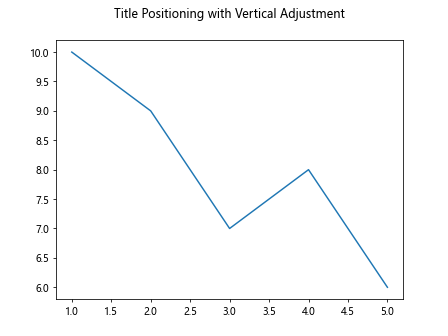
In this example, the title is positioned at the bottom of the plot.
Adjusting Title Position with Position Coordinates
Matplotlib allows us to specify the exact position of the title using position coordinates. These coordinates range from (0, 0) at the lower left corner of the plot to (1, 1) at the upper right corner. We can use the x and y parameters of the title function to specify the position.
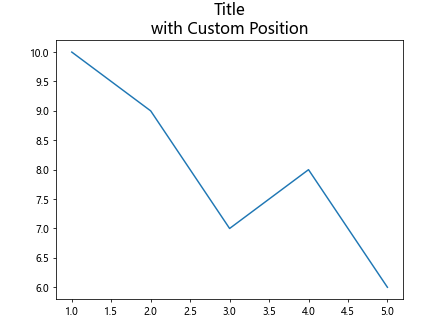
Here’s an example that positions the title slightly lower and to the right:
import matplotlib.pyplot as plt

# Creating data
x = [1, 2, 3, 4, 5]
y = [10, 9, 7, 8, 6]

# Creating a plot
plt.plot(x, y)

# Adding a title with custom position
plt.title("Title Positioning with Custom Position", pad=20, x=0.6, y=0.2)

# Displaying the plot
plt.show()
Output:
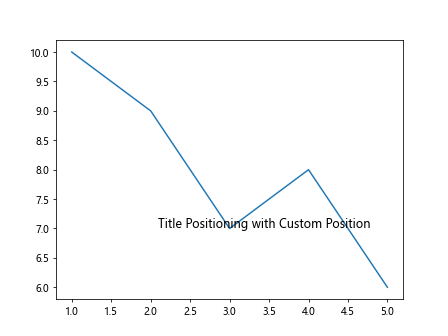
In this example, the title is positioned at (0.6, 0.2) of the plot.
Changing Font Size and Style of the Title
Matplotlib allows us to customize the font size and style of the title using the fontsize and fontstyle parameters. The fontsize parameter accepts a numeric value to specify the font size, while the fontstyle parameter takes a string value to specify the font style.
Here’s an example that changes the font size and style of the title:
import matplotlib.pyplot as plt

# Creating data
x = [1, 2, 3, 4, 5]
y = [10, 9, 7, 8, 6]

# Creating a plot
plt.plot(x, y)

# Adding a title with custom font size and style
plt.title("Title Positioning with Custom Font", fontsize=16, fontstyle='italic')

# Displaying the plot
plt.show()
Output:
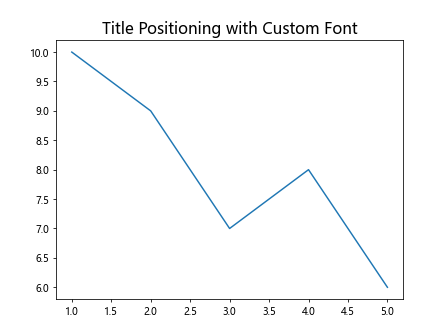
In this example, the title has a font size of 16 and is italicized.
Rotating the Title
Matplotlib allows us to rotate the title using the rotation parameter. This parameter takes a numeric value indicating the rotation angle in degrees. Positive values rotate the title clockwise, while negative values rotate it counterclockwise.
Here’s an example that rotates the title 45 degrees clockwise:
import matplotlib.pyplot as plt

# Creating data
x = [1, 2, 3, 4, 5]
y = [10, 9, 7, 8, 6]

# Creating a plot
plt.plot(x, y)

# Adding a rotated title
plt.title("Rotated Title", fontsize=14, rotation=45)

# Displaying the plot
plt.show()
Output:
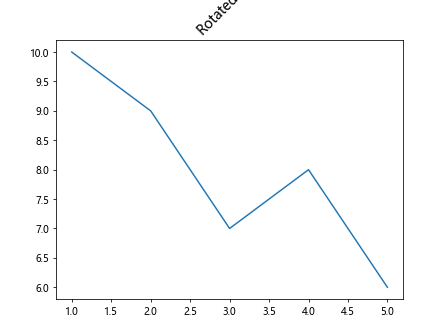
In this example, the title is rotated 45 degrees clockwise.
Using LaTeX for Mathematical Expressions
Matplotlib also supports LaTeX for mathematical expressions in the title. By enclosing the mathematical expression within $, we can render mathematical symbols and equations. Here’s an example:
import matplotlib.pyplot as plt

# Creating data
x = [1, 2, 3, 4, 5]
y = [10, 9, 7, 8, 6]

# Creating a plot
plt.plot(x, y)

# Adding a title with LaTeX expression
plt.title(r"$\int_0^1 e^x\,dx$", fontsize=16)

# Displaying the plot
plt.show()
Output:
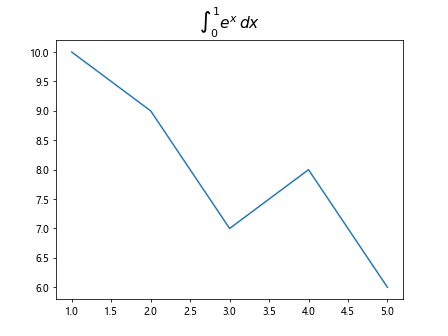
In this example, the title contains the integral equation using LaTeX notation.
Decluttering the Title
Sometimes, when working with large datasets or complex plots, the default title positioning may lead to a cluttered appearance. To prevent this, we can adjust the title position and wrap the text to multiple lines using the multialignment parameter.
Here’s an example that demonstrates this technique:
import matplotlib.pyplot as plt

# Creating data
x = [1, 2, 3, 4, 5]
y = [10, 9, 7, 8, 6]

# Creating a plot
plt.plot(x, y)

# Adding a title with custom position and wrapped text
plt.title("Decluttered\nTitle\nwith Custom Position", fontsize=16, multialignment='center')

# Displaying the plot
plt.show()
Output:
In this example, the title text is wrapped into multiple lines for better readability.
Combining Different Positioning Techniques
Matplotlib allows us to combine different positioning techniques to achieve the desired title placement. Here’s an example that demonstrates combining horizontal and vertical adjustments:
import matplotlib.pyplot as plt

# Creating data
x = [1, 2, 3, 4, 5]
y = [10, 9, 7, 8, 6]

# Creating a plot
plt.plot(x, y)

# Adding a title with combined positioning techniques
plt.title("Combined\nPositioning\nTechniques", fontsize=16, pad=20, verticalalignment='bottom')

# Displaying the plot
plt.show()
Output:
In this example, the title is positioned at the bottom of the plot with some horizontal adjustment and wrapped into multiple lines.
Matplotlib Title Position Conclusion
In this article, we explored various techniques to position the title in Matplotlib plots. We learned how to adjust the title position horizontally and vertically, using both padding and position coordinates. We also saw how to change the font size, font style, and rotation angle of the title. Additionally, we discovered how to use LaTeX for mathematical expressions in the title and declutter the title by wrapping the text.
By mastering the art of title positioning, you can create visually pleasing plots that effectively convey information to your audience. Experiment with different techniques and combinations to find the best positioning approach for your plots. Matplotlib offers a versatile set of tools to make your visualizations both informative and visually appealing.