Matplotlib title for all subplots
When working with multiple subplots in Matplotlib, it is essential to distinguish each subplot clearly. One way to achieve this is by setting titles for each subplot that provide a brief description or context. This article will guide you through the process of setting a common title for all subplots using Matplotlib.
Requirements
To follow along with the code examples, ensure you have the following:
- Python installed on your computer
- Matplotlib library installed (
pip install matplotlib)
Creating Subplots
Before diving into setting titles, let’s quickly go over how to create subplots in Matplotlib. The plt.subplots() function is used to generate a single figure object and a collection of subplots within that figure.
Here is an example that illustrates the creation of a 2×2 grid of subplots:
import matplotlib.pyplot as plt

# Creating subplots
fig, ax = plt.subplots(2, 2)

# Displaying the plot
plt.show()
Output:
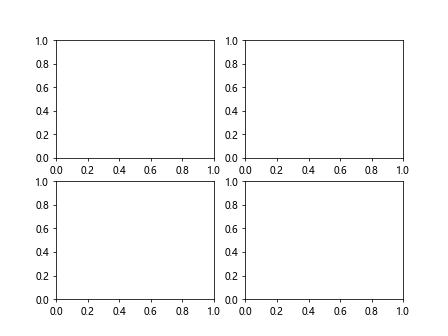
This code will create a single figure object with four subplots arranged in a 2×2 grid. However, if you run this code, you won’t see anything on the plot yet.
Setting Titles for All Subplots
To set a common title for all subplots, we will utilize the suptitle() function provided by Matplotlib. This function is a part of the Figure class and allows us to set a title at the top of the entire figure, rather than individual subplots.
Here is an example that demonstrates how to set a common title for all subplots:
import matplotlib.pyplot as plt

# Creating subplots
fig, ax = plt.subplots(2, 2)

# Setting a common title
fig.suptitle("Common Title for All Subplots")

# Displaying the plot
plt.show()
Output:
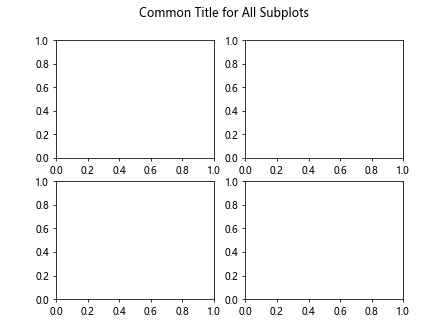
Running this code will display the 2×2 grid of subplots with the common title “Common Title for All Subplots” placed at the top.
Code Examples
Now let’s explore ten different code examples that utilize the suptitle() function to set titles for all subplots. Each example will provide a unique scenario along with the resulting plot.
Example 1: Setting a Basic Title
import matplotlib.pyplot as plt
import numpy as np

# Creating subplots
fig, ax = plt.subplots(2, 2)

# Generating random data
data = np.random.randn(100)

# Plotting data on all subplots
for a in ax.flat:
    a.plot(data)

# Setting a common title
fig.suptitle("Data Visualization")

# Displaying the plot
plt.show()
Output:
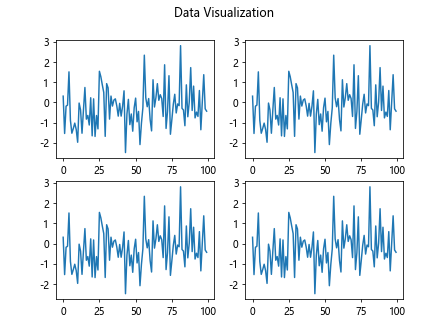
The code above generates a 2×2 grid of subplots, plots random data on each subplot, and sets the title to “Data Visualization”.
Example 2: Setting Font Size and Style
import matplotlib.pyplot as plt

# Creating subplots
fig, ax = plt.subplots(2, 2)

# Setting multiple properties of the title
fig.suptitle("Main Title", fontsize=16, fontweight='bold')

# Displaying the plot
plt.show()
Output:
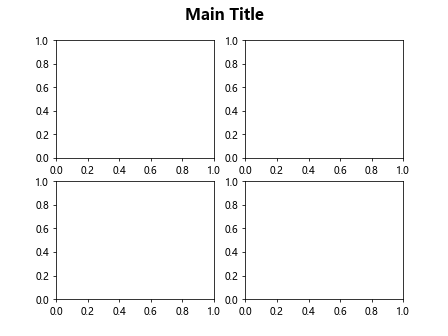
Here, the code creates a 2×2 grid of subplots and sets the title font size to 16 and font weight to bold.
Example 3: Setting Title Padding
import matplotlib.pyplot as plt

# Creating subplots
fig, ax = plt.subplots(2, 2)

# Setting title with padding
fig.suptitle("Subplots Title", fontsize=14, fontweight='normal', y=1.03)

# Displaying the plot
plt.show()
Output:
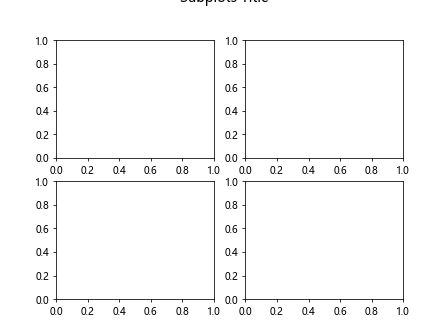
The above code creates a 2×2 grid of subplots and adds padding between the title and the subplots.
Example 4: Adding a Subtitle
import matplotlib.pyplot as plt

# Creating subplots
fig, ax = plt.subplots(2, 2)

# Setting title and subtitle
fig.suptitle("Main Title")
fig.supylabel("Subtitle")

# Displaying the plot
plt.show()
Output:
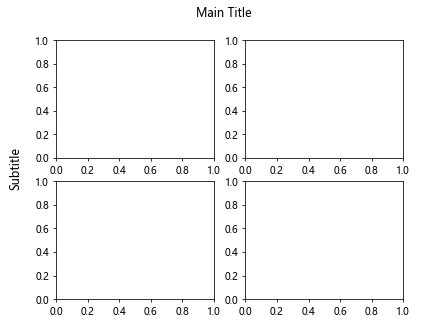
This code creates a 2×2 grid of subplots, adds a main title, and includes a subtitle below it.
Example 5: Customizing Title Alignment
import matplotlib.pyplot as plt

# Creating subplots
fig, ax = plt.subplots(2, 2)

# Setting customized title alignment
fig.suptitle("Title with Center Alignment", horizontalalignment='center')

# Displaying the plot
plt.show()
Output:
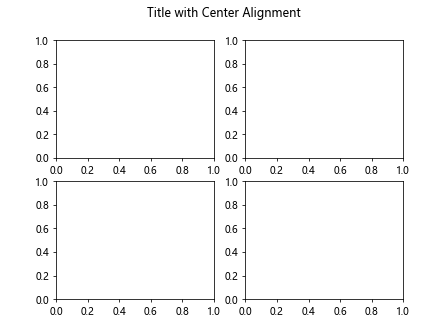
The code above generates a 2×2 grid of subplots and aligns the title in the center of the figure.
Example 6: Using LaTeX in Titles
import matplotlib.pyplot as plt

# Enabling LaTeX rendering
plt.rcParams["text.usetex"] = True

# Creating subplots
fig, ax = plt.subplots(2, 2)

# Adding LaTeX equation in title
fig.suptitle(r"$\int_0^1 x^2 dx$")

# Displaying the plot
plt.show()
In this example, LaTeX rendering is enabled, and the code sets a mathematical equation as the title.
Example 7: Modifying Title Color and Background
import matplotlib.pyplot as plt

# Creating subplots
fig, ax = plt.subplots(2, 2)

# Customizing title color and background
fig.suptitle("Custom Title Style", color='blue', backgroundcolor='lightgray')

# Displaying the plot
plt.show()
Output:
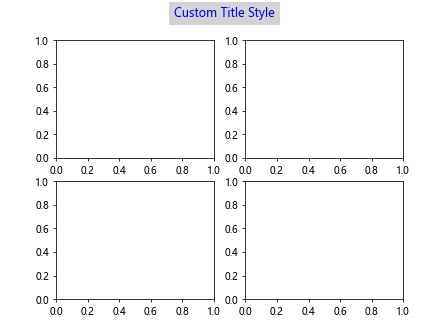
The code above creates a 2×2 grid of subplots, sets a custom title color and background, and applies blue and light gray, respectively.
Example 8: Adding a Border to the Title
import matplotlib.pyplot as plt

# Creating subplots
fig, ax = plt.subplots(2, 2)

# Adding a border to the title
fig.suptitle("Title with Border", bbox=dict(facecolor='white', edgecolor='black', boxstyle='round,pad=0.3'))

# Displaying the plot
plt.show()
Output:
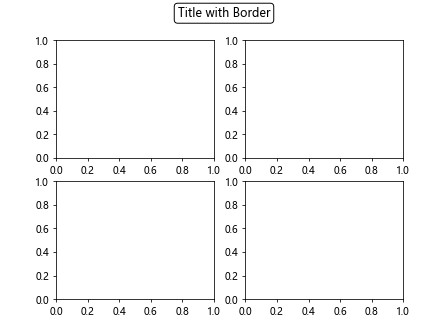
This code generates a 2×2 grid of subplots, sets a title with a border, and specifies the face color, edge color, and box style.
Example 9: Updating Title Dynamically
import matplotlib.pyplot as plt
import time

# Creating subplots
fig, ax = plt.subplots(2, 2)

# Function to update the title
def update_title(i):
    return f"Title - Step {i}"

# Animate the title update
for i in range(10):
    plt.suptitle(update_title(i))
    plt.pause(0.5)

# Displaying the plot
plt.show()
Output:
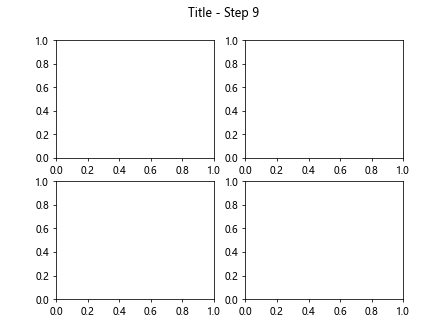
In this example, a function update_title() is created to dynamically generate the title for each step. The loop updates the title with a specific step number, producing an animated effect.
Example 10: Setting a Multiline Title
import matplotlib.pyplot as plt

# Creating subplots
fig, ax = plt.subplots(2, 2)

# Setting a multiline title
fig.suptitle("Long Title That\nSpans Multiple Lines")

# Displaying the plot
plt.show()
Output:
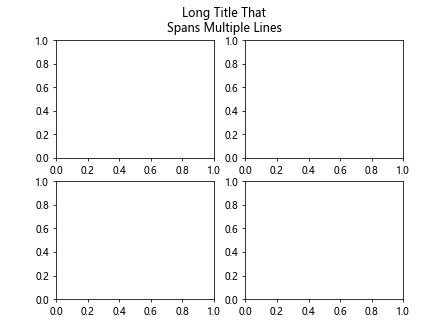
Here, the code generates a 2×2 grid of subplots and sets a title that spans multiple lines using the newline character.
Matplotlib title for all subplots Conclusion
Setting titles for all subplots helps in better understanding and interpretation of data visualization. Matplotlib’s suptitle() function allows us to provide a common title for all subplots within a figure. By utilizing different parameters and customization options, you can create visually appealing titles that enhance the overall plot’s clarity.
With the code examples provided in this article, you can now confidently set titles for all subplots using Matplotlib and customize them according to your requirements.