How to Master Matplotlib Subplots Spacing: A Comprehensive Guide
Matplotlib subplots spacing is a crucial aspect of data visualization that allows you to control the layout and appearance of multiple plots within a single figure. By mastering Matplotlib subplots spacing, you can create professional-looking visualizations that effectively communicate your data insights. In this comprehensive guide, we’ll explore various techniques and methods to adjust Matplotlib subplots spacing, providing you with the tools to create visually appealing and well-organized plots.
Understanding Matplotlib Subplots Spacing
Matplotlib subplots spacing refers to the arrangement and spacing between individual plots within a figure. Proper spacing ensures that your plots are well-organized, easy to read, and visually appealing. The spacing between subplots can be adjusted using various Matplotlib functions and parameters, allowing you to customize the layout to suit your specific needs.
Let’s start with a basic example to illustrate Matplotlib subplots spacing:
import matplotlib.pyplot as plt
import numpy as np

# Create a figure with 2 subplots
fig, (ax1, ax2) = plt.subplots(1, 2, figsize=(10, 4))

# Plot data on the first subplot
x = np.linspace(0, 10, 100)
ax1.plot(x, np.sin(x), label='Sine')
ax1.set_title('Sine Wave - how2matplotlib.com')
ax1.legend()

# Plot data on the second subplot
ax2.plot(x, np.cos(x), label='Cosine')
ax2.set_title('Cosine Wave - how2matplotlib.com')
ax2.legend()

# Adjust spacing between subplots
plt.tight_layout()

plt.show()
Output:
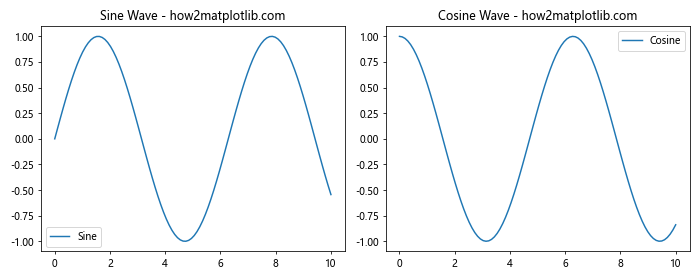
In this example, we create a figure with two subplots side by side. The plt.tight_layout() function is used to automatically adjust the spacing between subplots. This is a simple way to improve the default Matplotlib subplots spacing.
Adjusting Matplotlib Subplots Spacing with subplots_adjust()
One of the most common methods for controlling Matplotlib subplots spacing is the subplots_adjust() function. This function allows you to fine-tune the spacing between subplots by adjusting various parameters such as left, right, top, bottom, wspace, and hspace.
Here’s an example demonstrating how to use subplots_adjust():
import matplotlib.pyplot as plt
import numpy as np

# Create a figure with 4 subplots
fig, ((ax1, ax2), (ax3, ax4)) = plt.subplots(2, 2, figsize=(10, 8))

# Plot data on each subplot
x = np.linspace(0, 10, 100)
ax1.plot(x, np.sin(x), label='Sine')
ax1.set_title('Sine Wave - how2matplotlib.com')
ax1.legend()

ax2.plot(x, np.cos(x), label='Cosine')
ax2.set_title('Cosine Wave - how2matplotlib.com')
ax2.legend()

ax3.plot(x, np.tan(x), label='Tangent')
ax3.set_title('Tangent Wave - how2matplotlib.com')
ax3.legend()

ax4.plot(x, np.exp(x), label='Exponential')
ax4.set_title('Exponential Function - how2matplotlib.com')
ax4.legend()

# Adjust spacing between subplots
plt.subplots_adjust(left=0.1, right=0.95, top=0.95, bottom=0.1, wspace=0.3, hspace=0.4)

plt.show()
Output:
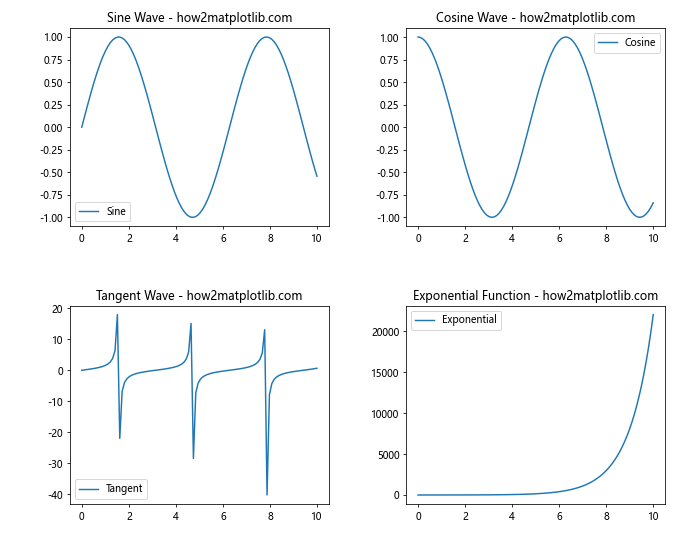
In this example, we create a figure with four subplots arranged in a 2×2 grid. The subplots_adjust() function is used to customize the Matplotlib subplots spacing. The parameters are:
left: The left side of the subplots of the figureright: The right side of the subplots of the figuretop: The top of the subplots of the figurebottom: The bottom of the subplots of the figurewspace: The width of the padding between subplots, as a fraction of the average axes widthhspace: The height of the padding between subplots, as a fraction of the average axes height
By adjusting these parameters, you can fine-tune the Matplotlib subplots spacing to achieve the desired layout.
Using gridspec for Advanced Matplotlib Subplots Spacing
For more complex layouts and finer control over Matplotlib subplots spacing, you can use the gridspec module. This module allows you to create a grid-like structure for your subplots and adjust their sizes and positions individually.
Here’s an example of using gridspec to create a custom layout:
import matplotlib.pyplot as plt
import matplotlib.gridspec as gridspec
import numpy as np

# Create a figure and GridSpec
fig = plt.figure(figsize=(12, 8))
gs = gridspec.GridSpec(3, 3)

# Create subplots with custom sizes and positions
ax1 = fig.add_subplot(gs[0, :])
ax2 = fig.add_subplot(gs[1, :-1])
ax3 = fig.add_subplot(gs[1:, -1])
ax4 = fig.add_subplot(gs[-1, 0])
ax5 = fig.add_subplot(gs[-1, -2])

# Plot data on each subplot
x = np.linspace(0, 10, 100)
ax1.plot(x, np.sin(x), label='Sine')
ax1.set_title('Sine Wave - how2matplotlib.com')
ax1.legend()

ax2.plot(x, np.cos(x), label='Cosine')
ax2.set_title('Cosine Wave - how2matplotlib.com')
ax2.legend()

ax3.plot(x, np.tan(x), label='Tangent')
ax3.set_title('Tangent Wave - how2matplotlib.com')
ax3.legend()

ax4.plot(x, np.exp(x), label='Exponential')
ax4.set_title('Exponential Function - how2matplotlib.com')
ax4.legend()

ax5.plot(x, np.log(x), label='Logarithm')
ax5.set_title('Logarithm Function - how2matplotlib.com')
ax5.legend()

# Adjust spacing between subplots
plt.tight_layout()

plt.show()
Output:
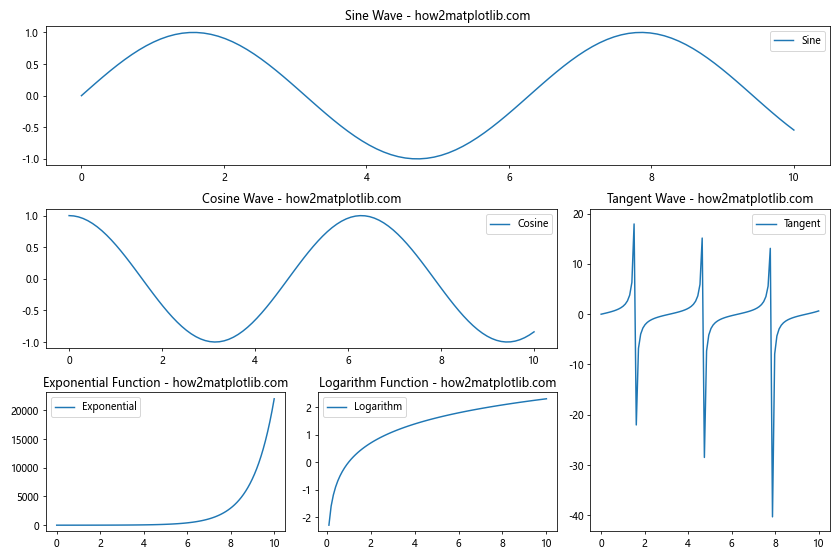
In this example, we use gridspec to create a custom layout with five subplots of different sizes and positions. The GridSpec object defines a 3×3 grid, and we use slicing notation to specify the position and size of each subplot within the grid. This approach gives you more flexibility in arranging your subplots and controlling the Matplotlib subplots spacing.
Fine-tuning Matplotlib Subplots Spacing with constrained_layout
Matplotlib’s constrained_layout is another powerful tool for adjusting subplots spacing. It automatically adjusts the positions of plot elements to fit within the figure without overlapping. This can be particularly useful when dealing with subplots that have different sizes or when you want to ensure that all labels and titles are visible.
Here’s an example of using constrained_layout:
import matplotlib.pyplot as plt
import numpy as np

# Create a figure with constrained layout
fig, axs = plt.subplots(2, 2, figsize=(10, 8), constrained_layout=True)

# Plot data on each subplot
x = np.linspace(0, 10, 100)
axs[0, 0].plot(x, np.sin(x), label='Sine')
axs[0, 0].set_title('Sine Wave - how2matplotlib.com')
axs[0, 0].legend()

axs[0, 1].plot(x, np.cos(x), label='Cosine')
axs[0, 1].set_title('Cosine Wave - how2matplotlib.com')
axs[0, 1].legend()

axs[1, 0].plot(x, np.tan(x), label='Tangent')
axs[1, 0].set_title('Tangent Wave - how2matplotlib.com')
axs[1, 0].legend()

axs[1, 1].plot(x, np.exp(x), label='Exponential')
axs[1, 1].set_title('Exponential Function - how2matplotlib.com')
axs[1, 1].legend()

plt.show()
Output:
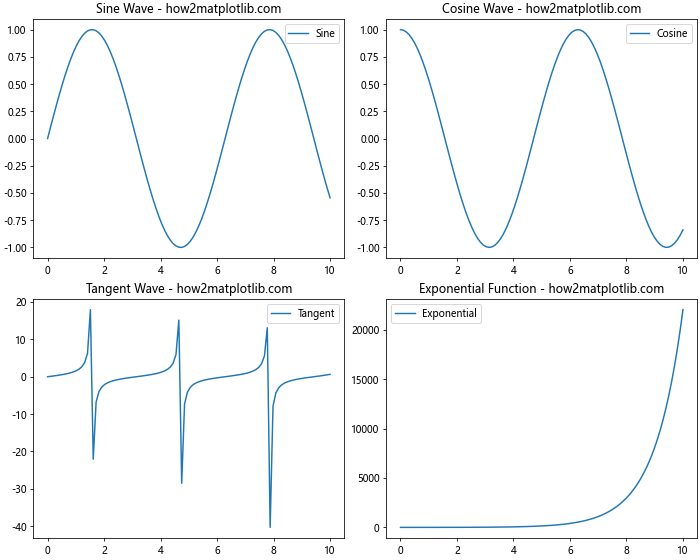
In this example, we create a figure with four subplots using constrained_layout=True. This automatically adjusts the Matplotlib subplots spacing to ensure that all elements fit within the figure without overlapping.
Adjusting Matplotlib Subplots Spacing for Colorbars
When working with plots that include colorbars, you may need to adjust the Matplotlib subplots spacing to accommodate them. Here’s an example of how to do this:
import matplotlib.pyplot as plt
import numpy as np

# Create a figure with 2 subplots
fig, (ax1, ax2) = plt.subplots(1, 2, figsize=(12, 5))

# Create sample data
data1 = np.random.rand(10, 10)
data2 = np.random.rand(10, 10)

# Plot heatmaps with colorbars
im1 = ax1.imshow(data1, cmap='viridis')
im2 = ax2.imshow(data2, cmap='plasma')

# Add colorbars
cbar1 = fig.colorbar(im1, ax=ax1)
cbar2 = fig.colorbar(im2, ax=ax2)

# Set titles
ax1.set_title('Heatmap 1 - how2matplotlib.com')
ax2.set_title('Heatmap 2 - how2matplotlib.com')

# Adjust spacing between subplots
plt.tight_layout()

# Adjust spacing for colorbars
plt.subplots_adjust(right=0.9)

plt.show()
Output:
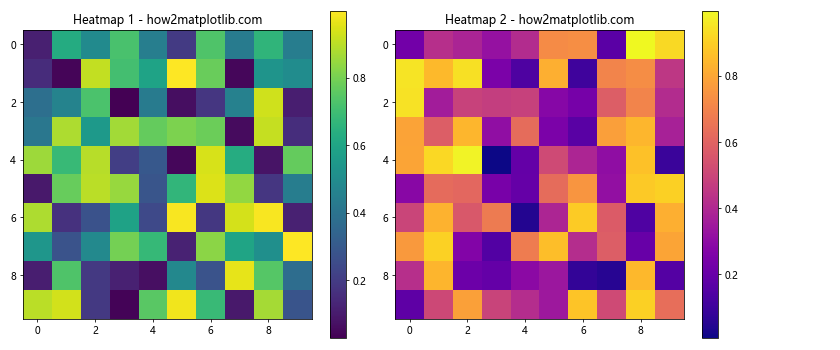
In this example, we create two heatmaps with colorbars. We use tight_layout() to automatically adjust the Matplotlib subplots spacing, and then fine-tune the spacing using subplots_adjust() to make room for the colorbars on the right side of the figure.
Creating Subplots with Unequal Sizes
Sometimes you may want to create subplots with different sizes within the same figure. Matplotlib subplots spacing can be adjusted to accommodate this layout. Here’s an example:
import matplotlib.pyplot as plt
import matplotlib.gridspec as gridspec
import numpy as np

# Create a figure and GridSpec
fig = plt.figure(figsize=(12, 8))
gs = gridspec.GridSpec(2, 2, width_ratios=[2, 1], height_ratios=[1, 2])

# Create subplots with custom sizes
ax1 = fig.add_subplot(gs[0, 0])
ax2 = fig.add_subplot(gs[0, 1])
ax3 = fig.add_subplot(gs[1, :])

# Plot data on each subplot
x = np.linspace(0, 10, 100)
ax1.plot(x, np.sin(x), label='Sine')
ax1.set_title('Sine Wave - how2matplotlib.com')
ax1.legend()

ax2.plot(x, np.cos(x), label='Cosine')
ax2.set_title('Cosine Wave - how2matplotlib.com')
ax2.legend()

ax3.plot(x, np.tan(x), label='Tangent')
ax3.set_title('Tangent Wave - how2matplotlib.com')
ax3.legend()

# Adjust spacing between subplots
plt.tight_layout()

plt.show()
Output:
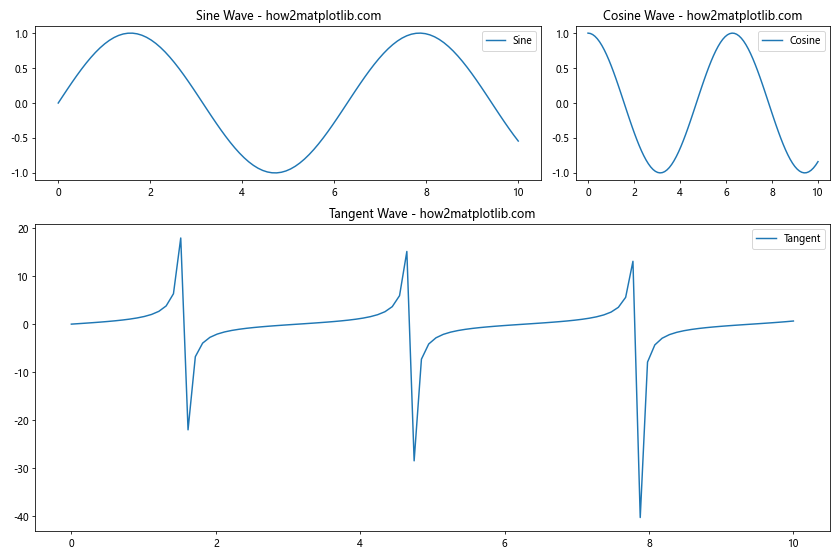
In this example, we use gridspec to create subplots with different sizes. The width_ratios and height_ratios parameters allow us to specify the relative sizes of the columns and rows in the grid. This gives us fine control over the Matplotlib subplots spacing and layout.
Adjusting Matplotlib Subplots Spacing for Shared Axes
When creating subplots with shared axes, you may need to adjust the Matplotlib subplots spacing to ensure proper alignment. Here’s an example:
import matplotlib.pyplot as plt
import numpy as np

# Create a figure with 2x2 subplots and shared axes
fig, axs = plt.subplots(2, 2, figsize=(10, 8), sharex='col', sharey='row')

# Plot data on each subplot
x = np.linspace(0, 10, 100)
axs[0, 0].plot(x, np.sin(x))
axs[0, 0].set_title('Sine Wave - how2matplotlib.com')

axs[0, 1].plot(x, np.cos(x))
axs[0, 1].set_title('Cosine Wave - how2matplotlib.com')

axs[1, 0].plot(x, np.tan(x))
axs[1, 0].set_title('Tangent Wave - how2matplotlib.com')

axs[1, 1].plot(x, np.exp(x))
axs[1, 1].set_title('Exponential Function - how2matplotlib.com')

# Adjust spacing between subplots
plt.tight_layout()

# Fine-tune spacing for shared axes
plt.subplots_adjust(hspace=0.3, wspace=0.3)

plt.show()
Output:
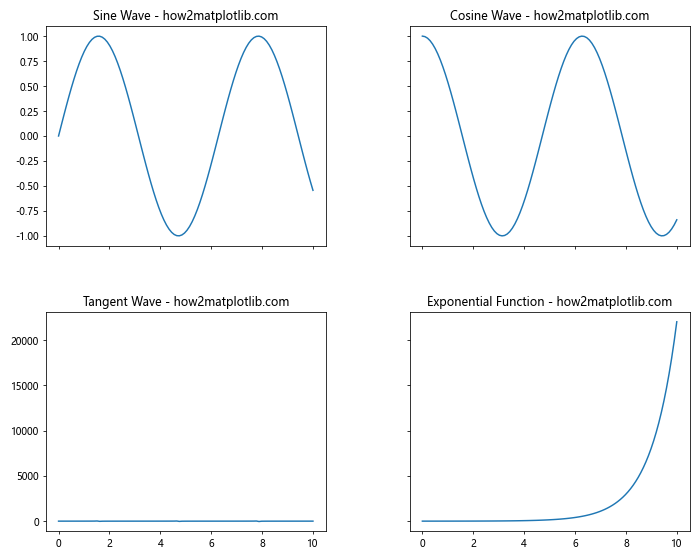
In this example, we create a 2×2 grid of subplots with shared x-axes for each column and shared y-axes for each row. We use tight_layout() to automatically adjust the Matplotlib subplots spacing, and then fine-tune it using subplots_adjust() to ensure proper spacing between the shared axes.
Creating Subplots with Insets
Inset plots are small plots placed within a larger plot. When working with insets, you need to carefully manage the Matplotlib subplots spacing to ensure that the inset doesn’t overlap with the main plot. Here’s an example:
import matplotlib.pyplot as plt
import numpy as np

# Create a figure and main plot
fig, ax = plt.subplots(figsize=(10, 6))

# Plot main data
x = np.linspace(0, 10, 100)
ax.plot(x, np.sin(x), label='Sine')
ax.set_title('Main Plot with Inset - how2matplotlib.com')
ax.legend()

# Create inset plot
axins = ax.inset_axes([0.6, 0.1, 0.3, 0.3])
axins.plot(x, np.cos(x), color='red')
axins.set_title('Inset: Cosine')

# Adjust spacing
plt.tight_layout()

plt.show()
Output:
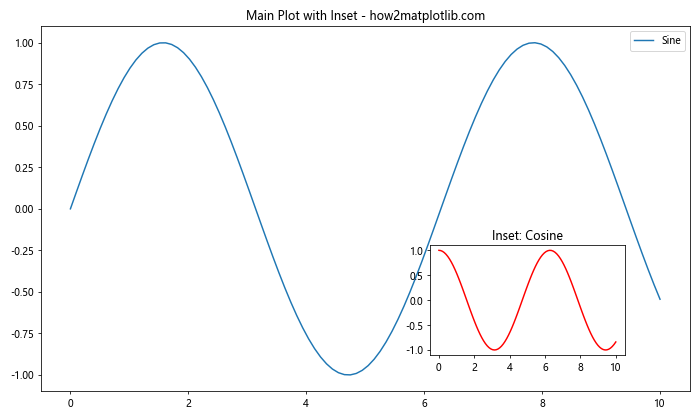
In this example, we create a main plot with an inset plot. The inset_axes() function is used to create the inset, and we specify its position and size as a fraction of the main plot’s axes. The tight_layout() function helps to adjust the overall Matplotlib subplots spacing.
Adjusting Matplotlib Subplots Spacing for Annotations
When adding annotations to your plots, you may need to adjust the Matplotlib subplots spacing to accommodate them. Here’s an example:
import matplotlib.pyplot as plt
import numpy as np

# Create a figure with 2 subplots
fig, (ax1, ax2) = plt.subplots(1, 2, figsize=(12, 5))

# Plot data on each subplot
x = np.linspace(0, 10, 100)
ax1.plot(x, np.sin(x), label='Sine')
ax1.set_title('Sine Wave - how2matplotlib.com')
ax1.legend()

ax2.plot(x, np.cos(x), label='Cosine')
ax2.set_title('Cosine Wave - how2matplotlib.com')
ax2.legend()

# Add annotations
ax1.annotate('Peak', xy=(np.pi/2, 1), xytext=(np.pi/2 + 1, 1.2),
             arrowprops=dict(facecolor='black', shrink=0.05))

ax2.annotate('Trough', xy=(np.pi, -1), xytext=(np.pi + 1, -1.2),
             arrowprops=dict(facecolor='black', shrink=0.05))

# Adjust spacing between subplots
plt.tight_layout()

# Fine-tune spacing for annotations
plt.subplots_adjust(top=0.85, bottom=0.15)

plt.show()
Output:
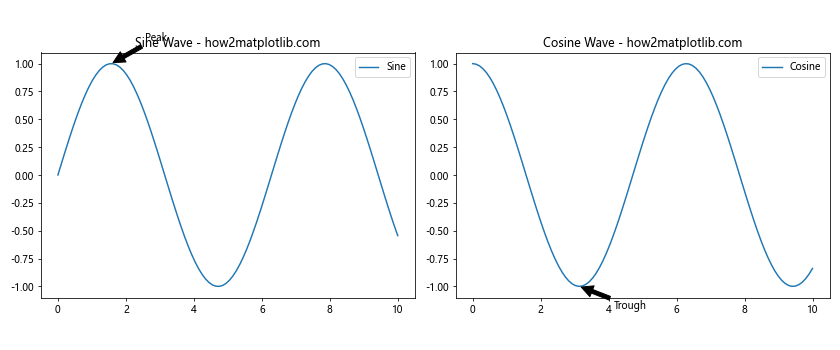
In this example, we add annotations to both subplots. After using tight_layout() to automatically adjust the Matplotlib subplots spacing, we fine-tune the spacing using subplots_adjust() to ensure that the annotations don’t overlap with the plot titles or axes labels.
Managing Matplotlib Subplots Spacing with Different Plot Types
When working with different types of plots in the same figure, you may need to adjust the Matplotlib subplots spacing to accommodate their varying sizes and shapes. Here’s an example that combines different plot types:
import matplotlib.pyplot as plt
import numpy as np

# Create a figure with 2x2 subplots
fig, ((ax1, ax2), (ax3, ax4)) = plt.subplots(2, 2, figsize=(12, 10))

# Line plot
x = np.linspace(0, 10, 100)
ax1.plot(x, np.sin(x))
ax1.set_title('Line Plot - how2matplotlib.com')

# Scatter plot
x = np.random.rand(50)
y = np.random.rand(50)
ax2.scatter(x, y)
ax2.set_title('Scatter Plot - how2matplotlib.com')

# Bar plot
categories = ['A', 'B', 'C', 'D']
values = [3, 7, 2, 5]
ax3.bar(categories, values)
ax3.set_title('Bar Plot - how2matplotlib.com')

# Pie chart
sizes = [15, 30, 45, 10]
labels = ['Apples', 'Bananas', 'Oranges', 'Grapes']
ax4.pie(sizes, labels=labels, autopct='%1.1f%%')
ax4.set_title('Pie Chart - how2matplotlib.com')

# Adjust spacing between subplots
plt.tight_layout()

# Fine-tune spacing
plt.subplots_adjust(wspace=0.3, hspace=0.4)

plt.show()
Output:
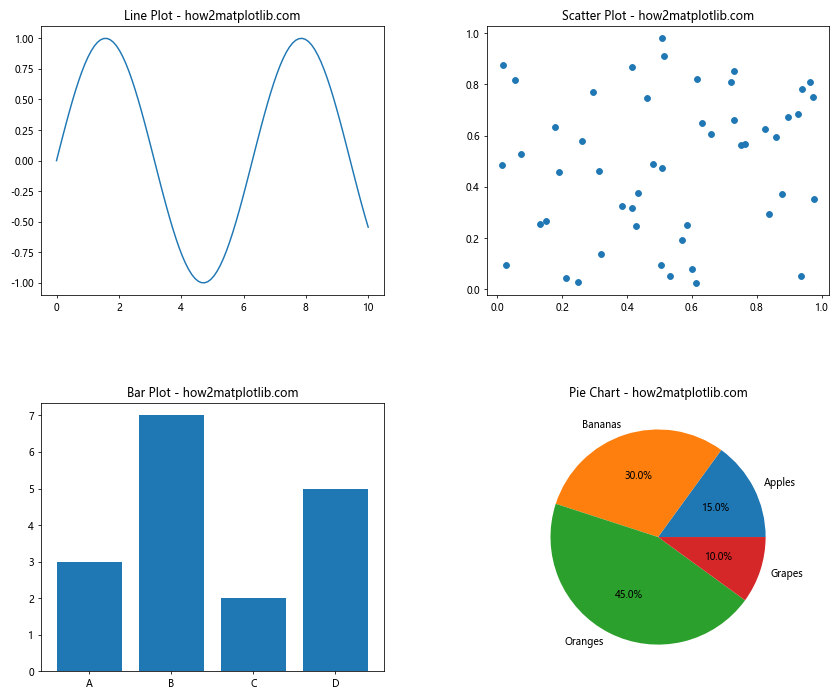
In this example, we create four different types of plots: a line plot, a scatter plot, a bar plot, and a pie chart. We use tight_layout() to automatically adjust the Matplotlib subplots spacing, and then fine-tune it using subplots_adjust() to ensure proper spacing between the different plot types.
Adjusting Matplotlib Subplots Spacing for Polar Plots
When working with polar plots, you may need to adjust the Matplotlib subplots spacing differently than with Cartesian plots. Here’s an example:
import matplotlib.pyplot as plt
import numpy as np

# Create a figure with 2x2 subplots, including polar plots
fig = plt.figure(figsize=(12, 10))

# Regular plot
ax1 = fig.add_subplot(221)
x = np.linspace(0, 10, 100)
ax1.plot(x, np.sin(x))
ax1.set_title('Regular Plot - how2matplotlib.com')

# Polar plot
ax2 = fig.add_subplot(222, projection='polar')
theta = np.linspace(0, 2*np.pi, 100)
r = np.cos(4*theta)
ax2.plot(theta, r)
ax2.set_title('Polar Plot - how2matplotlib.com')

# Another regular plot
ax3 = fig.add_subplot(223)
ax3.plot(x, np.cos(x))
ax3.set_title('Another Regular Plot - how2matplotlib.com')

# Another polar plot
ax4 = fig.add_subplot(224, projection='polar')
r = np.sin(4*theta)
ax4.plot(theta, r)
ax4.set_title('Another Polar Plot - how2matplotlib.com')

# Adjust spacing between subplots
plt.tight_layout()

# Fine-tune spacing
plt.subplots_adjust(wspace=0.4, hspace=0.4)

plt.show()
Output:
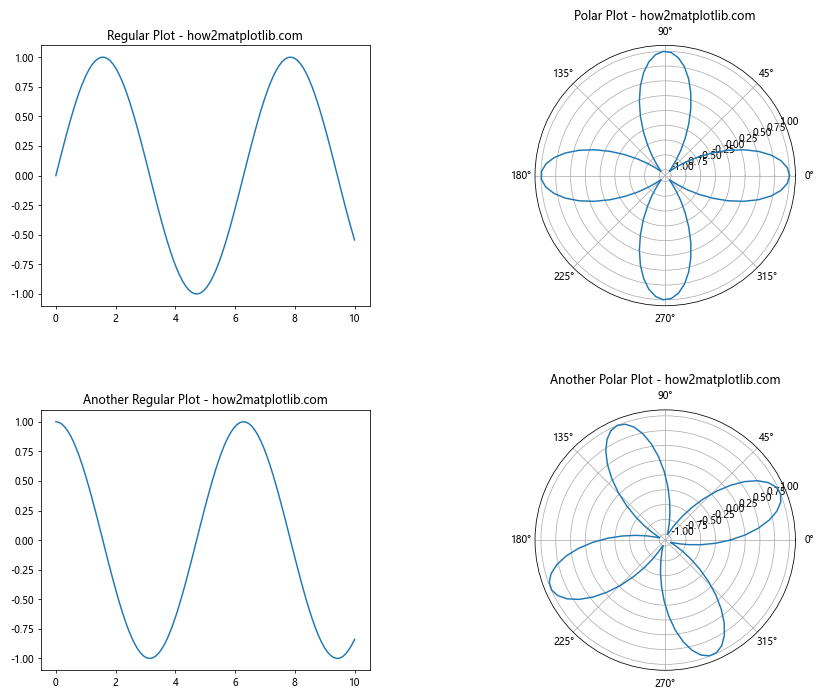
In this example, we create a figure with two regular plots and two polar plots. The Matplotlib subplots spacing needs to be adjusted to accommodate the circular nature of the polar plots. We use tight_layout() for initial spacing and then fine-tune it with subplots_adjust().
Creating Subplots with Varying Aspect Ratios
Sometimes you may want to create subplots with different aspect ratios. Here’s how you can adjust the Matplotlib subplots spacing to accommodate this:
import matplotlib.pyplot as plt
import numpy as np

# Create a figure with 3 subplots of different aspect ratios
fig = plt.figure(figsize=(12, 8))

# Wide subplot
ax1 = fig.add_subplot(211)
x = np.linspace(0, 10, 100)
ax1.plot(x, np.sin(x))
ax1.set_title('Wide Subplot - how2matplotlib.com')

# Square subplot
ax2 = fig.add_subplot(223)
theta = np.linspace(0, 2*np.pi, 100)
r = np.cos(4*theta)
ax2.plot(theta, r)
ax2.set_aspect('equal')
ax2.set_title('Square Subplot - how2matplotlib.com')

# Tall subplot
ax3 = fig.add_subplot(224)
y = np.linspace(0, 10, 100)
ax3.plot(np.exp(y), y)
ax3.set_title('Tall Subplot - how2matplotlib.com')

# Adjust spacing between subplots
plt.tight_layout()

# Fine-tune spacing
plt.subplots_adjust(hspace=0.3, wspace=0.3)

plt.show()
Output:
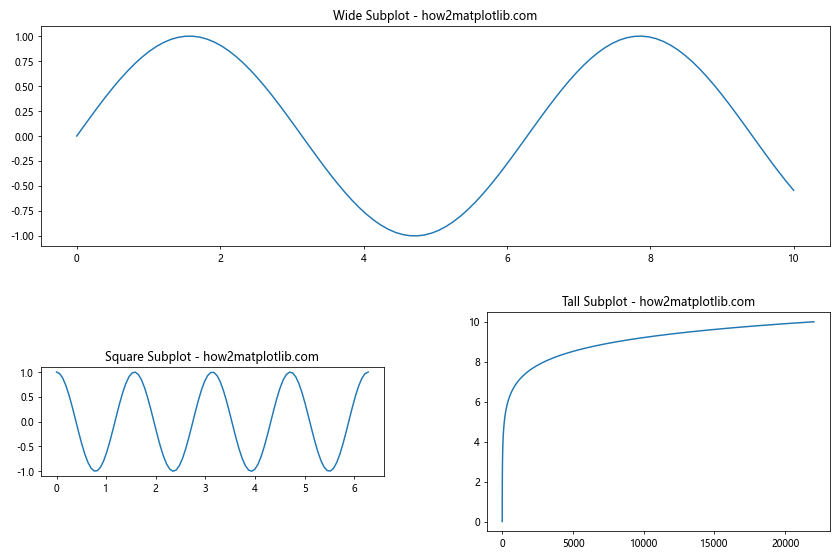
In this example, we create three subplots with different aspect ratios: a wide subplot, a square subplot, and a tall subplot. We use tight_layout() to automatically adjust the Matplotlib subplots spacing, and then fine-tune it using subplots_adjust() to ensure proper spacing between the subplots with different aspect ratios.
Adjusting Matplotlib Subplots Spacing for 3D Plots
When working with 3D plots, you may need to adjust the Matplotlib subplots spacing differently to accommodate the additional depth dimension. Here’s an example:
import matplotlib.pyplot as plt
import numpy as np
from mpl_toolkits.mplot3d import Axes3D

# Create a figure with 2x2 subplots, including 3D plots
fig = plt.figure(figsize=(12, 10))

# Regular 2D plot
ax1 = fig.add_subplot(221)
x = np.linspace(0, 10, 100)
ax1.plot(x, np.sin(x))
ax1.set_title('2D Plot - how2matplotlib.com')

# 3D surface plot
ax2 = fig.add_subplot(222, projection='3d')
x = y = np.linspace(-3, 3, 50)
X, Y = np.meshgrid(x, y)
Z = np.sin(X) * np.cos(Y)
ax2.plot_surface(X, Y, Z)
ax2.set_title('3D Surface Plot - how2matplotlib.com')

# Another 2D plot
ax3 = fig.add_subplot(223)
ax3.plot(x, np.cos(x))
ax3.set_title('Another 2D Plot - how2matplotlib.com')

# 3D scatter plot
ax4 = fig.add_subplot(224, projection='3d')
n = 100
xs = np.random.rand(n)
ys = np.random.rand(n)
zs = np.random.rand(n)
ax4.scatter(xs, ys, zs)
ax4.set_title('3D Scatter Plot - how2matplotlib.com')

# Adjust spacing between subplots
plt.tight_layout()

# Fine-tune spacing
plt.subplots_adjust(wspace=0.4, hspace=0.4)

plt.show()
Output:
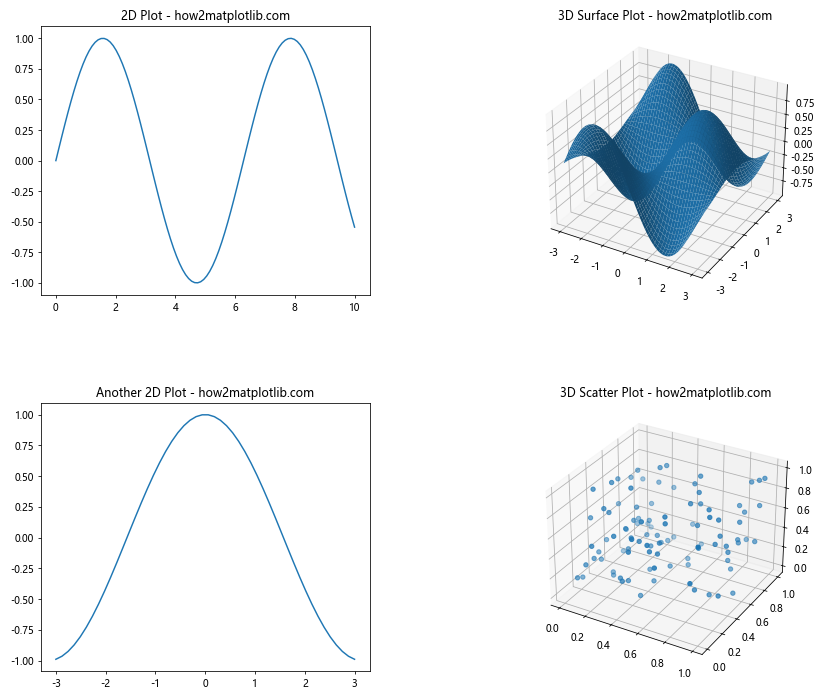
In this example, we create a figure with two 2D plots and two 3D plots. The Matplotlib subplots spacing needs to be adjusted to accommodate the 3D plots, which typically require more space. We use tight_layout() for initial spacing and then fine-tune it with subplots_adjust().
Matplotlib Subplots Spacing Conclusion
Mastering Matplotlib subplots spacing is essential for creating professional-looking and effective data visualizations. Throughout this comprehensive guide, we’ve explored various techniques and methods to adjust and fine-tune the spacing between subplots in Matplotlib.
We’ve covered:
- Basic subplot creation and automatic spacing adjustment with
tight_layout() - Fine-tuning spacing using
subplots_adjust() - Advanced layout control with
gridspec - Using
constrained_layoutfor automatic spacing adjustment - Adjusting spacing for plots with colorbars
- Creating subplots with unequal sizes
- Managing spacing for shared axes
- Working with inset plots
- Adjusting spacing for annotations
- Handling different plot types in the same figure
- Spacing considerations for polar plots
- Creating subplots with varying aspect ratios
- Adjusting spacing for 3D plots
By applying these techniques, you can create well-organized and visually appealing figures that effectively communicate your data insights. Remember that Matplotlib subplots spacing is not a one-size-fits-all solution, and you may need to experiment with different approaches to find the best layout for your specific visualization needs.
As you continue to work with Matplotlib, keep in mind that proper subplot spacing can significantly enhance the readability and impact of your visualizations. Don’t be afraid to iterate and fine-tune your plots until you achieve the desired layout and appearance.
With the knowledge and examples provided in this guide, you’re now well-equipped to tackle even the most complex Matplotlib subplots spacing challenges. Happy plotting!