How to Master Matplotlib Subplots Title: A Comprehensive Guide
Matplotlib Subplots Title is an essential feature for creating informative and visually appealing multi-plot figures in data visualization. This article will provide a detailed exploration of how to effectively use and customize subplot titles in Matplotlib, offering numerous examples and practical tips to enhance your data visualization skills.
Understanding Matplotlib Subplots Title Basics
Matplotlib Subplots Title functionality allows you to add descriptive text above individual subplots or the entire figure. This feature is crucial for providing context and clarity to your visualizations. Let’s start with a basic example of how to add a title to a subplot:
import matplotlib.pyplot as plt

fig, ax = plt.subplots()
ax.plot([1, 2, 3, 4], [1, 4, 2, 3])
ax.set_title("How2Matplotlib.com: Basic Subplot Title")
plt.show()
Output:
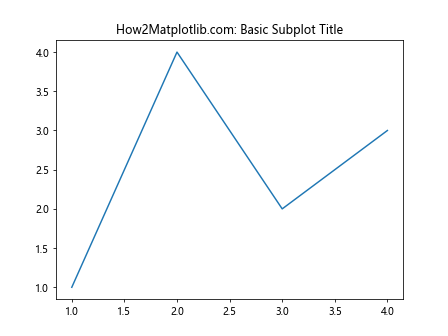
In this example, we create a simple line plot and add a title to the subplot using the set_title() method. The title “How2Matplotlib.com: Basic Subplot Title” will appear above the plot.
Creating Multiple Subplots with Titles
When working with multiple subplots, you can add titles to each individual subplot. Here’s an example demonstrating how to create a 2×2 grid of subplots, each with its own title:
import matplotlib.pyplot as plt
import numpy as np

fig, axs = plt.subplots(2, 2, figsize=(10, 8))
fig.suptitle("How2Matplotlib.com: Multiple Subplots with Titles")

x = np.linspace(0, 2*np.pi, 100)

axs[0, 0].plot(x, np.sin(x))
axs[0, 0].set_title("Sine Wave")

axs[0, 1].plot(x, np.cos(x))
axs[0, 1].set_title("Cosine Wave")

axs[1, 0].plot(x, np.tan(x))
axs[1, 0].set_title("Tangent Wave")

axs[1, 1].plot(x, np.exp(x))
axs[1, 1].set_title("Exponential Function")

plt.tight_layout()
plt.show()
Output:
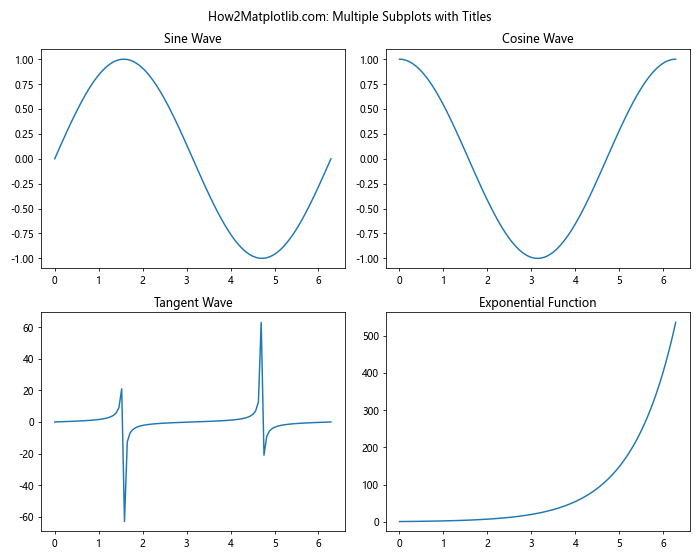
In this example, we create a 2×2 grid of subplots using plt.subplots(2, 2). We then add a title to each subplot using the set_title() method. The fig.suptitle() method is used to add an overall title to the entire figure.
Customizing Matplotlib Subplots Title Appearance
Matplotlib provides various options to customize the appearance of subplot titles. You can adjust properties such as font size, color, weight, and style. Here’s an example showcasing different title customizations:
import matplotlib.pyplot as plt

fig, axs = plt.subplots(2, 2, figsize=(10, 8))
fig.suptitle("How2Matplotlib.com: Customized Subplot Titles", fontsize=16)

axs[0, 0].plot([1, 2, 3, 4], [1, 4, 2, 3])
axs[0, 0].set_title("Default Title")

axs[0, 1].plot([1, 2, 3, 4], [1, 4, 2, 3])
axs[0, 1].set_title("Large Red Title", fontsize=14, color='red')

axs[1, 0].plot([1, 2, 3, 4], [1, 4, 2, 3])
axs[1, 0].set_title("Bold Italic Title", fontweight='bold', fontstyle='italic')

axs[1, 1].plot([1, 2, 3, 4], [1, 4, 2, 3])
axs[1, 1].set_title("Custom Font Title", fontfamily='serif', fontsize=12)

plt.tight_layout()
plt.show()
Output:
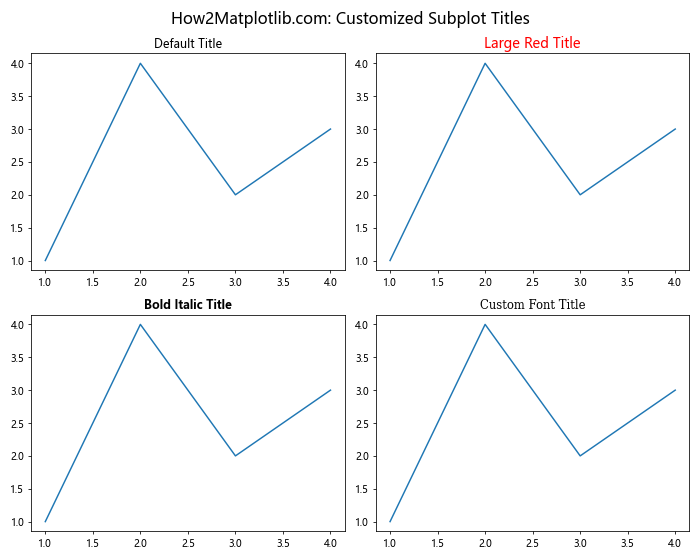
This example demonstrates various ways to customize subplot titles:
- Default title
- Large red title with increased font size
- Bold and italic title
- Custom font family title
Positioning Matplotlib Subplots Title
You can adjust the position of subplot titles using the loc parameter in the set_title() method. Here’s an example showing different title positions:
import matplotlib.pyplot as plt

fig, axs = plt.subplots(2, 2, figsize=(10, 8))
fig.suptitle("How2Matplotlib.com: Subplot Title Positions")

axs[0, 0].plot([1, 2, 3, 4], [1, 4, 2, 3])
axs[0, 0].set_title("Default (Center)")

axs[0, 1].plot([1, 2, 3, 4], [1, 4, 2, 3])
axs[0, 1].set_title("Left Aligned", loc='left')

axs[1, 0].plot([1, 2, 3, 4], [1, 4, 2, 3])
axs[1, 0].set_title("Right Aligned", loc='right')

axs[1, 1].plot([1, 2, 3, 4], [1, 4, 2, 3])
axs[1, 1].set_title("Custom Position", x=0.25, y=1.05)

plt.tight_layout()
plt.show()
Output:
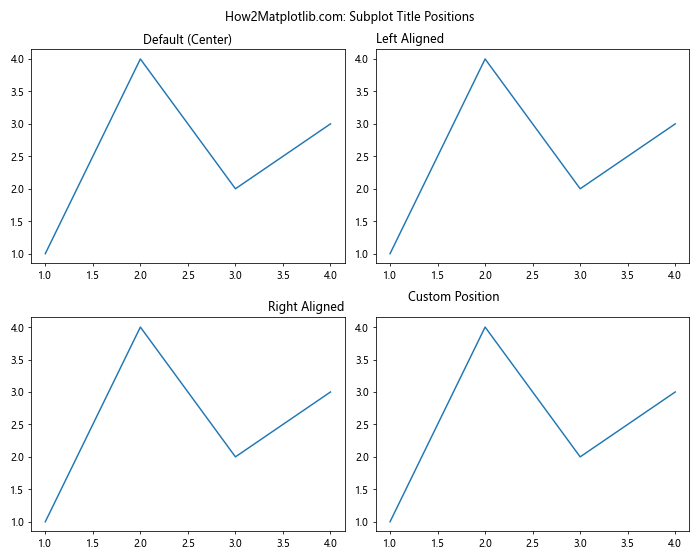
This example shows four different title positions:
- Default (center-aligned)
- Left-aligned
- Right-aligned
- Custom position using
xandyparameters
Rotating Matplotlib Subplots Title
You can rotate subplot titles to create unique layouts or accommodate long titles. Here’s an example showing rotated subplot titles:
import matplotlib.pyplot as plt

fig, axs = plt.subplots(2, 2, figsize=(10, 8))
fig.suptitle("How2Matplotlib.com: Rotated Subplot Titles")

axs[0, 0].plot([1, 2, 3, 4], [1, 4, 2, 3])
axs[0, 0].set_title("Default (0 degrees)")

axs[0, 1].plot([1, 2, 3, 4], [1, 4, 2, 3])
axs[0, 1].set_title("45 Degree Rotation", rotation=45)

axs[1, 0].plot([1, 2, 3, 4], [1, 4, 2, 3])
axs[1, 0].set_title("90 Degree Rotation", rotation=90)

axs[1, 1].plot([1, 2, 3, 4], [1, 4, 2, 3])
axs[1, 1].set_title("Custom Rotation", rotation=30, va='bottom')

plt.tight_layout()
plt.show()
Output:
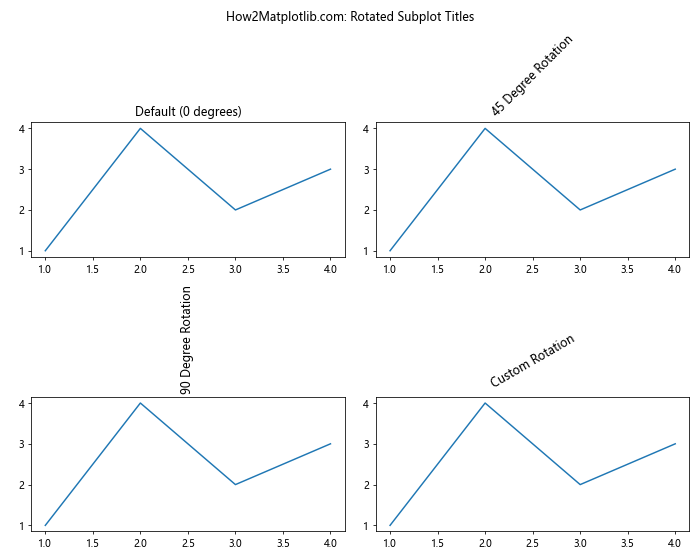
This example demonstrates four different title rotations:
- Default (0 degrees)
- 45-degree rotation
- 90-degree rotation
- Custom 30-degree rotation with adjusted vertical alignment
Using Matplotlib Subplots Title with Gridspec
When creating complex subplot layouts using Gridspec, you can still add titles to individual subplots. Here’s an example:
import matplotlib.pyplot as plt
import matplotlib.gridspec as gridspec

fig = plt.figure(figsize=(12, 8))
fig.suptitle("How2Matplotlib.com: Subplot Titles with Gridspec")

gs = gridspec.GridSpec(3, 3)

ax1 = fig.add_subplot(gs[0, :])
ax1.plot([1, 2, 3, 4], [1, 4, 2, 3])
ax1.set_title("Subplot spanning three columns")

ax2 = fig.add_subplot(gs[1, :-1])
ax2.plot([1, 2, 3, 4], [1, 4, 2, 3])
ax2.set_title("Subplot spanning two columns")

ax3 = fig.add_subplot(gs[1:, -1])
ax3.plot([1, 2, 3, 4], [1, 4, 2, 3])
ax3.set_title("Subplot spanning two rows")

ax4 = fig.add_subplot(gs[-1, 0])
ax4.plot([1, 2, 3, 4], [1, 4, 2, 3])
ax4.set_title("Single cell subplot")

ax5 = fig.add_subplot(gs[-1, -2])
ax5.plot([1, 2, 3, 4], [1, 4, 2, 3])
ax5.set_title("Another single cell")

plt.tight_layout()
plt.show()
Output:
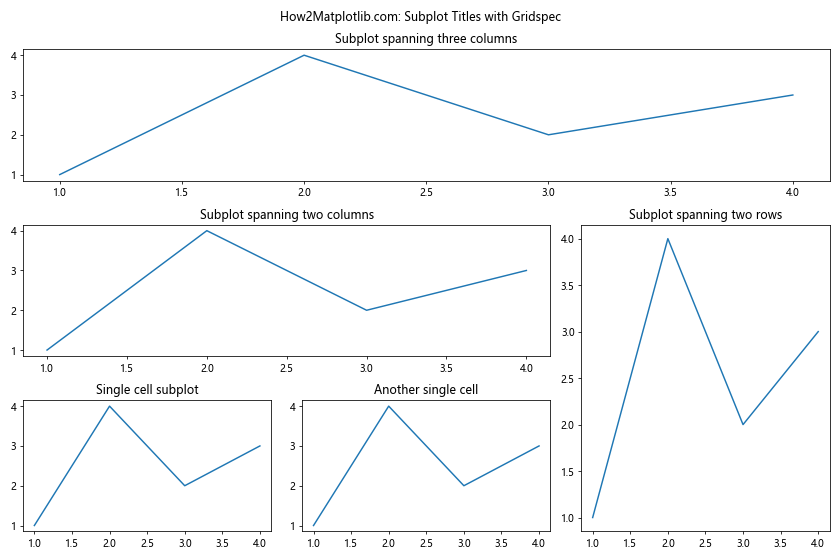
In this example, we create a complex layout using Gridspec and add titles to each subplot using the set_title() method.
Adjusting Matplotlib Subplots Title Padding
You can adjust the spacing between subplot titles and the plot area using the pad parameter. Here’s an example demonstrating different title paddings:
import matplotlib.pyplot as plt

fig, axs = plt.subplots(2, 2, figsize=(10, 8))
fig.suptitle("How2Matplotlib.com: Subplot Title Padding")

axs[0, 0].plot([1, 2, 3, 4], [1, 4, 2, 3])
axs[0, 0].set_title("Default Padding")

axs[0, 1].plot([1, 2, 3, 4], [1, 4, 2, 3])
axs[0, 1].set_title("Increased Padding", pad=20)

axs[1, 0].plot([1, 2, 3, 4], [1, 4, 2, 3])
axs[1, 0].set_title("Reduced Padding", pad=5)

axs[1, 1].plot([1, 2, 3, 4], [1, 4, 2, 3])
axs[1, 1].set_title("Negative Padding", pad=-10)

plt.tight_layout()
plt.show()
Output:
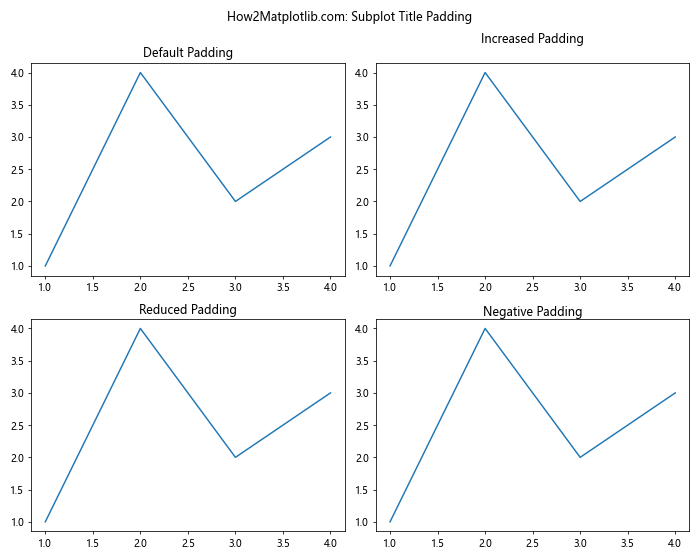
This example shows four different title padding configurations:
- Default padding
- Increased padding (20 points)
- Reduced padding (5 points)
- Negative padding (-10 points)
Adding Matplotlib Subplots Title with Custom Fonts
You can use custom fonts for subplot titles to enhance the visual appeal of your plots. Here’s an example using different font families:
import matplotlib.pyplot as plt

fig, axs = plt.subplots(2, 2, figsize=(10, 8))
fig.suptitle("How2Matplotlib.com: Custom Fonts for Subplot Titles")

axs[0, 0].plot([1, 2, 3, 4], [1, 4, 2, 3])
axs[0, 0].set_title("Default Font")

axs[0, 1].plot([1, 2, 3, 4], [1, 4, 2, 3])
axs[0, 1].set_title("Serif Font", fontfamily='serif')

axs[1, 0].plot([1, 2, 3, 4], [1, 4, 2, 3])
axs[1, 0].set_title("Sans-Serif Font", fontfamily='sans-serif')

axs[1, 1].plot([1, 2, 3, 4], [1, 4, 2, 3])
axs[1, 1].set_title("Monospace Font", fontfamily='monospace')

plt.tight_layout()
plt.show()
Output:
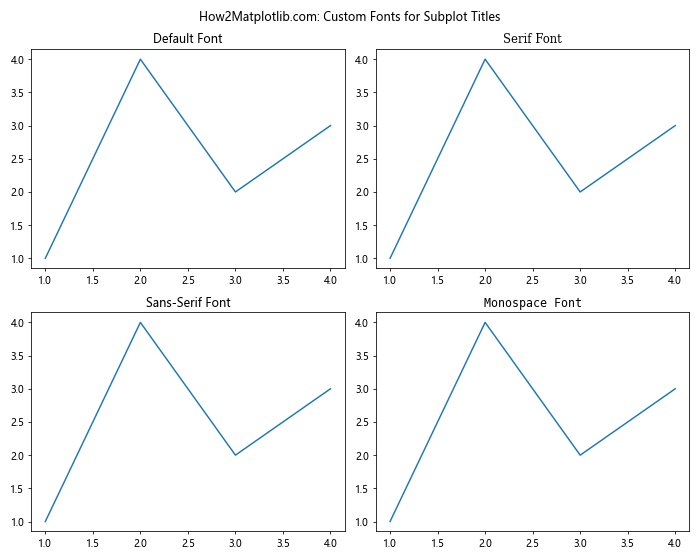
This example demonstrates the use of different font families for subplot titles:
- Default font
- Serif font
- Sans-serif font
- Monospace font
Creating Matplotlib Subplots Title with Annotations
You can create more complex subplot titles using annotations. This allows for greater flexibility in positioning and styling. Here’s an example:
import matplotlib.pyplot as plt

fig, axs = plt.subplots(2, 2, figsize=(10, 8))
fig.suptitle("How2Matplotlib.com: Subplot Titles with Annotations")

axs[0, 0].plot([1, 2, 3, 4], [1, 4, 2, 3])
axs[0, 0].annotate("Default Annotation Title", xy=(0.5, 1.05), xycoords='axes fraction',ha='center', va='center')

axs[0, 1].plot([1, 2, 3, 4], [1, 4, 2, 3])
axs[0, 1].annotate("Styled Annotation Title", xy=(0.5, 1.05), xycoords='axes fraction',
                   ha='center', va='center', fontsize=12, fontweight='bold', color='red')

axs[1, 0].plot([1, 2, 3, 4], [1, 4, 2, 3])
axs[1, 0].annotate("Rotated Annotation Title", xy=(0, 1.05), xycoords='axes fraction',
                   ha='left', va='center', rotation=45)

axs[1, 1].plot([1, 2, 3, 4], [1, 4, 2, 3])
axs[1, 1].annotate("Arrow Annotation Title", xy=(0.5, 0.5), xycoords='axes fraction',
                   xytext=(0.5, 1.1), textcoords='axes fraction',
                   ha='center', va='center', arrowprops=dict(arrowstyle="->"))

plt.tight_layout()
plt.show()
Output:
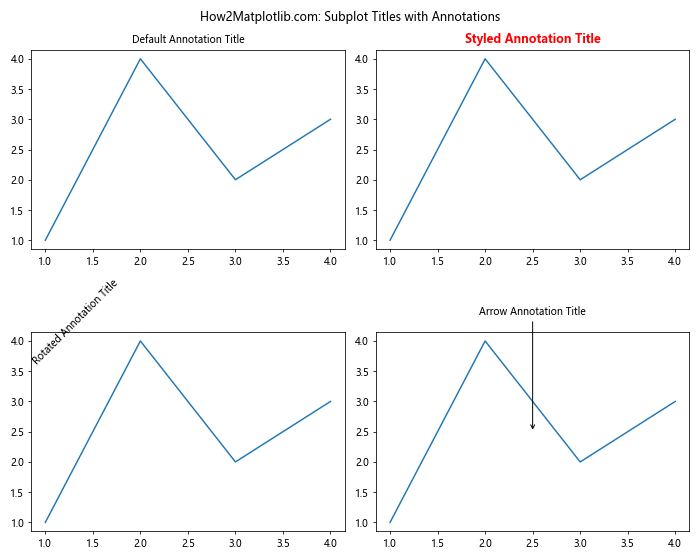
This example showcases different ways to create subplot titles using annotations:
- Default annotation title
- Styled annotation title with custom font properties
- Rotated annotation title
- Annotation title with an arrow pointing to the plot
Dynamically Updating Matplotlib Subplots Title
In some cases, you may need to update subplot titles dynamically based on data or user input. Here’s an example demonstrating how to update subplot titles:
import matplotlib.pyplot as plt
import numpy as np

fig, ax = plt.subplots()
fig.suptitle("How2Matplotlib.com: Dynamic Subplot Title")

x = np.linspace(0, 10, 100)
line, = ax.plot(x, np.sin(x))

def update_plot(freq):
    line.set_ydata(np.sin(freq * x))
    ax.set_title(f"Sine Wave with Frequency {freq:.2f}")
    fig.canvas.draw_idle()

from matplotlib.widgets import Slider
ax_slider = plt.axes([0.2, 0.02, 0.6, 0.03])
slider = Slider(ax_slider, 'Frequency', 0.1, 5.0, valinit=1.0)
slider.on_changed(update_plot)

plt.show()
Output:
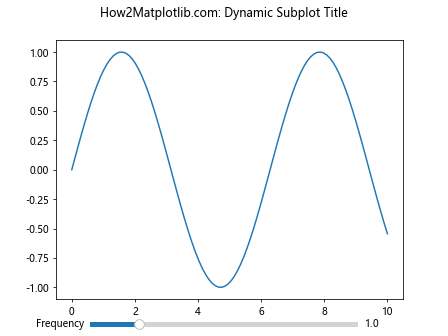
In this example, we create an interactive plot with a slider that adjusts the frequency of a sine wave. The subplot title is updated dynamically to reflect the current frequency value.
Using Matplotlib Subplots Title with Nested Subplots
When working with nested subplots, you can add titles to both the outer and inner subplots. Here’s an example:
import matplotlib.pyplot as plt

fig = plt.figure(figsize=(12, 8))
fig.suptitle("How2Matplotlib.com: Nested Subplots with Titles")

# Outer subplots
outer_grid = fig.add_gridspec(2, 2)

for i in range(4):
    inner_grid = outer_grid[i].subgridspec(2, 2)
    for j in range(4):
        ax = fig.add_subplot(inner_grid[j])
        ax.plot([1, 2, 3, 4], [1, 4, 2, 3])
        ax.set_title(f"Inner Plot {i+1}-{j+1}")

    # Add title to outer subplot
    fig.add_subplot(outer_grid[i]).set_title(f"Outer Plot {i+1}", fontsize=16)
    fig.add_subplot(outer_grid[i]).axis('off')

plt.tight_layout()
plt.show()
Output:
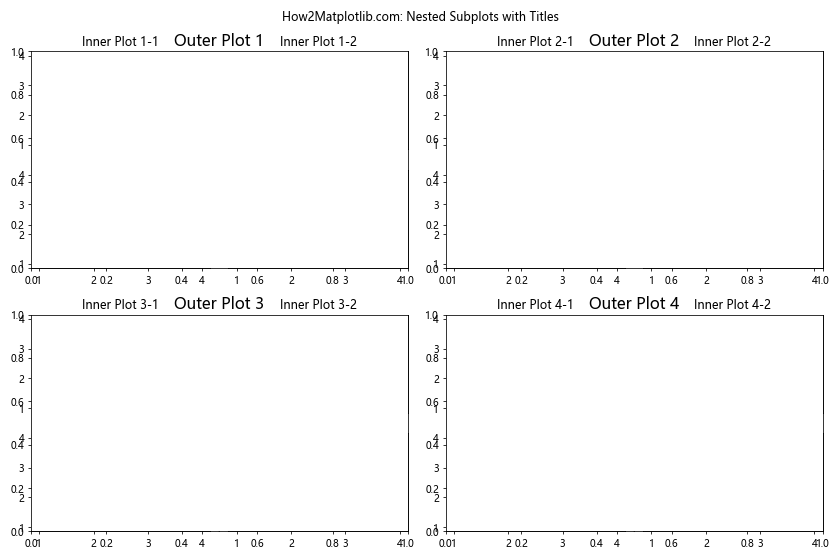
This example creates a 2×2 grid of outer subplots, each containing a 2×2 grid of inner subplots. Titles are added to both the outer and inner subplots.
Matplotlib Subplots Title with Shared Axes
When creating subplots with shared axes, you can still add individual titles to each subplot. Here’s an example:
import matplotlib.pyplot as plt
import numpy as np

fig, axs = plt.subplots(2, 2, figsize=(10, 8), sharex=True, sharey=True)
fig.suptitle("How2Matplotlib.com: Subplots with Shared Axes and Titles")

x = np.linspace(0, 2*np.pi, 100)

axs[0, 0].plot(x, np.sin(x))
axs[0, 0].set_title("Sine Wave")

axs[0, 1].plot(x, np.cos(x))
axs[0, 1].set_title("Cosine Wave")

axs[1, 0].plot(x, np.tan(x))
axs[1, 0].set_title("Tangent Wave")

axs[1, 1].plot(x, np.exp(x))
axs[1, 1].set_title("Exponential Function")

fig.text(0.5, 0.04, 'X-axis Label', ha='center')
fig.text(0.04, 0.5, 'Y-axis Label', va='center', rotation='vertical')

plt.tight_layout()
plt.show()
Output:
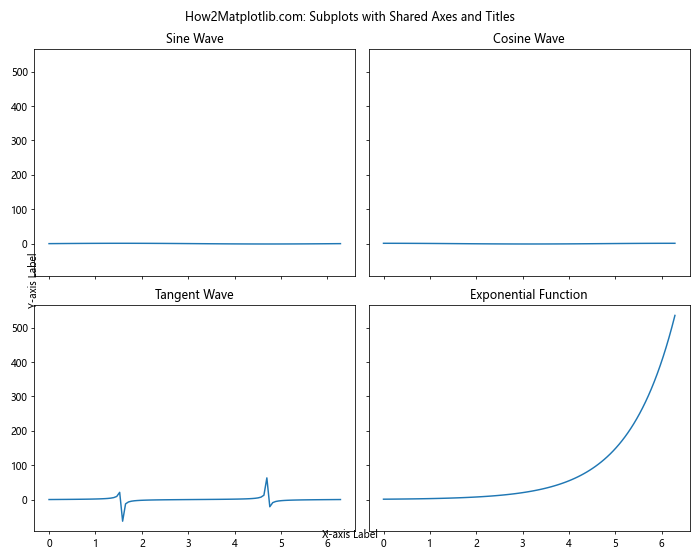
In this example, we create a 2×2 grid of subplots with shared x and y axes. Each subplot has its own title, and we add common x and y axis labels using fig.text().
Matplotlib Subplots Title with Colorbar
When adding a colorbar to your subplots, you can still include titles for each subplot. Here’s an example:
import matplotlib.pyplot as plt
import numpy as np

fig, axs = plt.subplots(2, 2, figsize=(10, 8))
fig.suptitle("How2Matplotlib.com: Subplots with Colorbar and Titles")

x = np.linspace(-5, 5, 100)
y = np.linspace(-5, 5, 100)
X, Y = np.meshgrid(x, y)

for i, ax in enumerate(axs.flat):
    Z = np.sin(X) * np.cos(Y) + i
    im = ax.imshow(Z, cmap='viridis', extent=[-5, 5, -5, 5])
    ax.set_title(f"Plot {i+1}")

fig.colorbar(im, ax=axs.ravel().tolist(), shrink=0.8)

plt.tight_layout()
plt.show()
Output:
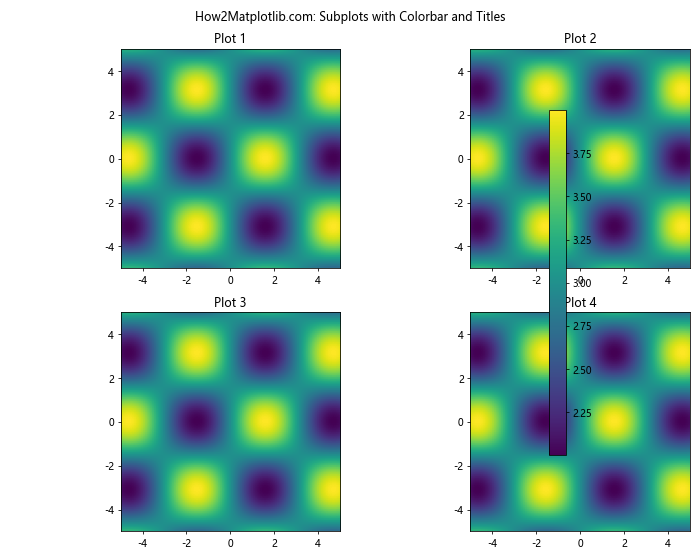
This example creates a 2×2 grid of subplots, each containing a 2D plot with a shared colorbar. Each subplot has its own title.
Matplotlib Subplots Title with Different Plot Types
You can add titles to subplots containing different types of plots. Here’s an example showcasing various plot types with titles:
import matplotlib.pyplot as plt
import numpy as np

fig, axs = plt.subplots(2, 2, figsize=(10, 8))
fig.suptitle("How2Matplotlib.com: Different Plot Types with Titles")

# Line plot
x = np.linspace(0, 10, 100)
axs[0, 0].plot(x, np.sin(x))
axs[0, 0].set_title("Line Plot")

# Scatter plot
x = np.random.rand(50)
y = np.random.rand(50)
axs[0, 1].scatter(x, y)
axs[0, 1].set_title("Scatter Plot")

# Bar plot
categories = ['A', 'B', 'C', 'D']
values = [3, 7, 2, 5]
axs[1, 0].bar(categories, values)
axs[1, 0].set_title("Bar Plot")

# Histogram
data = np.random.randn(1000)
axs[1, 1].hist(data, bins=30)
axs[1, 1].set_title("Histogram")

plt.tight_layout()
plt.show()
Output:
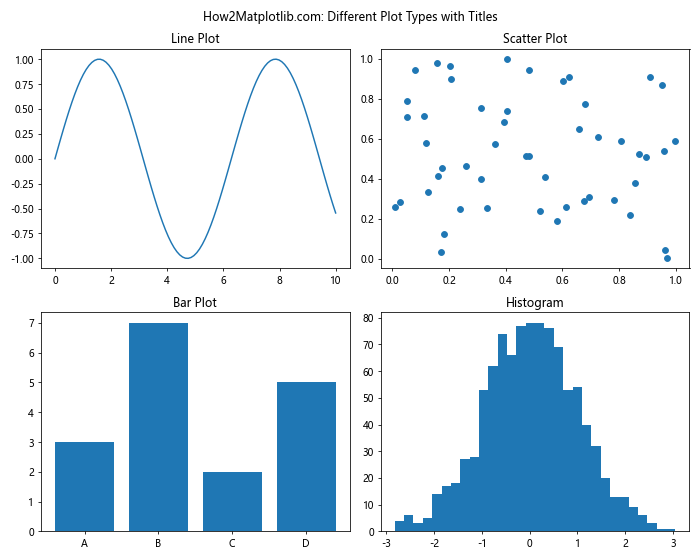
This example creates four different types of plots (line plot, scatter plot, bar plot, and histogram) in a 2×2 grid, each with its own title.
Matplotlib Subplots Title Conclusion
Mastering Matplotlib Subplots Title is crucial for creating informative and visually appealing multi-plot figures. This comprehensive guide has covered various aspects of working with subplot titles, including basic usage, customization, positioning, and advanced techniques. By applying these concepts and examples, you can enhance your data visualization skills and create more effective and professional-looking plots.
Remember to experiment with different title styles, positions, and formatting options to find the best approach for your specific visualization needs. With practice and creativity, you can leverage Matplotlib Subplots Title feature to create compelling and informative data visualizations that effectively communicate your insights.