Legend Location in Matplotlib
When creating plots using Matplotlib, it is important to include a legend to provide information about the data being displayed. The legend helps viewers understand the meaning of different elements in the plot. One key aspect of the legend is its location on the plot. In this article, we will explore different ways to customize the location of the legend in Matplotlib.
Default Legend Location
By default, Matplotlib places the legend in the upper right corner of the plot. Let’s create a simple plot and visualize the default legend location.
import matplotlib.pyplot as plt

x = [1, 2, 3, 4, 5]
y = [2, 3, 5, 7, 11]

plt.plot(x, y, label='Prime Numbers')
plt.legend()
plt.show()
Output:
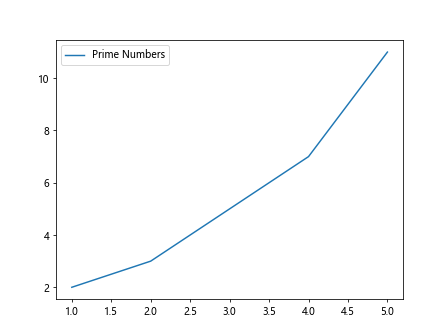
In this example, the legend is placed in the upper right corner by default.
Customizing Legend Location
There are several ways to customize the location of the legend in Matplotlib. We can specify the exact coordinates where we want the legend to be placed. Let’s see an example.
import matplotlib.pyplot as plt

x = [1, 2, 3, 4, 5]
y = [2, 3, 5, 7, 11]

plt.plot(x, y, label='Prime Numbers')
plt.legend(loc=(0.5, 0.5))
plt.show()
Output:
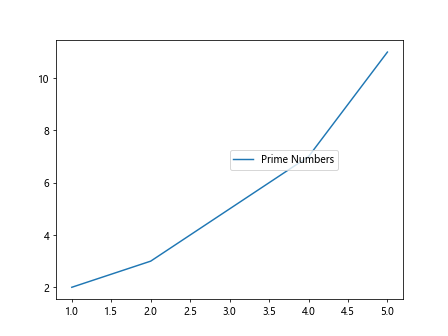
In this example, we have specified the location of the legend using the loc parameter. The loc parameter takes a tuple of (x, y) coordinates where (0, 0) is the bottom left corner and (1, 1) is the top right corner.
Predefined Location Strings
Matplotlib provides several predefined strings that can be used to specify the location of the legend. Some of the common strings are:
- ‘upper left’
- ‘upper right’
- ‘lower left’
- ‘lower right’
- ‘center’
- ‘upper center’
- ‘lower center’
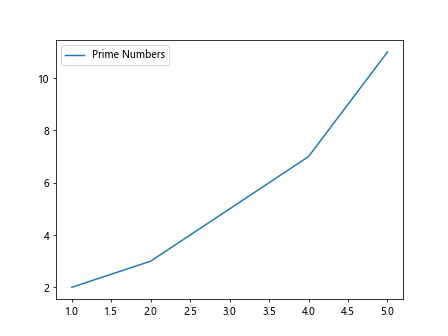
Let’s use one of these predefined strings to position the legend.
import matplotlib.pyplot as plt

x = [1, 2, 3, 4, 5]
y = [2, 3, 5, 7, 11]

plt.plot(x, y, label='Prime Numbers')
plt.legend(loc='upper left')
plt.show()
Output:
Legend Outside the Plot
Sometimes it is desirable to place the legend outside the plot area to prevent it from overlapping with the data. We can achieve this by using the bbox_to_anchor parameter. Let’s see an example.
import matplotlib.pyplot as plt

x = [1, 2, 3, 4, 5]
y = [2, 3, 5, 7, 11]

plt.plot(x, y, label='Prime Numbers')
plt.legend(loc='center left', bbox_to_anchor=(1, 0.5))
plt.show()
Output:
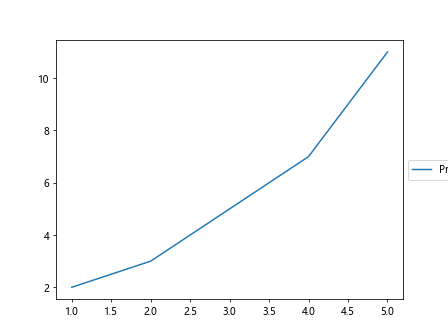
In this example, the legend is placed to the left of the plot area.
Multiple Legends
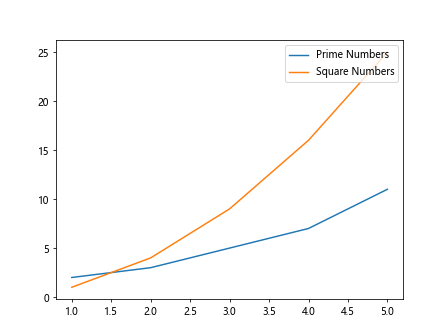
It is also possible to have multiple legends on a single plot. This can be achieved by using the label parameter in each plot and calling plt.legend() multiple times with different labels.
Let’s create a plot with multiple legends.
import matplotlib.pyplot as plt

x = [1, 2, 3, 4, 5]
y = [2, 3, 5, 7, 11]

x2 = [1, 2, 3, 4, 5]
y2 = [1, 4, 9, 16, 25]

plt.plot(x, y, label='Prime Numbers')
plt.plot(x2, y2, label='Square Numbers')
plt.legend(loc='upper right')
plt.show()
Output:
Legend Title
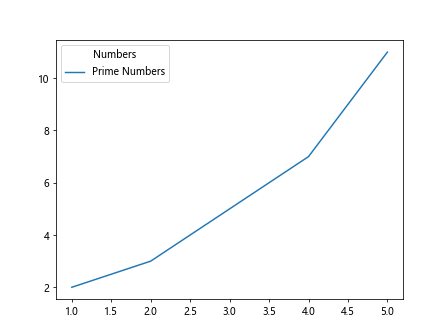
We can add a title to the legend using the title parameter. This can provide additional information about the data being displayed in the legend.
import matplotlib.pyplot as plt

x = [1, 2, 3, 4, 5]
y = [2, 3, 5, 7, 11]

plt.plot(x, y, label='Prime Numbers')
plt.legend(title='Numbers')
plt.show()
Output:
Customizing Legend Appearance
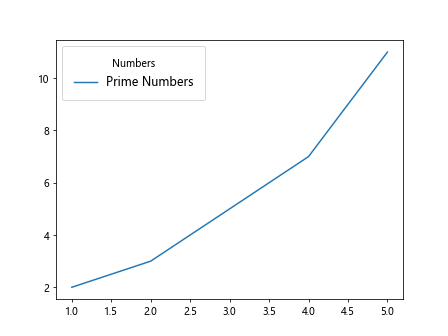
In addition to customizing the location of the legend, we can also change its appearance. We can modify the font size, font style, padding, border, and other properties of the legend.
Let’s see an example of customizing the legend appearance.
import matplotlib.pyplot as plt

x = [1, 2, 3, 4, 5]
y = [2, 3, 5, 7, 11]

plt.plot(x, y, label='Prime Numbers')
plt.legend(title='Numbers', fontsize='large', borderpad=1)
plt.show()
Output:
Removing the Legend
If you want to remove the legend from the plot, you can simply call plt.legend() without any arguments.
plt.plot(x, y)
plt.legend().remove()
plt.show()
Legend Location in Matplotlib Conclusion
In this article, we have explored different ways to customize the location of the legend in Matplotlib. By using predefined location strings, specifying coordinates, placing the legend outside the plot, adding titles, customizing appearance, and handling multiple legends, we can create informative and visually appealing plots. Experiment with these techniques to find the best way to display legends in your Matplotlib plots.