Matplotlib Title Bold
Matplotlib is a popular Python library used for creating static, animated, and interactive visualizations in Python. It provides a wide range of functionalities to customize and enhance the appearance of plots, including the ability to modify fonts, colors, sizes, and styles. One such customization is making the title of a plot bold.
Setting Title Font Weight to Bold
To make the title of a plot bold in Matplotlib, we can use the set_weight method available for the Text object, which represents the title. The set_weight method allows us to set the weight of the font to make it either bold or normal.
Here is the general syntax to set the font weight of a title to bold:
import matplotlib.pyplot as plt

plt.title("Title", fontweight="bold")

# Plotting code...
Now, let’s explore this customization further with some example plots.
Example Plots
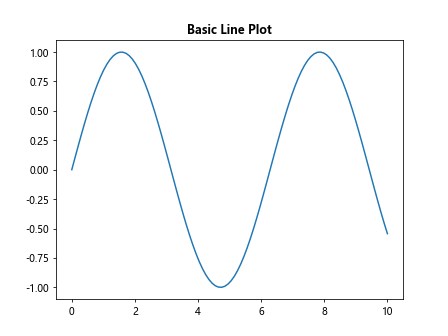
Example 1: Basic Line Plot
import matplotlib.pyplot as plt
import numpy as np

x = np.linspace(0, 10, 100)
y = np.sin(x)

plt.plot(x, y)
plt.title("Basic Line Plot", fontweight="bold")
plt.show()
Output:
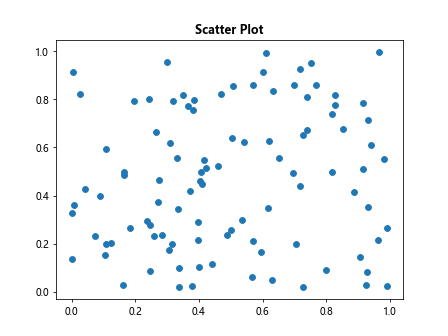
Example 2: Scatter Plot
import matplotlib.pyplot as plt
import numpy as np

x = np.random.rand(100)
y = np.random.rand(100)

plt.scatter(x, y)
plt.title("Scatter Plot", fontweight="bold")
plt.show()
Output:
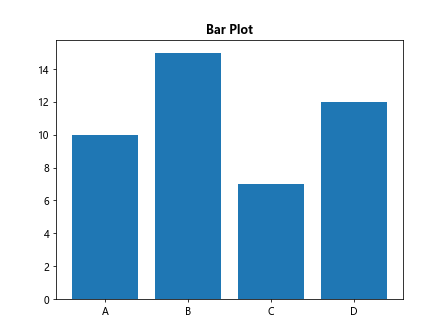
Example 3: Bar Plot
import matplotlib.pyplot as plt

x = ["A", "B", "C", "D"]
y = [10, 15, 7, 12]

plt.bar(x, y)
plt.title("Bar Plot", fontweight="bold")
plt.show()
Output:
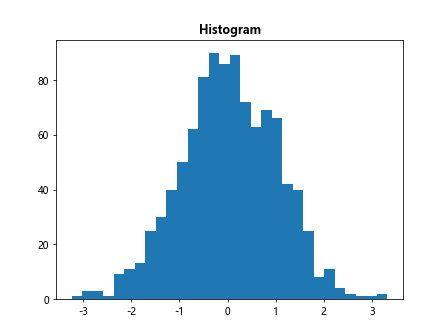
Example 4: Histogram
import matplotlib.pyplot as plt
import numpy as np

x = np.random.randn(1000)

plt.hist(x, bins=30)
plt.title("Histogram", fontweight="bold")
plt.show()
Output:
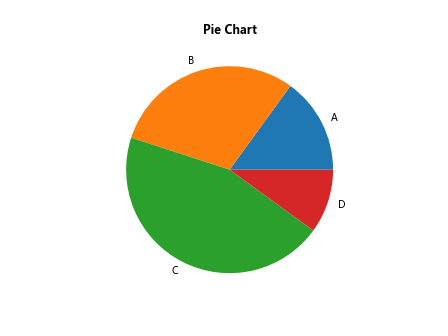
Example 5: Pie Chart
import matplotlib.pyplot as plt

sizes = [15, 30, 45, 10]
labels = ["A", "B", "C", "D"]

plt.pie(sizes, labels=labels)
plt.title("Pie Chart", fontweight="bold")
plt.show()
Output:
Example 6: Area Plot
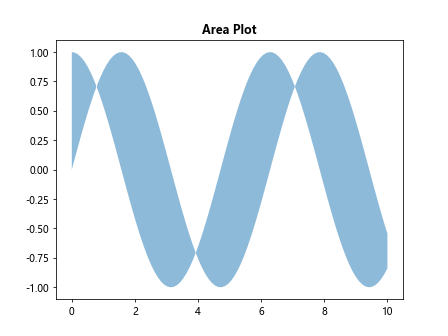
import matplotlib.pyplot as plt
import numpy as np

x = np.linspace(0, 10, 100)
y1 = np.sin(x)
y2 = np.cos(x)

plt.fill_between(x, y1, y2, alpha=0.5)
plt.title("Area Plot", fontweight="bold")
plt.show()
Output:
Example 7: Box Plot
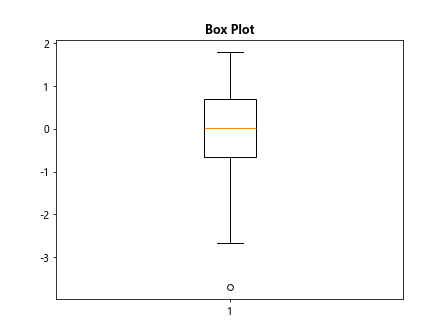
import matplotlib.pyplot as plt
import numpy as np

data = np.random.randn(100)

plt.boxplot(data)
plt.title("Box Plot", fontweight="bold")
plt.show()
Output:
Example 8: Violin Plot
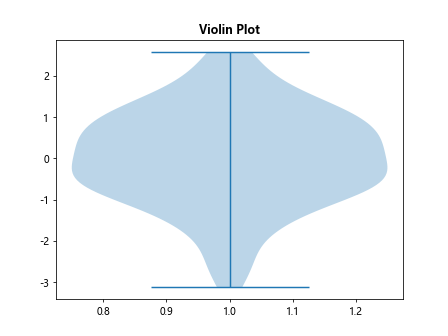
import matplotlib.pyplot as plt
import numpy as np

data = np.random.randn(100)

plt.violinplot(data)
plt.title("Violin Plot", fontweight="bold")
plt.show()
Output:
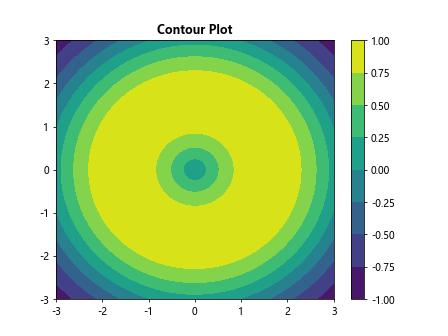
Example 9: Contour Plot
import matplotlib.pyplot as plt
import numpy as np

x = np.linspace(-3, 3, 100)
y = np.linspace(-3, 3, 100)
X, Y = np.meshgrid(x, y)
Z = np.sin(np.sqrt(X**2 + Y**2))

plt.contourf(X, Y, Z)
plt.colorbar()
plt.title("Contour Plot", fontweight="bold")
plt.show()
Output:
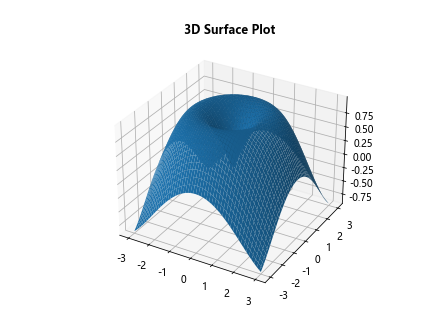
Example 10: 3D Surface Plot
import matplotlib.pyplot as plt
import numpy as np
from mpl_toolkits.mplot3d import Axes3D

x = np.linspace(-3, 3, 100)
y = np.linspace(-3, 3, 100)
X, Y = np.meshgrid(x, y)
Z = np.sin(np.sqrt(X**2 + Y**2))

fig = plt.figure()
ax = fig.add_subplot(111, projection="3d")
ax.plot_surface(X, Y, Z)
plt.title("3D Surface Plot", fontweight="bold")
plt.show()
Output:
By applying the fontweight="bold" parameter to the title method, we can easily make the title of any plot bold in Matplotlib. This customization can be combined with other formatting options to create visually appealing and informative plots for data analysis and presentation.
Remember to import the necessary modules and packages, such as matplotlib.pyplot and numpy, before using the code examples provided above. Experiment with these examples and explore Matplotlib’s extensive customization options to create your own bold-titled plots.