Matplotlib savefig Cuts Off
When working with Matplotlib, a popular data visualization library in Python, you might encounter a situation where the savefig function cuts off part of your plot. This can be frustrating, especially when you want to export a high-quality image or generate a graphic for a report or presentation. In this article, we will explore the reasons behind this issue and provide some solutions to ensure your plots are saved without any cut-offs.
Understanding the Issue
The savefig function in Matplotlib is responsible for saving your plots to a file. However, by default, it only saves the visible portion of the plot, which can cause undesired cut-offs. This behavior is due to the default DPI (dots per inch) setting used by savefig. When you call savefig, it uses the value specified in the figure.dpi attribute.
When this DPI value is low, Matplotlib may truncate the image, resulting in cut-offs. This is because low DPI values allocate fewer pixels for the plot, ultimately causing it to be clipped. The default value is 100, but sometimes this may not be sufficient for high-quality image export.
Matplotlib savefig Cuts Off Solutions
To overcome the issue of savefig cutting off your plots, you can employ any of the following solutions:
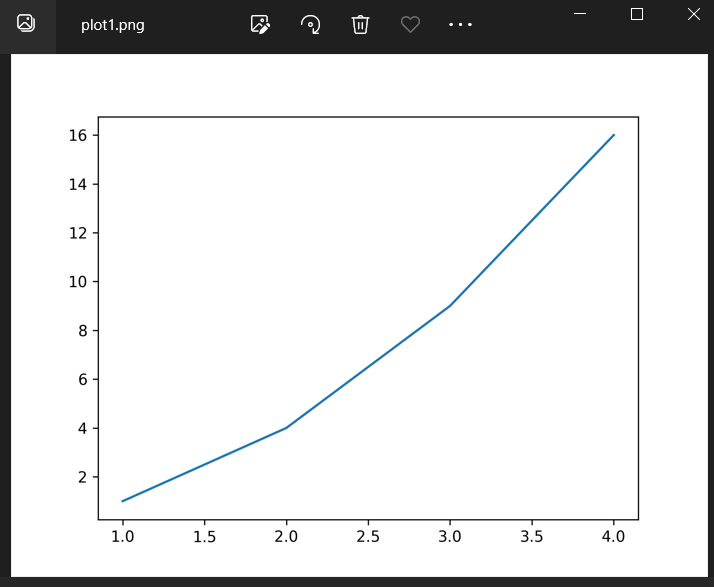
1. Increase DPI
By increasing the DPI value when saving the figure, you can allocate more pixels to the plot, reducing the chances of any cut-offs. Let’s see an example:
import matplotlib.pyplot as plt

# Create a simple plot
plt.plot([1, 2, 3, 4], [1, 4, 9, 16])

# Increase the DPI to 300
plt.savefig("plot1.png", dpi=300)
By setting the dpi parameter to 300, we can ensure that the saved image has a higher resolution, minimizing the possibility of cut-offs. Execute this code and check the output image plot1.png to observe the difference.
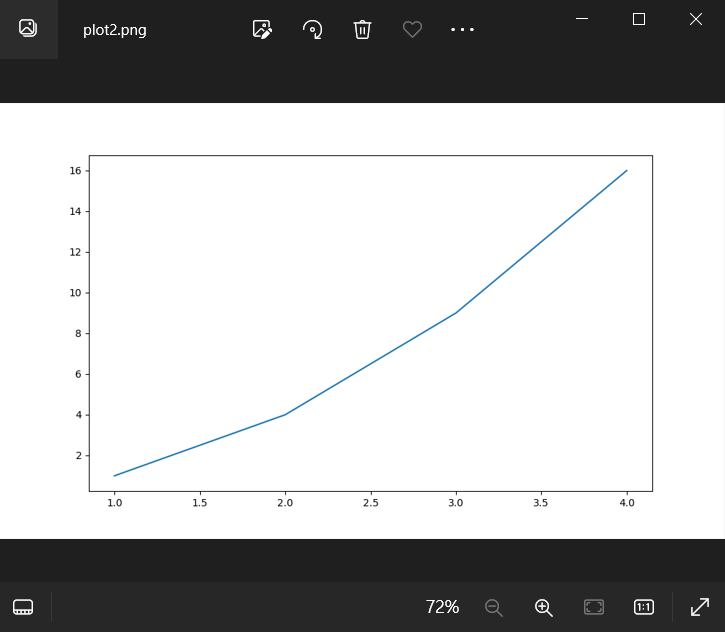
2. Adjust Figure Size
Another way to prevent cut-offs is by adjusting the figure size before saving. By increasing the dimensions of the figure, you can provide more space for the plot to be fully displayed. Here’s an example code:
import matplotlib.pyplot as plt

# Create a simple plot
plt.plot([1, 2, 3, 4], [1, 4, 9, 16])

# Adjust the figure size to (10, 6) inches
plt.gcf().set_size_inches(10, 6)

# Save the figure
plt.savefig("plot2.png")
In this code, we use plt.gcf() to get a reference to the current figure and then set its size using set_size_inches. By changing the dimensions to (10, 6) inches, we provide more space for the plot to be displayed properly. Run this code and check the saved image plot2.png to observe the impact.
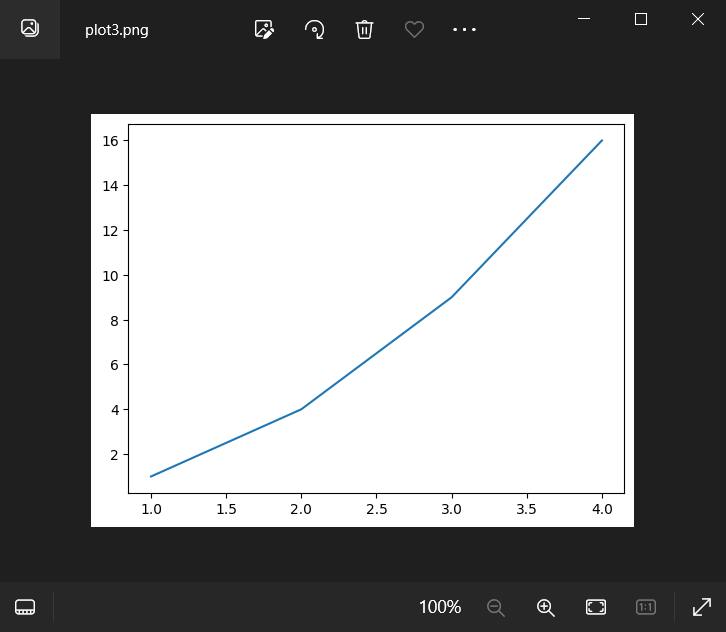
3. Use the bbox_inches Parameter
Matplotlib’s savefig function also provides the bbox_inches parameter, which can be used to control the portion of the figure saved to the file. By setting it to 'tight', Matplotlib will attempt to remove any unnecessary whitespace surrounding the plot, resulting in a tighter fit. Let’s see an example:
import matplotlib.pyplot as plt

# Create a simple plot
plt.plot([1, 2, 3, 4], [1, 4, 9, 16])

# Save the figure with tight bounding box
plt.savefig("plot3.png", bbox_inches='tight')
In this example, we specify bbox_inches='tight' to instruct savefig to remove excess whitespace. Execute this code and check the output image plot3.png to see the result.
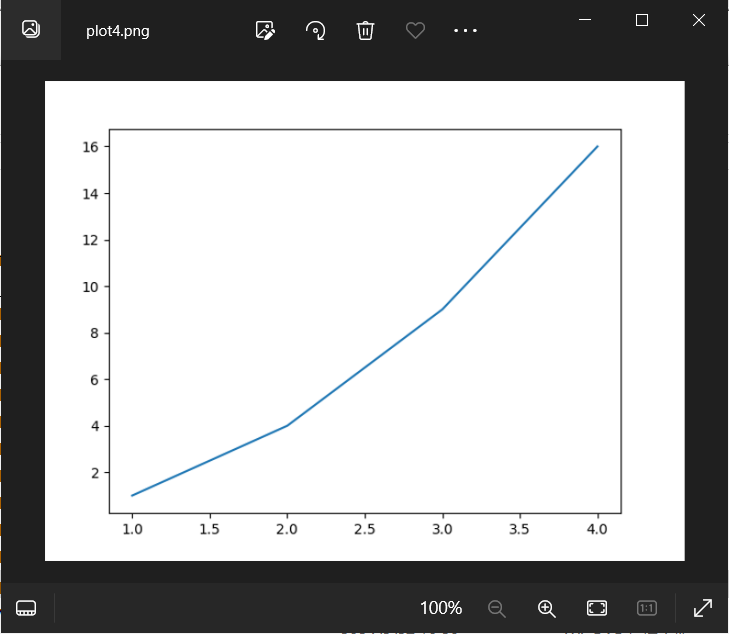
4. Adjust Margins
You can manually adjust the margins of your plot using Matplotlib’s subplots_adjust function. By tweaking the margins, you can create more space for the plot, reducing the chances of cut-offs. Here’s an example:
import matplotlib.pyplot as plt

# Create a simple plot
plt.plot([1, 2, 3, 4], [1, 4, 9, 16])

# Adjust the margins
plt.subplots_adjust(left=0.1, right=0.9, top=0.9, bottom=0.1)

# Save the figure
plt.savefig("plot4.png")
In this code, we use subplots_adjust to modify the margins of the plot. By assigning appropriate values to left, right, top, and bottom, we can increase the available plot area. Execute this code and check the saved image plot4.png to observe the impact.
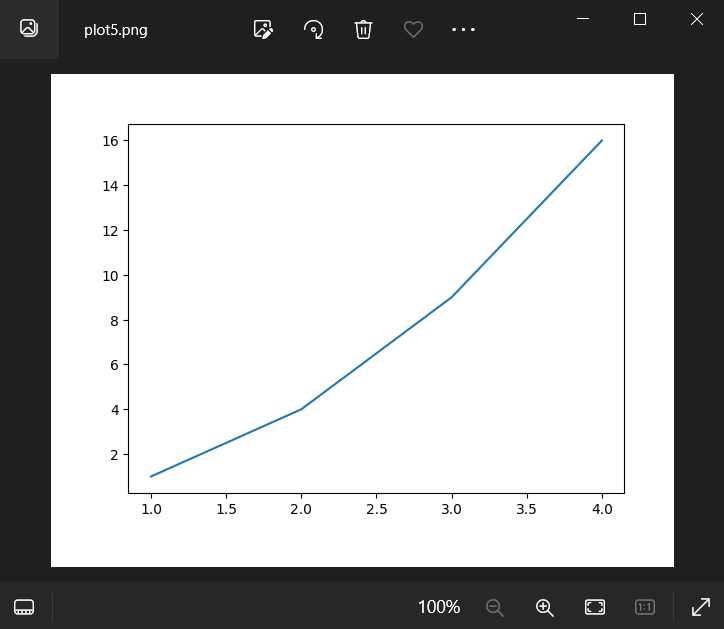
5. Use the pad_inches Parameter
The savefig function provides another parameter called pad_inches, which can be used to extend the bounding box. By increasing the padding, you can prevent any potential cut-offs. Here’s an example:
import matplotlib.pyplot as plt

# Create a simple plot
plt.plot([1, 2, 3, 4], [1, 4, 9, 16])

# Save the figure with increased padding
plt.savefig("plot5.png", bbox_inches='tight', pad_inches=0.5)
In this code, we specify pad_inches=0.5 to increase the padding around the plot. Execute this code and check the output image plot5.png to see the effect.
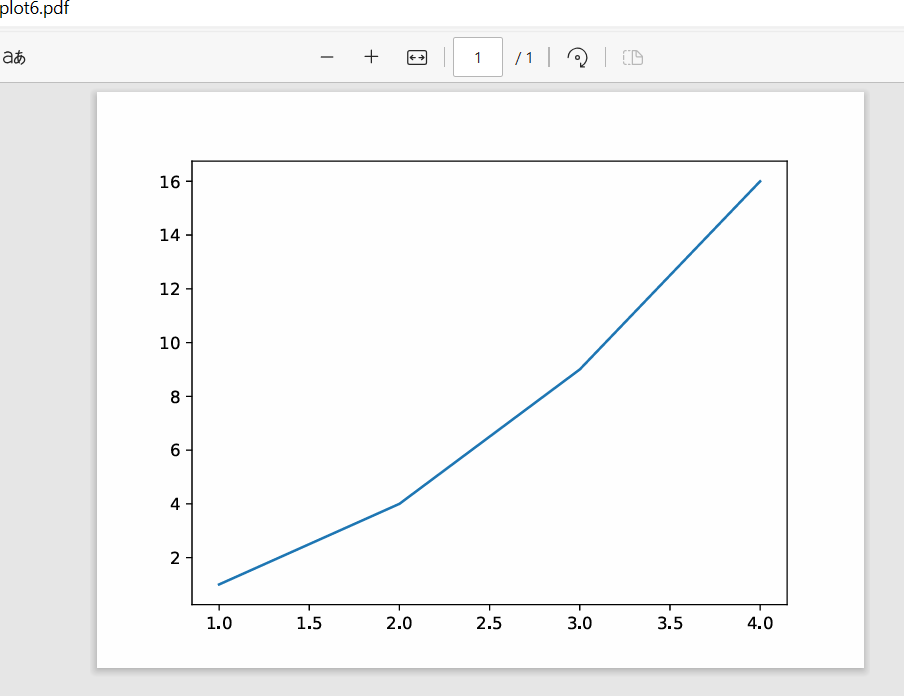
6. Export as Vector Graphics
Instead of saving the plot as a raster image (e.g., PNG), you can choose to export it as a vector graphics file (e.g., PDF, SVG). Vector graphics are resolution-independent, meaning they can be scaled to any size without loss of quality. Here’s an example:
import matplotlib.pyplot as plt

# Create a simple plot
plt.plot([1, 2, 3, 4], [1, 4, 9, 16])

# Export as PDF file
plt.savefig("plot6.pdf")
In this code, we save the plot as a PDF file using the savefig function. PDF files are vector graphics, so you won’t face any cut-offs due to resolution limitations. Execute this code and check the exported PDF file plot6.pdf.
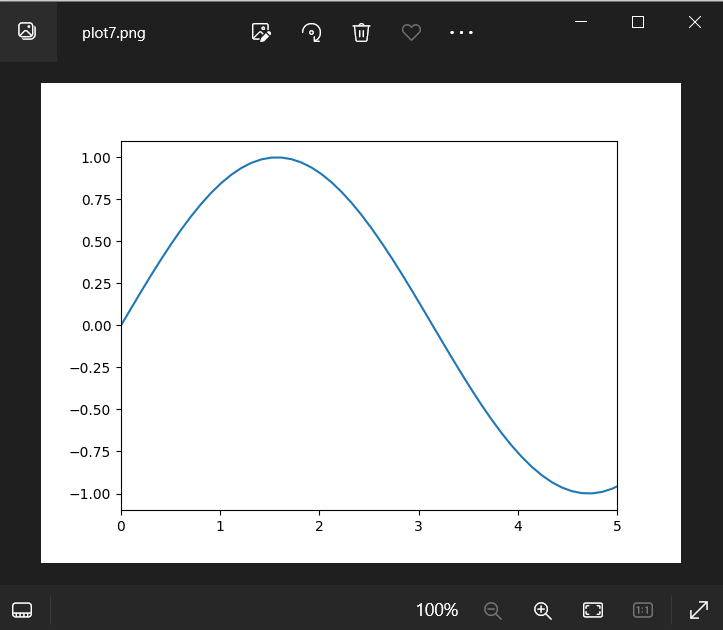
7. Check Limits and Ranges
Occasionally, cut-offs may occur because the plot’s limits or ranges are not properly set. For example, if your plot’s x-axis range is smaller than the actual data, the savefig function might cut off part of the plot. Ensure that the limits and ranges are correctly specified for all axes. Here’s an example to illustrate:
import matplotlib.pyplot as plt
import numpy as np

# Generate some data
x = np.linspace(0, 10, 100)
y = np.sin(x)

# Create a plot with incorrect xlim
plt.plot(x, y)
plt.xlim(0, 5)

# Save the figure
plt.savefig("plot7.png")
In this code, we generate a sine wave data and plot it, but set the x-axis limits to only cover half of the data range. As a result, when saving the figure, the plot will be cut off. Run this code and check the saved image plot7.png to observe the issue.
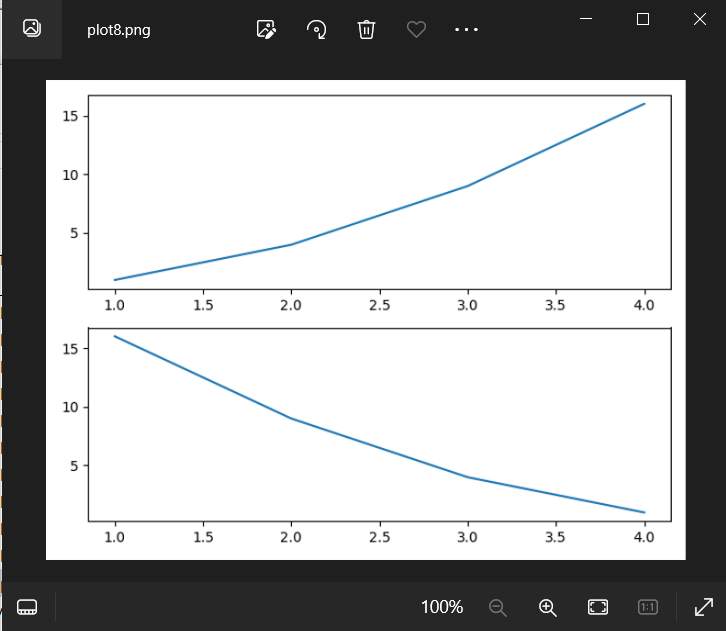
8. Adjust Subplot Layout
If you are working with subplots or multiple axes, you might face issues with cut-offs. In such cases, you can adjust the layout of the subplots to ensure they fit properly in the figure. Here’s an example:
import matplotlib.pyplot as plt

# Create two subplots
fig, axs = plt.subplots(2, 1)

# Plot 1
axs[0].plot([1, 2, 3, 4], [1, 4, 9, 16])

# Plot 2
axs[1].plot([1, 2, 3, 4], [16, 9, 4, 1])

# Adjust layout
plt.tight_layout()

# Save the figure
plt.savefig("plot8.png")
In this code, we create two subplots and plot different data on each. The tight_layout function is then called to adjust the spacing between subplots, ensuring they fit properly without any cut-offs. Execute this code and check the saved image plot8.png to seethe effect.
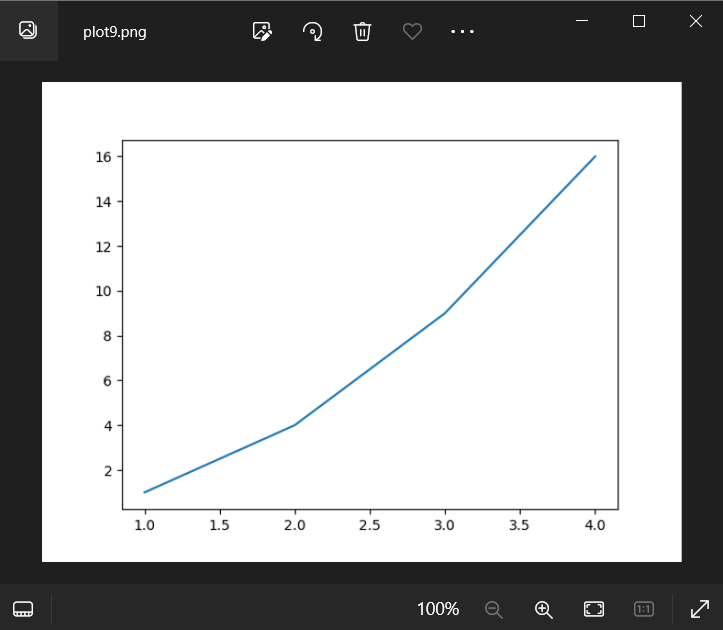
9. Use the constrained_layout Parameter
Starting from Matplotlib version 3.4, there is a new constrained_layout parameter available in the savefig function. This parameter automatically adjusts the layout to prevent any overlapping or cut-offs in the saved figure. Here’s an example:
import matplotlib.pyplot as plt

# Create a simple plot
plt.plot([1, 2, 3, 4], [1, 4, 9, 16])

# Save the figure with constrained layout
plt.savefig("plot9.png", constrained_layout=True)
In this code, we set constrained_layout=True when calling savefig. This enables the automatic layout adjustment, ensuring that no cut-offs occur. Execute this code and check the output image plot9.png to observe the difference.
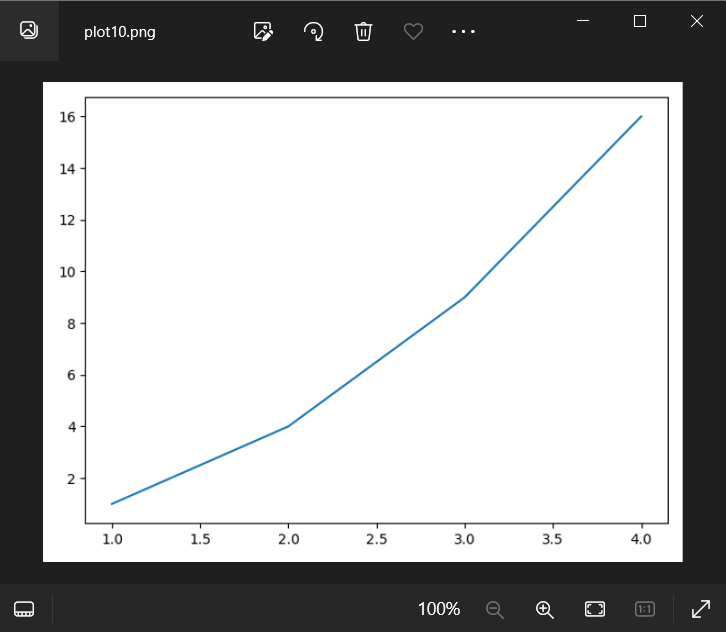
10. Use Matplotlib’s tight_layout
In addition to the bbox_inches parameter, Matplotlib provides the tight_layout function that can be used to adjust the layout of the plot. This function automatically adjusts the positions of subplots and axes to eliminate any overlapping or cut-offs. Here’s an example:
import matplotlib.pyplot as plt

# Create a simple plot
plt.plot([1, 2, 3, 4], [1, 4, 9, 16])

# Adjust layout using tight_layout
plt.tight_layout()

# Save the figure
plt.savefig("plot10.png")
In this code, we use tight_layout to automatically adjust the layout of the plot. This automatically rearranges the plot elements to eliminate any cut-offs. Execute this code and check the saved image plot10.png to observe the impact.
Matplotlib savefig Cuts Off Conclusion
Dealing with cut-offs when using Matplotlib’s savefig function can be frustrating, but with the solutions mentioned in this article, you can ensure that your plots are saved without any cut-offs. By adjusting the DPI, figure size, margins, padding, layout, and using vector graphics formats, you can overcome this issue and save high-quality images for your analysis, reports, or presentations. Experiment with different solutions to find the one that suits your specific requirements best. Happy plotting!