Matplotlib savefig dpi
Matplotlib is one of the most popular libraries for creating visualizations in Python. It provides a robust set of functions to create and customize plots, charts, and graphs. One of the crucial functions in Matplotlib is savefig, which allows users to save figures to various file formats. In this article, we will explore the dpi parameter in the savefig function and its significance in generating high-quality plots.
Matplotlib savefig dpi Overview
dpi stands for “dots per inch” and determines the resolution or clarity of the saved image. The higher the dpi, the more dots (or pixels) per inch, resulting in a higher resolution image. By default, the dpi value is set to 100. However, you can specify a different dpi value according to your requirements.
Setting dpi in savefig function in Matplotlib
The savefig function in Matplotlib has an optional parameter to specify the dpi. It can take an integer value representing the desired dots per inch. Let’s look at an example demonstrating the use of dpi in the savefig function:
import matplotlib.pyplot as plt
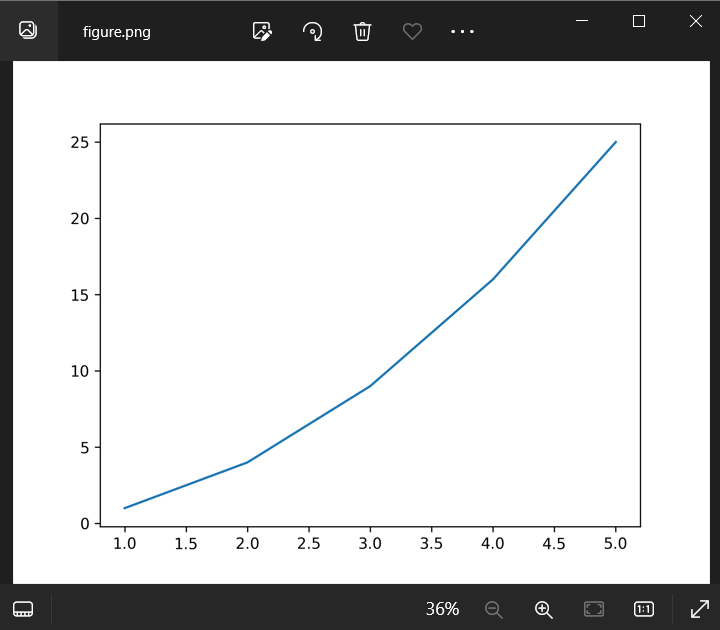
# Creating a simple line plot
x = [1, 2, 3, 4, 5]
y = [1, 4, 9, 16, 25]
plt.plot(x, y)
# Saving the figure with dpi set to 300
plt.savefig('figure.png', dpi=300)
In this example, we create a simple line plot using plot function provided by Matplotlib. Then, we use the savefig function to save the plot as an image file named ‘figure.png’. The dpi parameter is set to 300, which specifies a high-resolution image.
Importance of dpi in savefig in Matplotlib
The dpi parameter is crucial when generating plots for different purposes. A higher dpi results in a clearer and more detailed image, suitable for presentations, print media, or publications. On the other hand, a lower dpi can be used for images that will only be displayed on digital screens.
By adjusting the dpi value, you can control the image’s size, quality, and file size. However, keep in mind that increasing the dpi also increases the file size significantly. Hence, it’s essential to consider the intended usage and storage constraints while setting the dpi.
Matplotlib savefig dpi Examples
Here are ten code examples that demonstrate the usage of savefig with different dpi values:
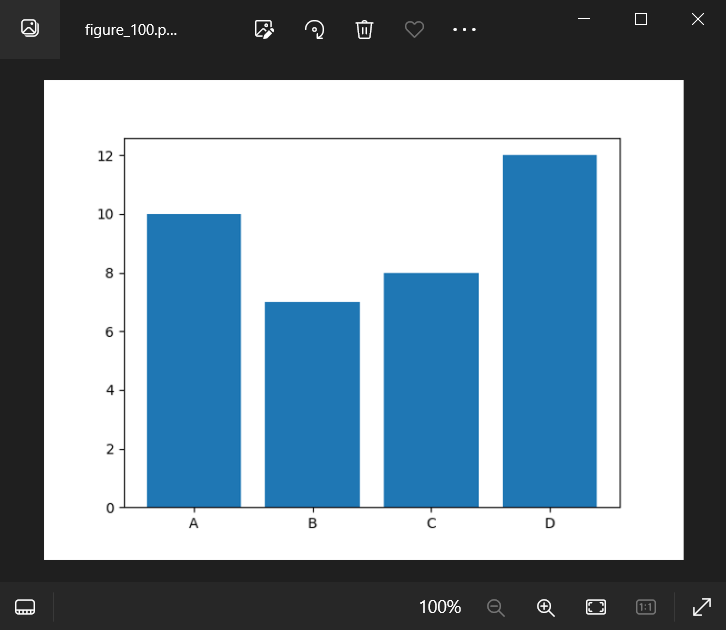
Example 1: dpi = 100 (default)
import matplotlib.pyplot as plt

# Creating a simple bar plot
x = ['A', 'B', 'C', 'D']
y = [10, 7, 8, 12]
plt.bar(x, y)

# Saving the figure with default dpi (100)
plt.savefig('figure_100.png')
Output:
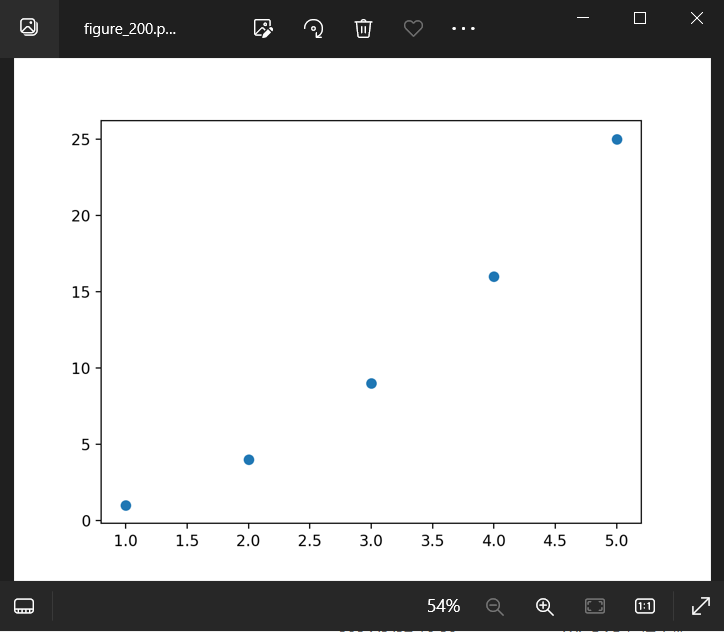
Example 2: dpi = 200
import matplotlib.pyplot as plt

# Creating a simple scatter plot
x = [1, 2, 3, 4, 5]
y = [1, 4, 9, 16, 25]
plt.scatter(x, y)

# Saving the figure with dpi set to 200
plt.savefig('figure_200.png', dpi=200)
Output:
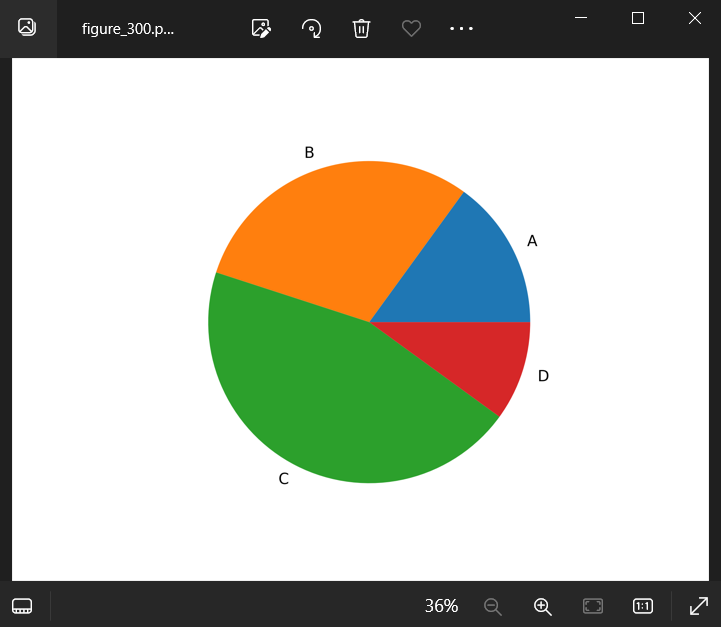
Example 3: dpi = 300
import matplotlib.pyplot as plt

# Generating a pie chart
labels = ['A', 'B', 'C', 'D']
sizes = [15, 30, 45, 10]
plt.pie(sizes, labels=labels)

# Saving the figure with dpi set to 300
plt.savefig('figure_300.png', dpi=300)
Output:
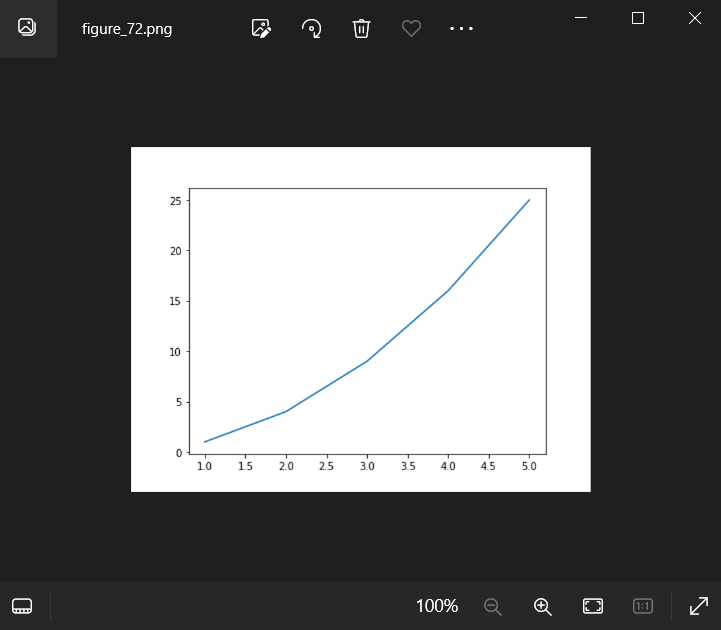
Example 4: dpi = 72
import matplotlib.pyplot as plt

# Creating a line plot
x = [1, 2, 3, 4, 5]
y = [1, 4, 9, 16, 25]
plt.plot(x, y)

# Saving the figure with dpi set to 72
plt.savefig('figure_72.png', dpi=72)
Output:
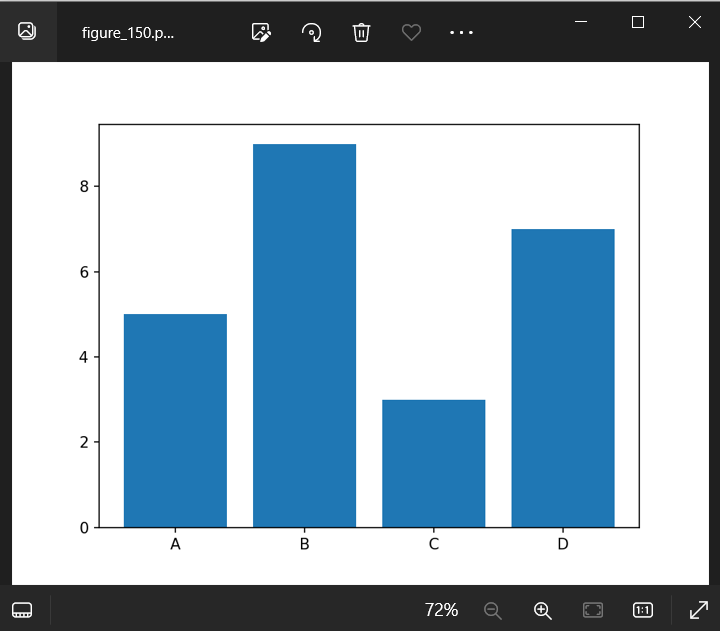
Example 5: dpi = 150
import matplotlib.pyplot as plt

# Generating a bar plot
x = ['A', 'B', 'C', 'D']
y = [5, 9, 3, 7]
plt.bar(x, y)

# Saving the figure with dpi set to 150
plt.savefig('figure_150.png', dpi=150)
Output:
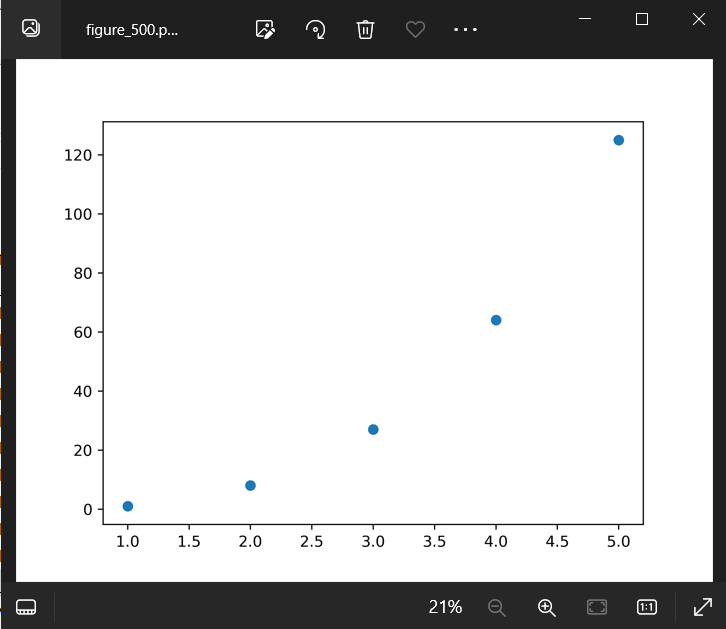
Example 6: dpi = 500
import matplotlib.pyplot as plt

# Creating a scatter plot
x = [1, 2, 3, 4, 5]
y = [1, 8, 27, 64, 125]
plt.scatter(x, y)

# Saving the figure with dpi set to 500
plt.savefig('figure_500.png', dpi=500)
Output:
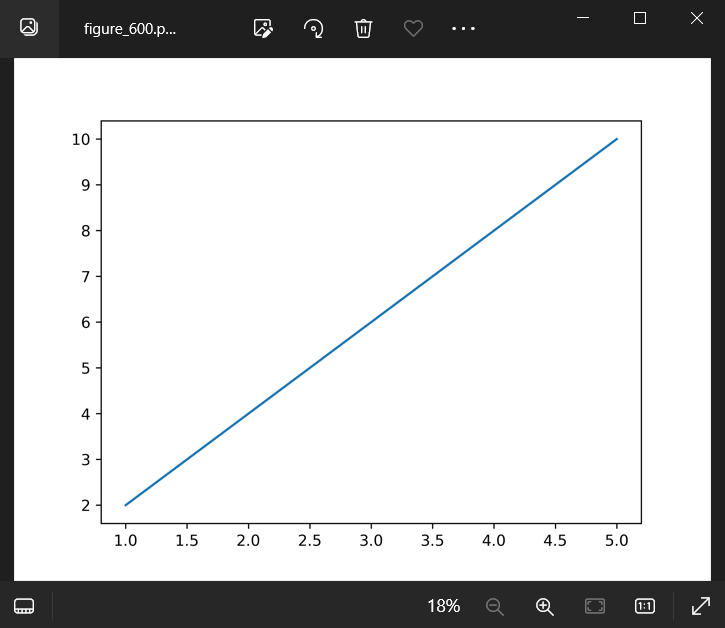
Example 7: dpi = 600
import matplotlib.pyplot as plt

# Generating a line plot
x = [1, 2, 3, 4, 5]
y = [2, 4, 6, 8, 10]
plt.plot(x, y)

# Saving the figure with dpi set to 600
plt.savefig('figure_600.png', dpi=600)
Output:
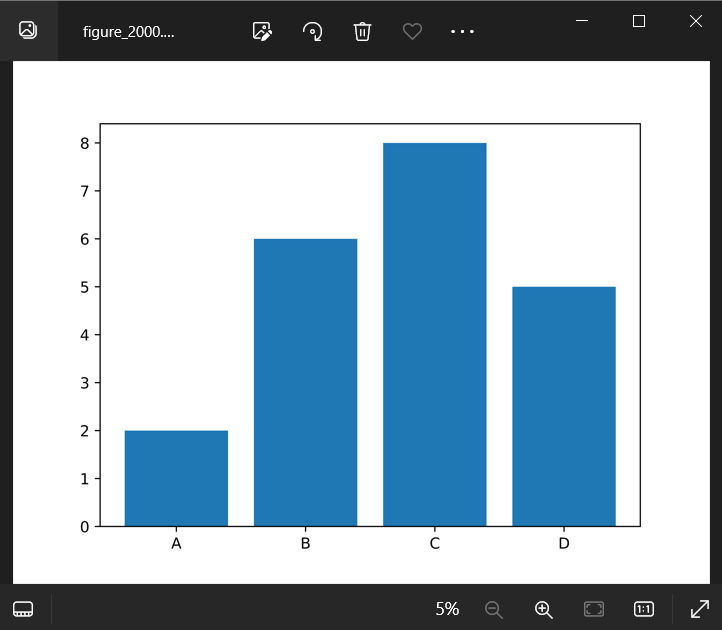
Example 8: dpi = 2000
import matplotlib.pyplot as plt

# Creating a bar plot
x = ['A', 'B', 'C', 'D']
y = [2, 6, 8, 5]
plt.bar(x, y)

# Saving the figure with dpi set to 2000
plt.savefig('figure_2000.png', dpi=2000)
Output:
Example 9: dpi = 50
import matplotlib.pyplot as plt

# Generating a line plot
x = [1, 2, 3, 4, 5]
y = [1, 3, 5, 7, 9]
plt.plot(x, y)

# Saving the figure with dpi set to 50
plt.savefig('figure_50.png', dpi=50)
Output:
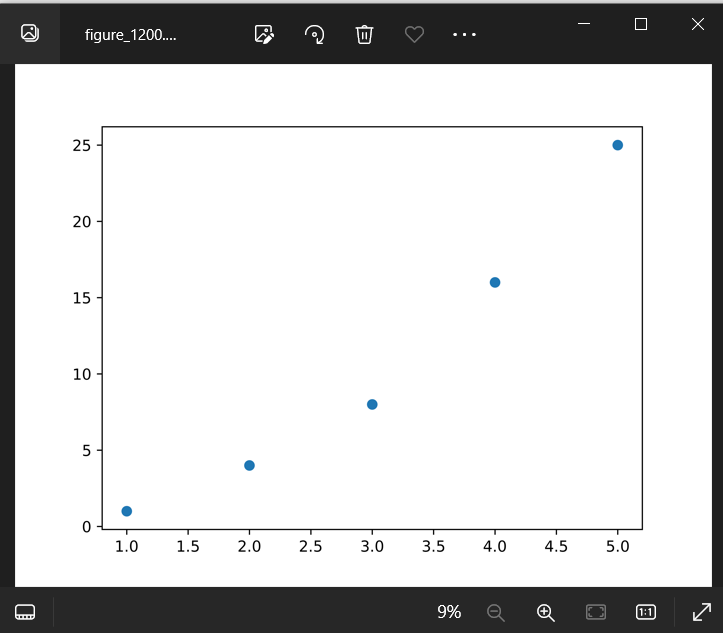
Example 10: dpi = 1200
import matplotlib.pyplot as plt

# Creating a scatter plot
x = [1, 2, 3, 4, 5]
y = [1, 4, 8, 16, 25]
plt.scatter(x, y)

# Saving the figure with dpi set to 1200
plt.savefig('figure_1200.png', dpi=1200)
Output:
In these examples, we set different dpi values ranging from 50 to 2000 and saved the respective figures. You can observe the difference in image quality and file size by comparing the outputs.
Matplotlib savefig dpi Conclusion
The dpi parameter in the savefig function of Matplotlib allows users to control the resolution and quality of the saved images. By providing a higher dpi value, you can generate clearer and detailed plots, suitable for various purposes like presentations, print media, or publications. However, it’s essential to consider the trade-off between image quality and file size while selecting the dpi value. Choose an appropriate dpi value based on the intended usage of the image.