Matplotlib savefig resolution
Matplotlib is a popular plotting library in Python that is widely used for creating high-quality visualizations. One important aspect of generating visualizations is to control the resolution or quality of the saved figures. In this article, we will explore different techniques to adjust the resolution of figures saved using the savefig function in Matplotlib.
Choosing the resolution in Matplotlib
Before we dive into the code examples, it is essential to understand what resolution means in the context of saving figures. Resolution refers to the number of pixels or dots per inch (dpi) in the saved image. Higher resolution results in more details and clarity in the figure but also increases the file size.
By default, Matplotlib saves figures with a resolution of 100 dpi. This default resolution might not be suitable for all use cases, especially when figures are going to be printed or displayed on high-resolution screens. To improve the resolution of saved figures, we can adjust the dpi parameter when calling the savefig function.
Matplotlib savefig resolution Code examples
Let’s look at some code examples that demonstrate how to adjust the resolution while saving figures in Matplotlib. We will use the savefig function along with the dpi parameter to control the resolution. Each example will provide the code execution and the resulting figure.
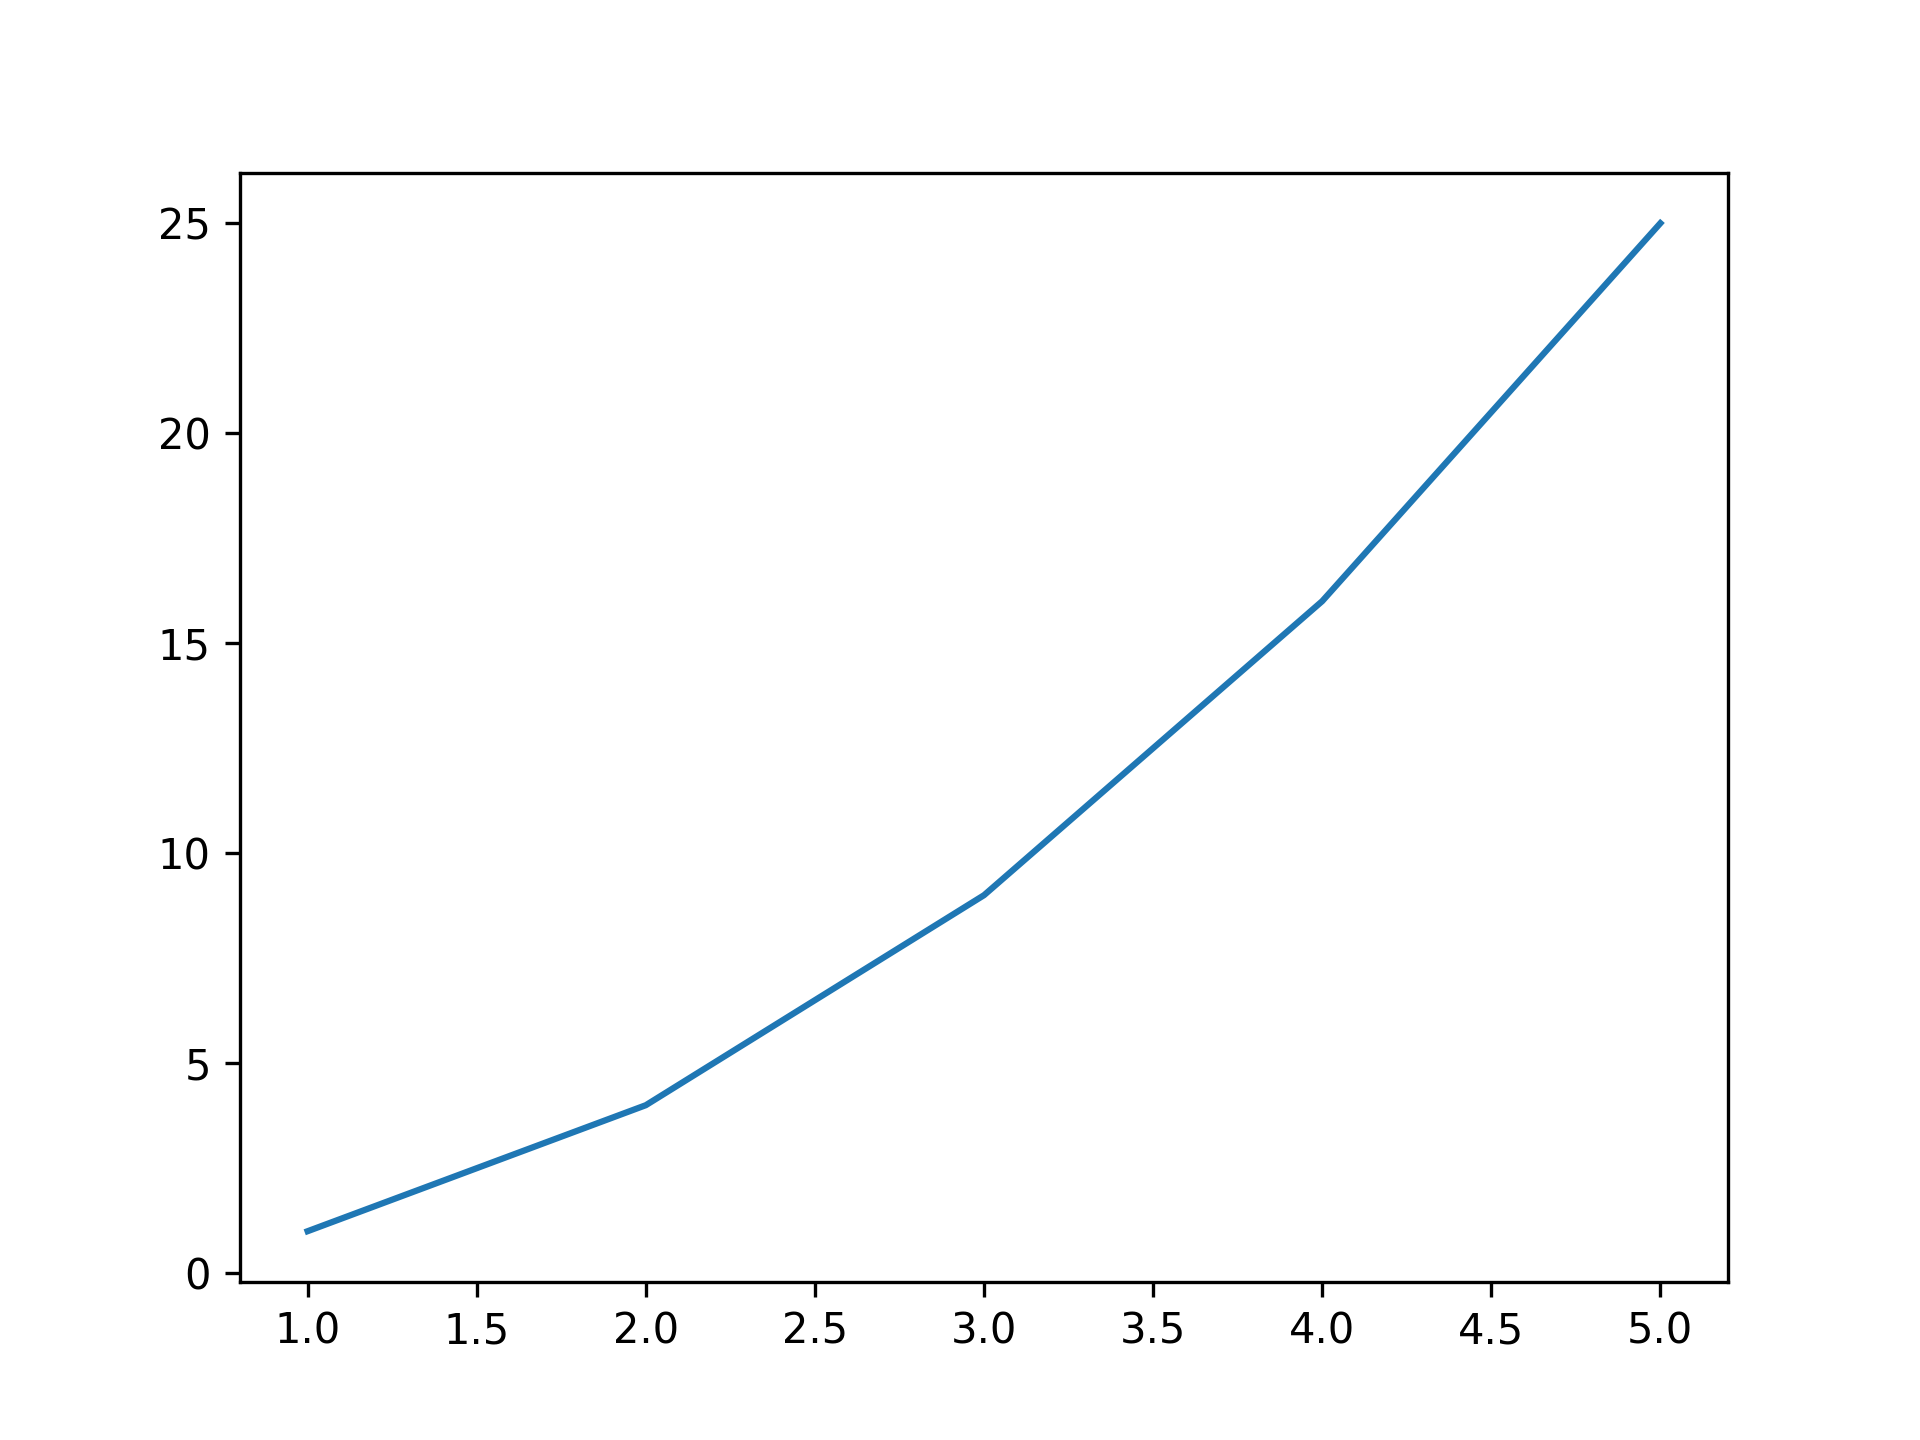
Example 1: Setting the resolution to 150 dpi
import matplotlib.pyplot as plt

# Create a simple plot
x = [1, 2, 3, 4, 5]
y = [1, 4, 9, 16, 25]

plt.plot(x, y)

# Save the figure with a resolution of 150 dpi
plt.savefig("how2matplotlib_figure_150dpi.png", dpi=150)
Output:

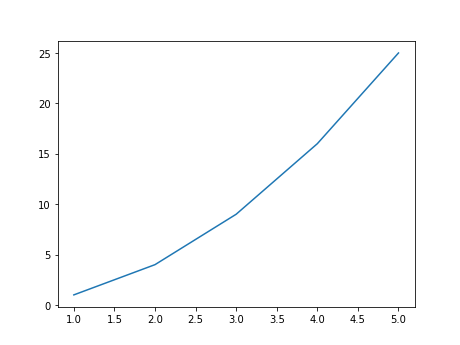
Example 2: Setting the resolution to 300 dpi
import matplotlib.pyplot as plt

# Create a simple plot
x = [1, 2, 3, 4, 5]
y = [1, 4, 9, 16, 25]

plt.plot(x, y)

# Save the figure with a resolution of 300 dpi
plt.savefig("figure_300dpi.png", dpi=300)
Output:
Example 3: Setting the resolution to 600 dpi
import matplotlib.pyplot as plt

# Create a simple plot
x = [1, 2, 3, 4, 5]
y = [1, 4, 9, 16, 25]

plt.plot(x, y)

# Save the figure with a resolution of 600 dpi
plt.savefig("figure_600dpi.png", dpi=600)
Output:

Example 4: Setting the resolution to 72 dpi (low resolution)
import matplotlib.pyplot as plt

# Create a simple plot
x = [1, 2, 3, 4, 5]
y = [1, 4, 9, 16, 25]

plt.plot(x, y)

# Save the figure with a low resolution of 72 dpi
plt.savefig("figure_72dpi-2.png", dpi=72)
Output:
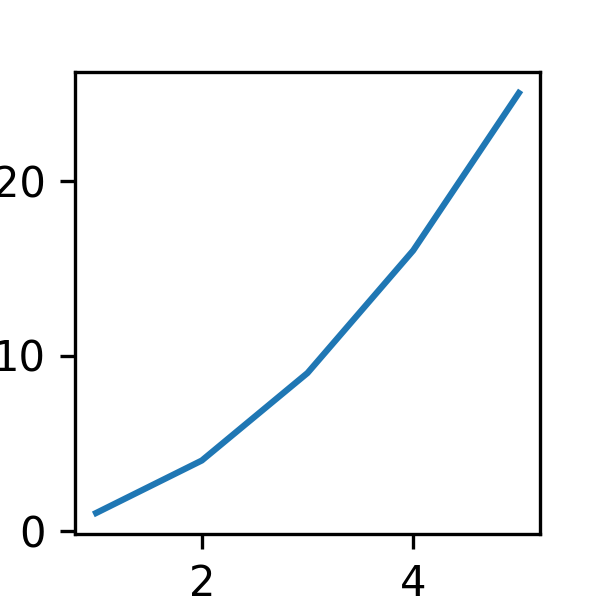
Example 5: Saving figure with higher resolution on a small plot
import matplotlib.pyplot as plt

# Create a small plot
x = [1, 2, 3, 4, 5]
y = [1, 4, 9, 16, 25]

plt.figure(figsize=(2, 2))  # Set a small figure size (2x2 inches)

plt.plot(x, y)

# Save the figure with a resolution of 300 dpi
plt.savefig("small_figure_300dpi.png", dpi=300)
Output:
Example 6: Saving figure with lower resolution on a large plot
import matplotlib.pyplot as plt

# Create a large plot
x = [1, 2, 3, 4, 5]
y = [1, 4, 9, 16, 25]

plt.figure(figsize=(10, 10))  # Set a large figure size (10x10 inches)

plt.plot(x, y)

# Save the figure with a lower resolution of 72 dpi
plt.savefig("large_figure_72dpi.png", dpi=72)
Output:

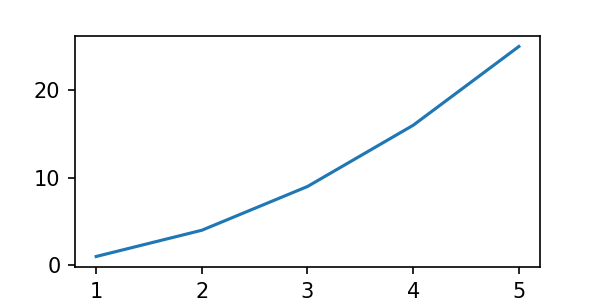
Example 7: Saving figure with different resolutions and aspect ratios
import matplotlib.pyplot as plt

# Create a plot with different aspect ratios
x = [1, 2, 3, 4, 5]
y = [1, 4, 9, 16, 25]

plt.figure(figsize=(4, 2))  # Set a different aspect ratio (4:2)

plt.plot(x, y)

# Save the figure with a resolution of 150 dpi
plt.savefig("figure_aspect_ratio.png", dpi=150)
Output:
Example 8: Saving figure in different formats with high resolution
import matplotlib.pyplot as plt

# Create a simple plot
x = [1, 2, 3, 4, 5]
y = [1, 4, 9, 16, 25]

plt.plot(x, y)

# Save the figure in different formats with a resolution of 300 dpi
plt.savefig("figure_high_resolution.jpg", dpi=300)
plt.savefig("figure_high_resolution.pdf", dpi=300)
plt.savefig("figure_high_resolution.svg", dpi=300)
Output:

Example 9: Saving figure without compression
import matplotlib.pyplot as plt

# Create a simple plot
x = [1, 2, 3, 4, 5]
y = [1, 4, 9, 16, 25]

plt.plot(x, y)

# Save the figure without compression
plt.savefig("figure_no_compression.png", dpi=300, compression=None)
Output:

Example 10: Saving figure with higher resolution using the savefig function parameters
import matplotlib.pyplot as plt

# Create a simple plot
x = [1, 2, 3, 4, 5]
y = [1, 4, 9, 16, 25]

plt.plot(x, y)

# Save the figure with a resolution of 300 dpi using the `savefig` function parameters
plt.savefig("figure_params.png", bbox_inches='tight', pad_inches=0, format='png', dpi=300)
Output:
Matplotlib savefig resolution Conclusion
Adjusting the resolution of saved figures is crucial for controlling the quality and file size of visualizations created using Matplotlib. In this article, we explored different techniques to adjust the resolution while saving figures using the savefig function. By changing the dpi parameter, we can achieve higher or lower resolutions to meet specific requirements. Additionally, we also saw how to adjust the figure size, change file formats, and disable compression during the saving process. These techniques provide flexibility when saving figures and ensure that the visualizations look their best in various use cases.