Importing and Using Matplotlib
Matplotlib is a widely-used Python library for creating static, animated, and interactive visualizations in Python. It provides a wide range of plots and charts for data visualization, ranging from simple line plots to complex 3D scatter plots. In this article, we will delve into the different ways of importing and using Matplotlib in Python.
Importing Matplotlib
To start using Matplotlib in your Python script, you need to import it first. There are several ways to import Matplotlib, depending on your preferences and requirements. Here are a few common ways to import Matplotlib:
Method 1: Import Matplotlib as a whole
You can import the entire Matplotlib library using the import keyword. This will give you access to all the functions and classes provided by Matplotlib.
import matplotlib
Method 2: Import Matplotlib with an alias
You can import Matplotlib with an alias for convenience. This allows you to refer to the Matplotlib library with a shorter name in your code.
import matplotlib.pyplot as plt
Method 3: Import specific modules from Matplotlib
If you only need specific modules or functions from Matplotlib, you can import them directly. This can help reduce the memory footprint of your script.
from matplotlib import pyplot as plt
Basic Plotting with Matplotlib
Now that we have imported Matplotlib, let’s dive into some basic plotting examples using the pyplot module from Matplotlib.
Example 1: Creating a simple line plot
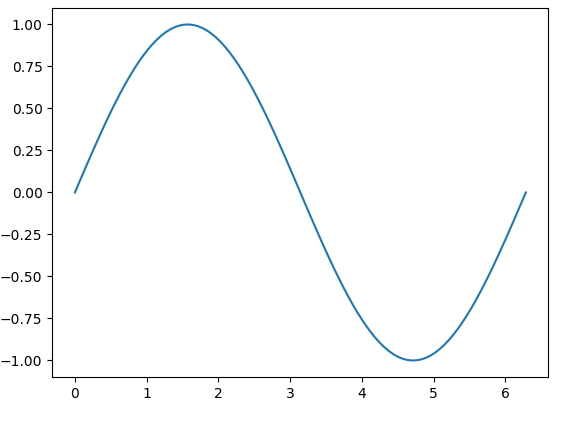
Let’s start by creating a simple line plot using Matplotlib. In this example, we will plot a sine wave.
import matplotlib.pyplot as plt
import numpy as np

x = np.linspace(0, 2*np.pi, 100)
y = np.sin(x)

plt.plot(x, y)
plt.show()
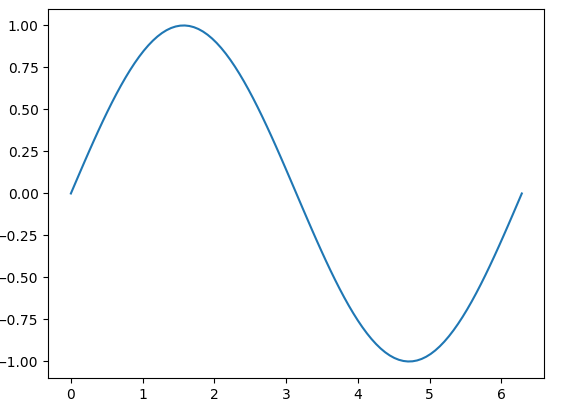
Running the above code will generate a simple line plot of a sine wave. You should see a plot with a smooth curve representing the sine function.
Example 2: Customizing the plot
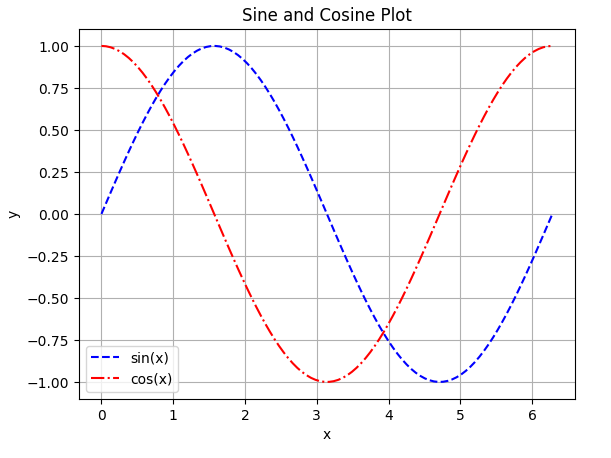
You can customize your plots by adding labels, titles, legends, grid lines, and changing the color and style of the plot lines.
import matplotlib.pyplot as plt
import numpy as np

x = np.linspace(0, 2*np.pi, 100)
y1 = np.sin(x)
y2 = np.cos(x)

plt.plot(x, y1, label='sin(x)', color='blue', linestyle='--')
plt.plot(x, y2, label='cos(x)', color='red', linestyle='-.')
plt.xlabel('x')
plt.ylabel('y')
plt.title('Sine and Cosine Plot')
plt.legend()
plt.grid(True)
plt.show()
Running the above code will generate a plot with both sine and cosine functions, each with a different color and line style.
Example 3: Plotting multiple subplots
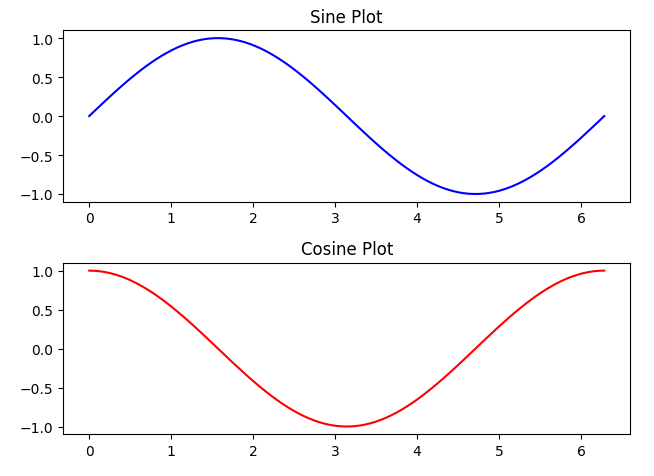
You can create multiple subplots within the same figure using Matplotlib. This is useful when you want to visualize multiple datasets side by side.
import matplotlib.pyplot as plt
import numpy as np

x = np.linspace(0, 2*np.pi, 100)
y1 = np.sin(x)
y2 = np.cos(x)

plt.subplot(211)
plt.plot(x, y1, color='blue')
plt.title('Sine Plot')

plt.subplot(212)
plt.plot(x, y2, color='red')
plt.title('Cosine Plot')

plt.tight_layout()
plt.show()
Running the above code will generate two subplots, one for the sine function and another for the cosine function.
Advanced Plotting with Matplotlib
Matplotlib offers a wide range of advanced plotting capabilities beyond basic line plots. Let’s explore some of these advanced features with examples.
Example 4: Creating a scatter plot
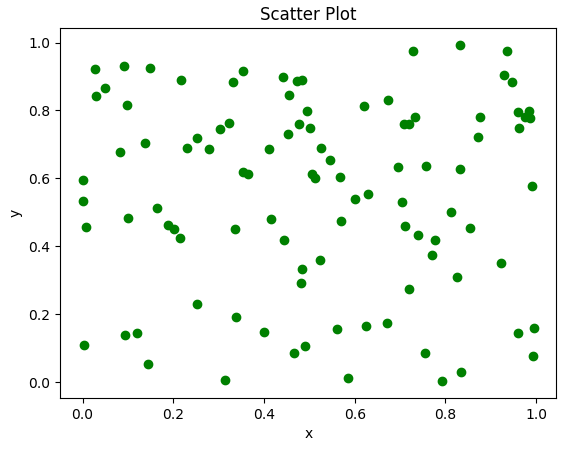
You can create scatter plots to visualize individual data points. Scatter plots are useful for showing the relationship between two variables.
import matplotlib.pyplot as plt
import numpy as np

x = np.random.rand(100)
y = np.random.rand(100)

plt.scatter(x, y, color='green')
plt.xlabel('x')
plt.ylabel('y')
plt.title('Scatter Plot')
plt.show()
Running the above code will generate a scatter plot with randomly generated data points.
Example 5: Creating a bar plot
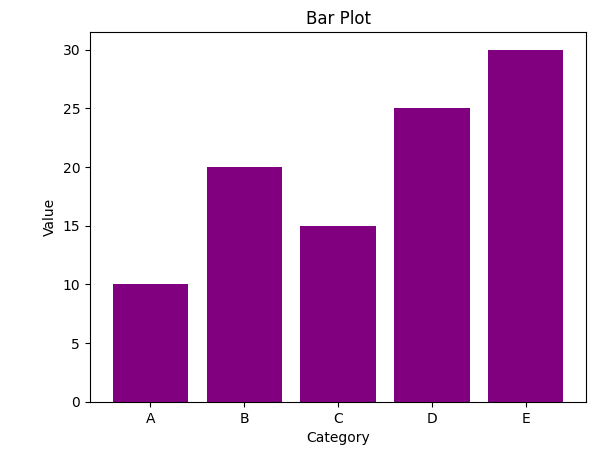
Bar plots are useful for comparing categorical data or showing trends over time. Let’s create a simple bar plot using Matplotlib.
import matplotlib.pyplot as plt
import numpy as np

labels = ['A', 'B', 'C', 'D', 'E']
values = [10, 20, 15, 25, 30]

plt.bar(labels, values, color='purple')
plt.xlabel('Category')
plt.ylabel('Value')
plt.title('Bar Plot')
plt.show()
Running the above code will generate a bar plot with five categories and their corresponding values.
Example 6: Creating a histogram
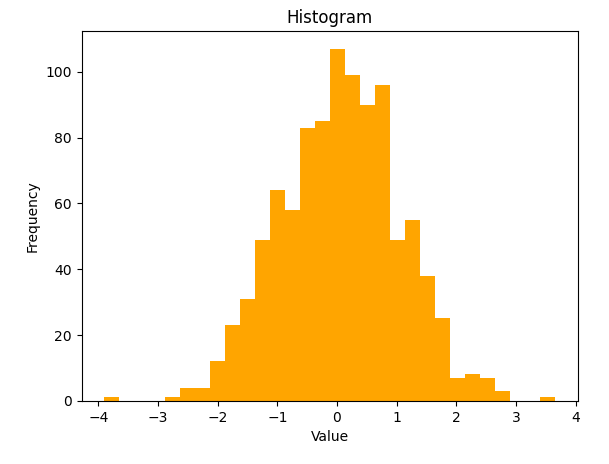
Histograms are useful for visualizing the distribution of continuous data. Let’s create a histogram using random data.
import matplotlib.pyplot as plt
import numpy as np

data = np.random.randn(1000)

plt.hist(data, bins=30, color='orange')
plt.xlabel('Value')
plt.ylabel('Frequency')
plt.title('Histogram')
plt.show()
Running the above code will generate a histogram of randomly generated data.
Example 7: Creating a pie chart
Pie charts are useful for showing the percentage distribution of categories in a dataset. Let’s create a simple pie chart using Matplotlib.
import matplotlib.pyplot as plt

labels = ['A', 'B', 'C', 'D']
sizes = [30, 20, 25, 25]
colors = ['gold', 'blue', 'green', 'red']

plt.pie(sizes, labels=labels, colors=colors, autopct='%1.1f%%', startangle=140)
plt.axis('equal')
plt.title('Pie Chart')
plt.show()
Running the above code will generate a pie chart with four categories and their respective percentages.

Example 8: Creating a 3D plot
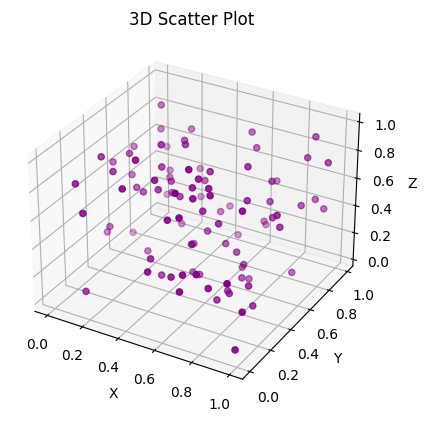
Matplotlib also supports 3D plotting capabilities for visualizing data in three dimensions. Let’s create a simple 3D plot using random data.
import matplotlib.pyplot as plt
import numpy as np
from mpl_toolkits.mplot3d import Axes3D

x = np.random.rand(100)
y = np.random.rand(100)
z = np.random.rand(100)

fig = plt.figure()
ax = fig.add_subplot(111, projection='3d')
ax.scatter(x, y, z, color='purple')
ax.set_xlabel('X')
ax.set_ylabel('Y')
ax.set_zlabel('Z')

plt.title('3D Scatter Plot')
plt.show()
Running the above code will generate a 3D scatter plot using randomly generated data points.
Saving Plots
Matplotlib allows you to save plots in various formats, such as PNG, PDF, SVG, and more. Let’s explore how to save plots using Matplotlib.
Example 9: Saving a plot as PNG
You can save a plot as a PNG image using the savefig function.
import matplotlib.pyplot as plt
import numpy as np

x = np.linspace(0, 2*np.pi, 100)
y = np.sin(x)

plt.plot(x, y)
plt.savefig('sin_plot.png')
Running the above code will save the plot as a PNG image named sin_plot.png in the current directory.
Example 10: Saving a plot as PDF
You can save a plot as a PDF file using the savefig function with the appropriate file extension.
import matplotlib.pyplot as plt
import numpy as np

x = np.linspace(0, 2*np.pi, 100)
y = np.sin(x)

plt.plot(x, y)
plt.savefig('sin_plot.pdf')
Running the above code will save the plot as a PDF file named sin_plot.pdf in the current directory.
Example 11: Saving a plot with custom resolution
You can specify the resolution of the saved plot using the dpi parameter in the savefig function.
import matplotlib.pyplot as plt
import numpy as np

x = np.linspace(0, 2*np.pi, 100)
y = np.sin(x)

plt.plot(x, y)
plt.savefig('sin_plot.png', dpi=300)
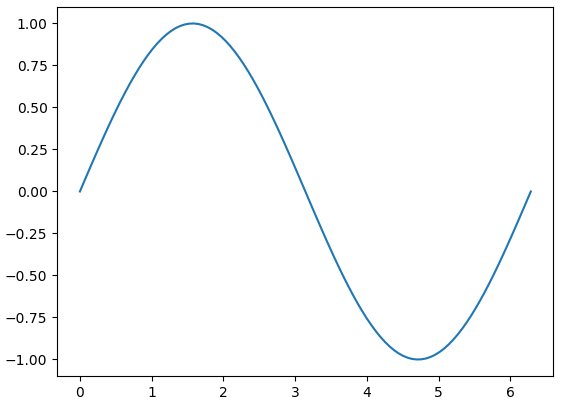
Running the above code will save the plot as aPNG image with a resolution of 300 dots per inch in the current directory.
Example 12: Saving a plot with transparent background
You can save a plot with a transparent background by specifying the transparent=True parameter in the savefig function.
import matplotlib.pyplot as plt
import numpy as np

x = np.linspace(0, 2*np.pi, 100)
y = np.sin(x)

plt.plot(x, y)
plt.savefig('sin_plot.png', transparent=True)
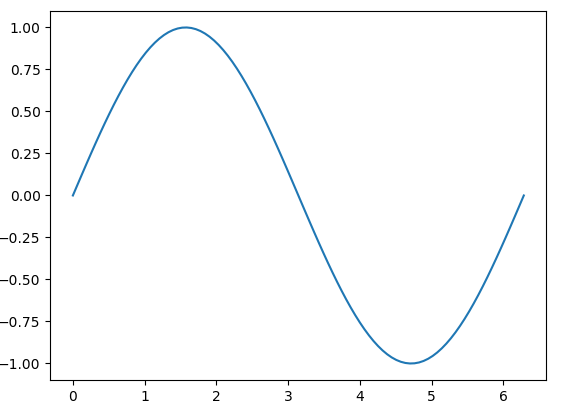
Running the above code will save the plot as a PNG image with a transparent background in the current directory.
Example 13: Saving a plot with a tight bounding box
You can save a plot with a tight bounding box around the plot area by using the bbox_inches='tight' parameter in the savefig function.
import matplotlib.pyplot as plt
import numpy as np

x = np.linspace(0, 2*np.pi, 100)
y = np.sin(x)

plt.plot(x, y)
plt.savefig('sin_plot.png', bbox_inches='tight')
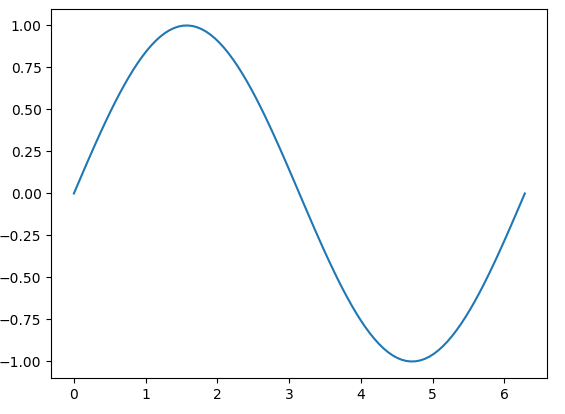
Running the above code will save the plot as a PNG image with a tight bounding box in the current directory.
Example 14: Saving a plot with a custom size
You can save a plot with a custom size by specifying the figsize parameter when creating the figure.
import matplotlib.pyplot as plt
import numpy as np

x = np.linspace(0, 2*np.pi, 100)
y = np.sin(x)

plt.figure(figsize=(8, 6))
plt.plot(x, y)
plt.savefig('sin_plot.png')
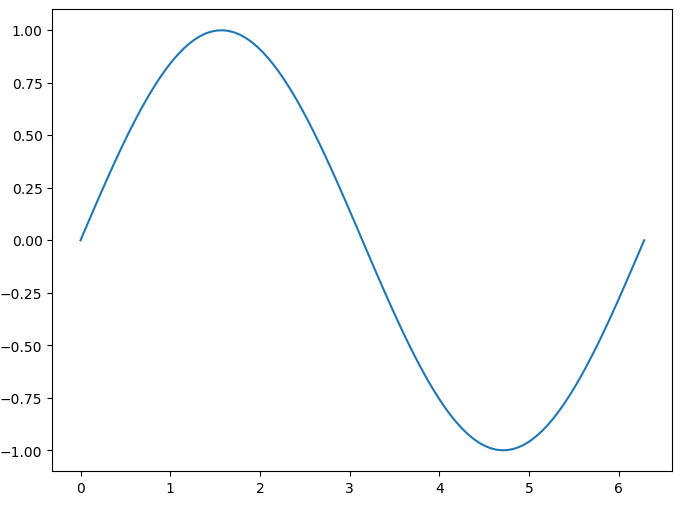
Running the above code will save the plot as a PNG image with a custom size of 8 inches by 6 inches in the current directory.
Conclusion
In this article, we have covered the basics of importing and using Matplotlib for data visualization in Python. We explored various types of plots and customization options offered by Matplotlib, as well as advanced plotting features such as 3D plots. We also learned how to save plots in different formats and customize the saving options. Matplotlib is a powerful library for creating visually appealing and informative plots, and mastering it can greatly enhance your data analysis and visualization skills. Experiment with the provided examples and explore the extensive documentation and examples available on the Matplotlib website to unlock the full potential of this versatile library.