Matplotlib Label Size
Matplotlib is a powerful data visualization library in Python that allows users to create informative and visually appealing plots. One of the key elements in a plot is labels, which provide information about the data being visualized. In this article, we will explore how to work with label sizes in Matplotlib.
What are label sizes in Matplotlib?
In Matplotlib, label sizes refer to the font size of the text used for different labels in a plot. The labels can include axis labels, title, legends, or any other text annotation added to the plot. Controlling the size of these labels is essential to ensure readability and aesthetics in the visualizations.
Controlling label sizes in Matplotlib
Matplotlib provides several ways to control the size of labels. We can set a global default size for all labels in a plot or individually customize the size of each label. Let’s explore these options with examples.
1. Setting a global label size in Matplotlib
To set a global label size for all labels in a plot, we can use the rcParams configuration. Here’s an example:
import matplotlib.pyplot as plt

# Set global label size
plt.rcParams['axes.labelsize'] = 14

# Create a simple plot
x = [1, 2, 3, 4, 5]
y = [1, 4, 9, 16, 25]
plt.plot(x, y)
plt.xlabel('X-axis label')
plt.ylabel('Y-axis label')
plt.title('Global Label Size Example')

# Show the plot
plt.show()
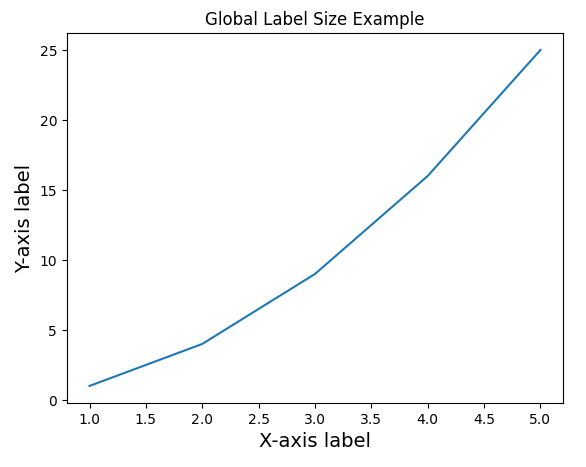
The above code sets the axes.labelsize parameter in rcParams to 14. This will make the xlabel, ylabel, and any other labels in the plot have a font size of 14.
2. Customizing individual label sizes in Matplotlib
Sometimes, we may need to customize the size of individual labels differently. We can achieve this by explicitly specifying the font size for each label. Let’s consider the following example:
import matplotlib.pyplot as plt

# Create a simple plot
x = [1, 2, 3, 4, 5]
y = [1, 4, 9, 16, 25]
plt.plot(x, y)
plt.xlabel('X-axis label', fontsize=12)
plt.ylabel('Y-axis label', fontsize=16)
plt.title('Individual Label Size Example')

# Show the plot
plt.show()
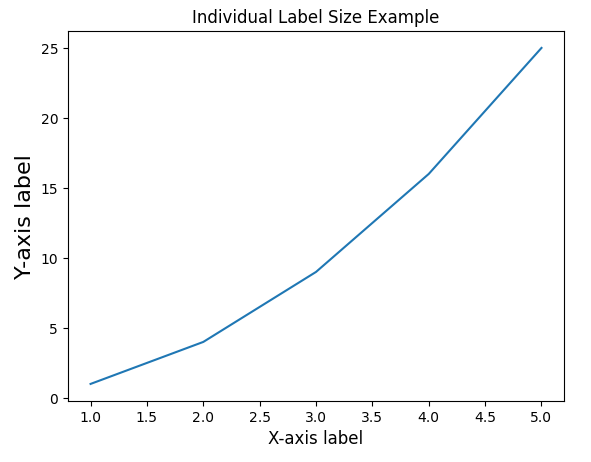
In the above code, we use the fontsize parameter to set the font size for the x-axis and y-axis labels individually. Here, the x-axis label has a font size of 12, while the y-axis label has a font size of 16.
3. Changing tick label sizes in Matplotlib
Apart from the axis labels, we may also want to adjust the size of tick labels, which are the numeric or categorical values on the axes. Matplotlib allows us to customize the tick label sizes as well. Here’s an example:
import matplotlib.pyplot as plt

# Create a simple plot
x = [1, 2, 3, 4, 5]
y = [1, 4, 9, 16, 25]
plt.plot(x, y)
plt.xlabel('X-axis label')
plt.ylabel('Y-axis label')
plt.title('Tick Label Size Example')

# Customize tick label size
plt.xticks(fontsize=10)
plt.yticks(fontsize=14)

# Show the plot
plt.show()
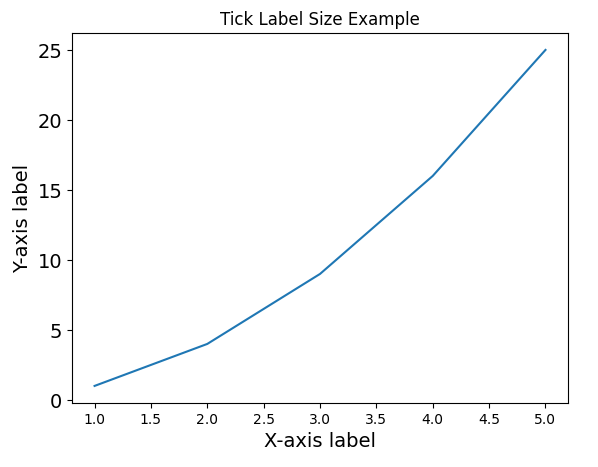
In the code above, we use xticks and yticks methods to specify the font size for tick labels on the x-axis and y-axis, respectively. The x-axis tick labels have a font size of 10, while the y-axis tick labels have a font size of 14.
4. Adjusting legend label size in Matplotlib
Legends provide additional information about the plot elements. We can control the size of legend labels using the fontsize parameter of the legend function. Let’s see an example:
import matplotlib.pyplot as plt

# Create a simple plot
x = [1, 2, 3, 4, 5]
y = [1, 4, 9, 16, 25]
plt.plot(x, y, label='Data')
plt.xlabel('X-axis label')
plt.ylabel('Y-axis label')
plt.title('Legend Label Size Example')

# Show the legend with a custom label size
plt.legend(fontsize=12)

# Show the plot
plt.show()
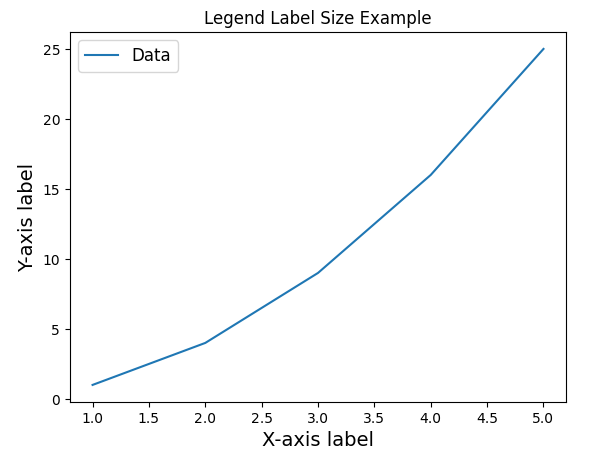
In the code above, we use the fontsize parameter of the legend function to set the font size of the legend label to 12.
5. Setting the title size in Matplotlib
The title of a plot is an essential component for providing context. We can control the size of the title using the fontsize parameter of the title function. Here’s an example:
import matplotlib.pyplot as plt

# Create a simple plot
x = [1, 2, 3, 4, 5]
y = [1, 4, 9, 16, 25]
plt.plot(x, y)
plt.xlabel('X-axis label')
plt.ylabel('Y-axis label')
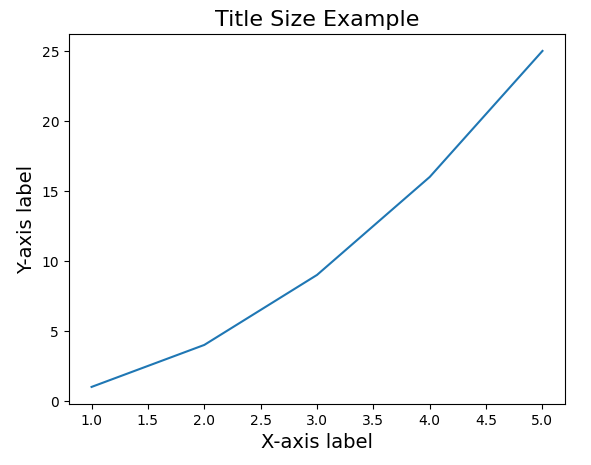
plt.title('Title Size Example', fontsize=16)

# Show the plot
plt.show()
In the code above, we set the font size of the title to 16 using the fontsize parameter.
6. Changing the font family
Apart from size, we can also adjust the font family used for label text. Matplotlib allows us to change the font family using the fontfamily parameter. Here’s an example:
import matplotlib.pyplot as plt

# Create a simple plot
x = [1, 2, 3, 4, 5]
y = [1, 4, 9, 16, 25]
plt.plot(x, y)
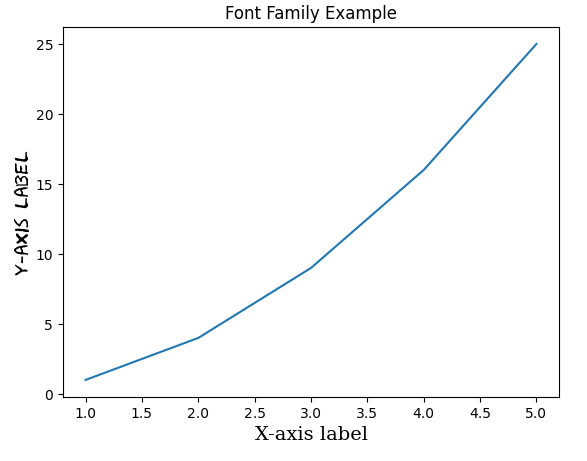
plt.xlabel('X-axis label', fontfamily='serif')
plt.ylabel('Y-axis label', fontfamily='fantasy')
plt.title('Font Family Example', fontfamily='cursive')

# Show the plot
plt.show()
In the above code, we specify different font families for the x-axis label, y-axis label, and the title using the fontfamily parameter. The x-axis label uses the serif font family, the y-axis label uses the fantasy font family, while the title uses the cursive font family.
7. Controlling label sizes in subplots
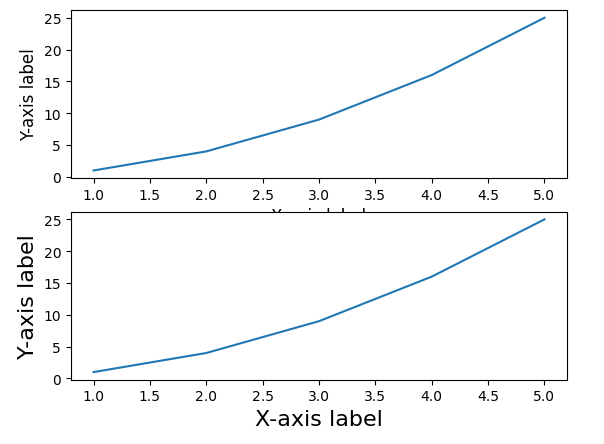
When working with multiple subplots, it is essential to control the label sizes individually for each subplot. We can achieve this by accessing the specific axes of each subplot and modifying the label sizes accordingly. Here’s an example:
import matplotlib.pyplot as plt

# Create two subplots
fig, axs = plt.subplots(2)

# Plot data in the first subplot
axs[0].plot([1, 2, 3, 4, 5], [1, 4, 9, 16, 25])
axs[0].set_xlabel('X-axis label', fontsize=12)
axs[0].set_ylabel('Y-axis label', fontsize=12)

# Plot data in the second subplot
axs[1].plot([1, 2, 3, 4, 5], [1, 4, 9, 16, 25])
axs[1].set_xlabel('X-axis label', fontsize=16)
axs[1].set_ylabel('Y-axis label', fontsize=16)

# Show the subplots
plt.show()
In the above code, we use indexing to access each specific subplot using the axs object. Then, we set the label sizes individually for each subplot with the set_xlabel and set_ylabel methods.
8. Using LaTeX for label sizes in Matplotlib
Matplotlib also supports LaTeX annotations, which allow us to render mathematical expressions. We can use LaTeX for label sizes as well by enabling the LaTeX renderer. Here’s an example:
import matplotlib.pyplot as plt

# Enable LaTeX rendering
plt.rcParams['text.usetex'] = True

# Create a simple plot
x = [1, 2, 3, 4, 5]
y = [1, 4, 9, 16, 25]
plt.plot(x, y)
plt.xlabel(r'\textbf{X-axis label}')
plt.ylabel(r'\textbf{Y-axis label}')
plt.title(r'\textbf{LaTeX Label Size Example}')

# Show the plot
plt.show()
In the above code, we set the text.usetex parameter in rcParams to True to enable LaTeX rendering. Then, we use LaTeX syntax within the xlabel, ylabel, and title functions to specify the label sizes. The labels are rendered in bold using the \textbf command.
9. Changing default font size for all text
In addition to label sizes, we may need to modify the default font size for all text elements in the plot. We can achieve this by setting a global default font size using the rcParams configuration. Here’s an example:
import matplotlib.pyplot as plt

# Set global default font size
plt.rcParams['font.size'] = 12

# Create a simple plot
x = [1, 2, 3, 4, 5]
y = [1, 4, 9, 16, 25]
plt.plot(x, y)
plt.xlabel('X-axis label')
plt.ylabel('Y-axis label')
plt.title('Default Font Size Example')

# Show the plot
plt.show()
In the code above, we set the font.size parameter in rcParams to 12. This will change the default font size for all text elements in the plot, including labels.
10. Combining label size and font size customization
Lastly, it is important to note that both label size and font size can be customized simultaneously to fine-tune the appearance of a plot. Here’s an example:
import matplotlib.pyplot as plt

# Set global label size and default font size
plt.rcParams['axes.labelsize'] = 14
plt.rcParams['font.size'] = 12

# Create a simple plot
x = [1, 2, 3, 4, 5]
y = [1, 4, 9, 16, 25]
plt.plot(x, y)
plt.xlabel('X-axis label', fontsize=12)
plt.ylabel('Y-axis label', fontsize=16)
plt.title('Combined Example')

# Customize tick label size
plt.xticks(fontsize=10)
plt.yticks(fontsize=14)

# Show the plot
plt.show()
In the above code, we first set a global label size of 14 using axes.labelsize in rcParams. Then, we also set a default font size of 12 using font.size in rcParams. Next, we customize the font sizes for the x-axis and y-axis labels individually. Finally, we adjust the tick label sizes for the x-axis and y-axis. This way, we combine label size and font size customization to create a visually appealing plot.
Conclusion of Matplotlib Label Size
In this article, we explored how to work with label sizes in Matplotlib. We learned how to set a global default size for all labels, customize individual label sizes, change tick label sizes, and adjust legend label sizes. Additionally, we discovered how to control the size of the title and change the font family for label text. We also explored advanced features like using LaTeX for label sizes and modifying the default font size for all text elements. By mastering label size customization, you can enhance the readability and aesthetics of your Matplotlib plots.