Matplotlib Label Rotation
Matplotlib is a powerful data visualization library in Python that provides a wide range of functionalities to create interactive plots and charts. One of the many customization options offered by Matplotlib is the ability to rotate labels. This feature can be particularly useful when dealing with long or overlapping category labels on the x or y axes.
In this article, we will explore various methods to rotate labels in Matplotlib. We will discuss the different approaches based on the type of plot and examine code examples to demonstrate their usage. So let’s dive in!
Methods to Rotate Labels in Matplotlib
Matplotlib offers three primary methods to rotate labels:
- Rotating x-axis labels
- Rotating y-axis labels
- Rotating tick labels
Let’s explore each of these methods in detail with code examples.
1. Rotating x-axis Labels
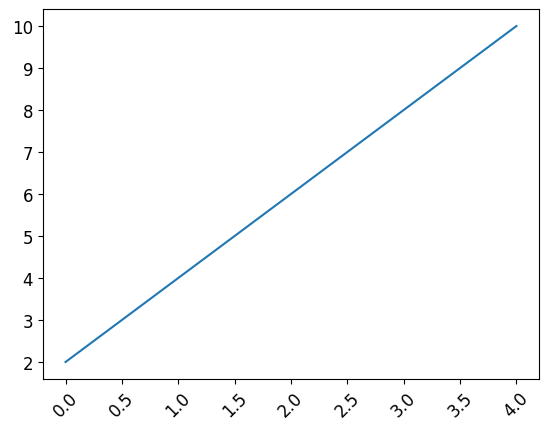
To rotate the x-axis labels in a Matplotlib plot, we can use the xticks function with the rotation parameter. This parameter takes degrees as an input to specify the rotation angle.
import matplotlib.pyplot as plt
import numpy as np

# Creating a sample plot
x = np.arange(5)
y = [2, 4, 6, 8, 10]

plt.plot(x, y)

# Rotating x-axis labels by 45 degrees
plt.xticks(rotation=45)

plt.show()
Code Execution Result:
2. Rotating y-axis Labels
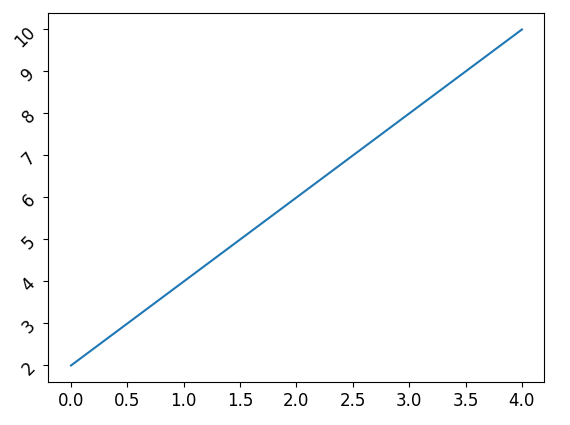
Similarly, we can rotate the y-axis labels in a Matplotlib plot using the yticks function with the rotation parameter. Let’s take a look at an example:
import matplotlib.pyplot as plt
import numpy as np

# Creating a sample plot
x = np.arange(5)
y = [2, 4, 6, 8, 10]

plt.plot(x, y)

# Rotating y-axis labels by 45 degrees
plt.yticks(rotation=45)

plt.show()
Code Execution Result:
3. Rotating Tick Labels
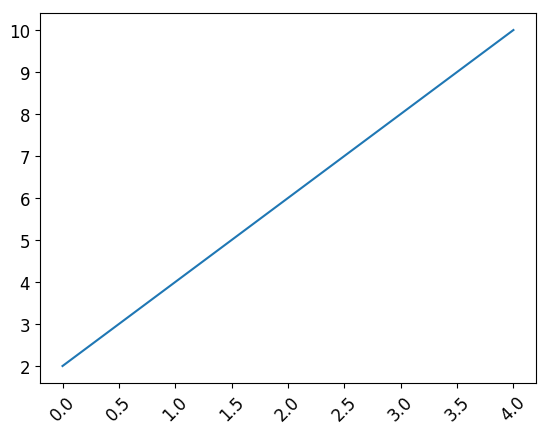
Sometimes, we might want to rotate only the tick labels on either the x or y axis instead of all the axis labels. This can be achieved by using the tick_params function with the rotation parameter.
import matplotlib.pyplot as plt
import numpy as np

# Creating a sample plot
x = np.arange(5)
y = [2, 4, 6, 8, 10]

plt.plot(x, y)

# Rotating x-axis tick labels by 45 degrees
plt.tick_params(axis='x', rotation=45)

plt.show()
Code Execution Result:
Additional Customization Options in Matplotlib Label Rotation
In addition to rotating labels, Matplotlib offers several customization options to enhance the appearance of plots. Let’s discuss a few important ones:
1. Changing Font Size
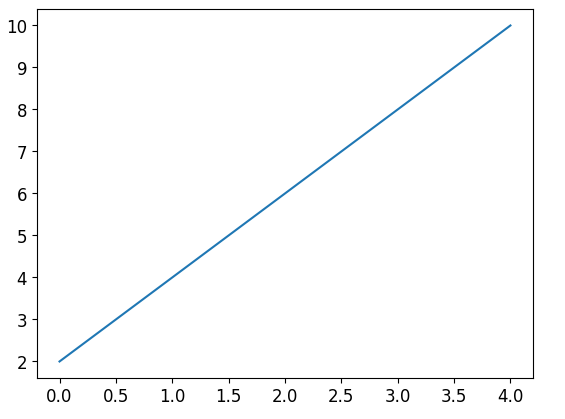
To change the font size of labels in Matplotlib, we can use the fontsize parameter. Here’s an example:
import matplotlib.pyplot as plt
import numpy as np

# Creating a sample plot
x = np.arange(5)
y = [2, 4, 6, 8, 10]

plt.plot(x, y)

# Increasing font size
plt.xticks(fontsize=12)

plt.show()
Code Execution Result:
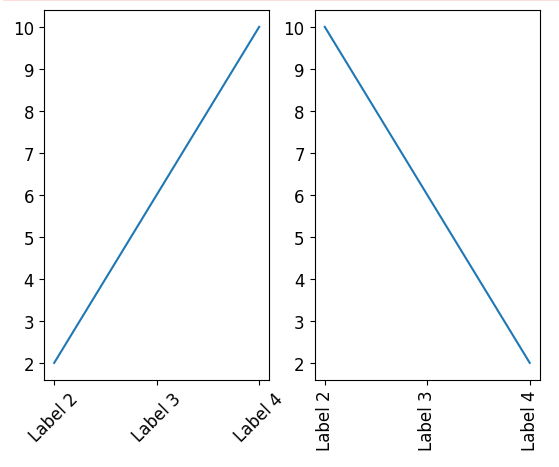
2. Adding Label Rotation in Subplots
When working with subplots, we can rotate labels individually for each subplot using the set_xticklabels and set_yticklabels methods. Here’s an example:
import matplotlib.pyplot as plt
import numpy as np

# Creating two subplots
fig, axes = plt.subplots(nrows=1, ncols=2)

# Plot 1
x1 = np.arange(5)
y1 = [2, 4, 6, 8, 10]
axes[0].plot(x1, y1)
axes[0].set_xticklabels(['Label 1', 'Label 2', 'Label 3', 'Label 4', 'Label 5'], rotation=45)

# Plot 2
x2 = np.arange(5)
y2 = [10, 8, 6, 4, 2]
axes[1].plot(x2, y2)
axes[1].set_xticklabels(['Label 1', 'Label 2', 'Label 3', 'Label 4', 'Label 5'], rotation=90)

plt.show()
Code Execution Result:
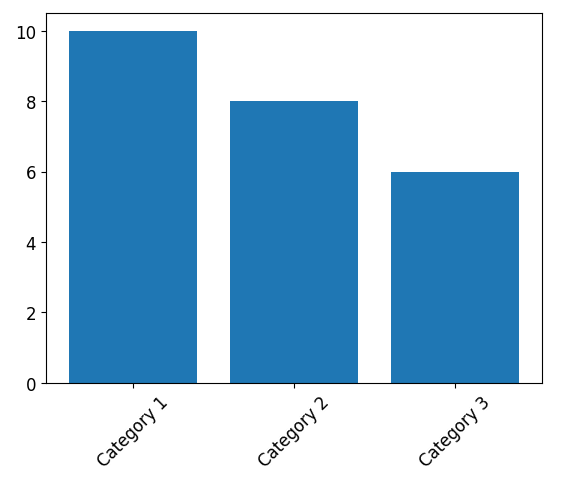
3. Rotating Labels in Bar Plots
To rotate labels in bar plots, we can use the rotation parameter of the bar function. Here’s an example:
import matplotlib.pyplot as plt

# Creating a sample bar plot
labels = ['Category 1', 'Category 2', 'Category 3']
values = [10, 8, 6]

plt.bar(labels, values)

# Rotating labels by 45 degrees
plt.xticks(rotation=45)

plt.show()
Code Execution Result:
Matplotlib Label Rotation Conclusion
In this article, we explored various methods to rotate labels in Matplotlib. We learned how to rotate x-axis labels, y-axis labels, and tick labels. Additionally, we discussed some additional customization options such as changing font size, rotating labels in subplots, and rotating labels in bar plots.
Matplotlib provides a flexible and easy-to-use interface to create stunning visualizations. By leveraging the label rotation feature, we can improve the readability and aesthetics of our plots. Experimenting with different rotation angles and customizations will allow you to create visually appealing plots that effectively convey information.