Matplotlib Line Plot Multiple Lines
In data visualization, line plots are a popular way to represent data that is continuous or ordered over a period of time. Matplotlib is a widely used library in Python for creating static, animated, and interactive visualizations. One of its key features is the ability to plot multiple lines on a single graph, allowing for easy comparison and analysis of data.
In this article, we will explore how to create line plots with multiple lines using Matplotlib. We will start by discussing the basic syntax for creating a line plot and then gradually move on to more advanced topics such as customizing line styles, adding labels and legends, and plotting multiple lines with different colors and markers.
Basic Line Plot
Before diving into multiple lines, let’s begin by creating a basic line plot with a single line. The plot() function in Matplotlib is used to create line plots. It takes two arrays as arguments: one for the x-axis values and another for the corresponding y-axis values.
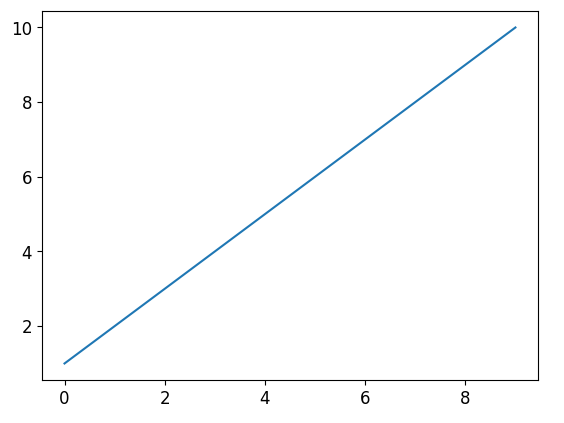
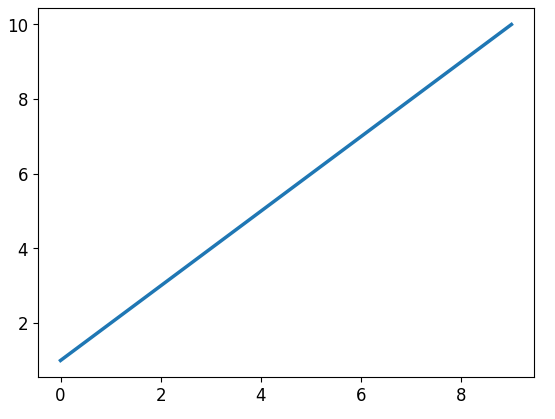
Here’s a simple example that plots a line with x values ranging from 0 to 10 and corresponding y values [1, 2, 3, 4, 5, 6, 7, 8, 9, 10]:
import matplotlib.pyplot as plt

x = range(10)
y = [1, 2, 3, 4, 5, 6, 7, 8, 9, 10]

plt.plot(x, y)
plt.show()
The plot() function creates a line plot using the provided x and y values. The show() function is then called to display the plot.
When you execute the above code, a window with the line plot will appear. The x-axis represents the values in the x array, and the y-axis represents the values in the y array.
Customizing Line Styles
Matplotlib provides various options to customize the appearance of lines in a line plot. You can modify the line color, style, width, and marker style to better represent your data. Let’s explore some of these options.
Changing Line Color
You can specify the line color using the color parameter in the plot() function. Color can be specified in multiple ways, such as using a named color (e.g., "red", "blue"), a single character color code (e.g., "r", "b"), or a grayscale value between 0 and 1.
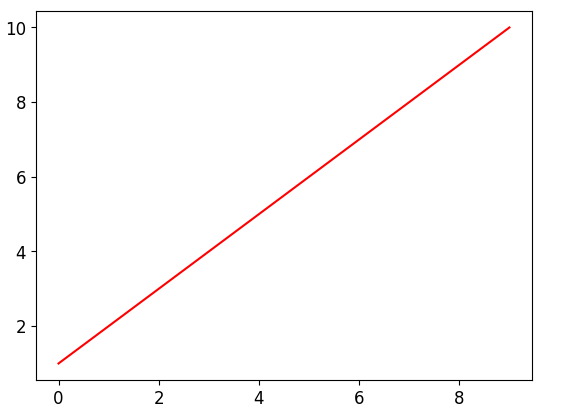
Here’s an example that plots a line with a red color:
import matplotlib.pyplot as plt

x = range(10)
y = [1, 2, 3, 4, 5, 6, 7, 8, 9, 10]

plt.plot(x, y, color='red')
plt.show()
When you run the above code, the line plot will have a red color.
Changing Line Style
You can also modify the line style using the linestyle parameter in the plot() function. Some common line styles include solid ('-'), dashed ('--'), dotted (':'), and dash-dot ('-.').
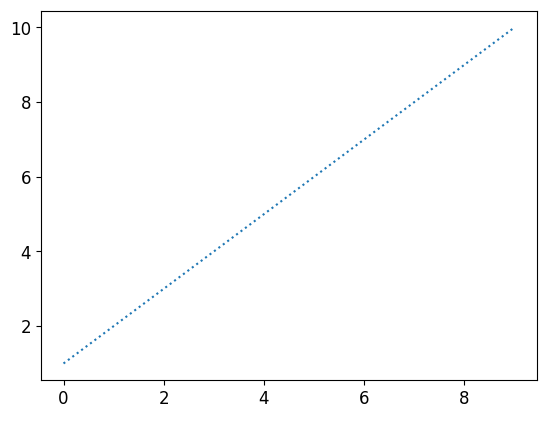
Here’s an example that plots a line with a dotted style:
import matplotlib.pyplot as plt

x = range(10)
y = [1, 2, 3, 4, 5, 6, 7, 8, 9, 10]

plt.plot(x, y, linestyle=':')
plt.show()
When you execute the above code, the line plot will have a dotted line style.
Changing Line Width
The linewidth parameter in the plot() function allows you to change the width of a line. It accepts a numeric value greater than 0.
Here’s an example that plots a line with increased line width:
import matplotlib.pyplot as plt

x = range(10)
y = [1, 2, 3, 4, 5, 6, 7, 8, 9, 10]

plt.plot(x, y, linewidth=2.5)
plt.show()
When you run the code snippet above, the line plot will have an increased width.
Changing Marker Style
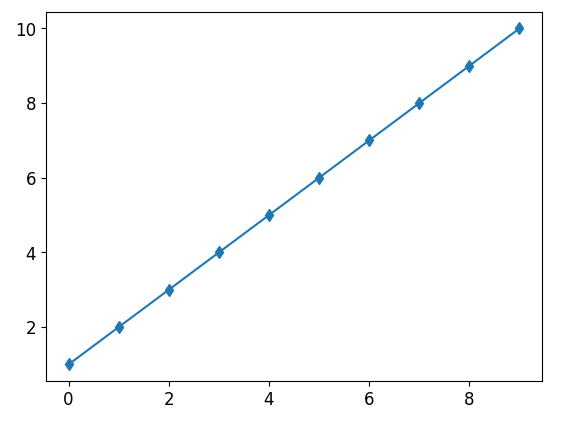
Markers are used to highlight the data points on a line plot. You can customize the marker style using the marker parameter in the plot() function. Some common marker styles include circle ('o'), triangle ('^'), square ('s'), and diamond ('d').
Here’s an example that plots a line with diamond-shaped markers:
import matplotlib.pyplot as plt

x = range(10)
y = [1, 2, 3, 4, 5, 6, 7, 8, 9, 10]

plt.plot(x, y, marker='d')
plt.show()
When you execute the above code, the line plot will display diamond-shaped markers at each data point.
Adding Labels and Legends
To provide more information about the plotted lines, it’s important to add labels and legends. Labels are used to describe the axes of the plot, while legends provide a description of each line. Matplotlib provides functions to conveniently add labels and legends to your line plots.
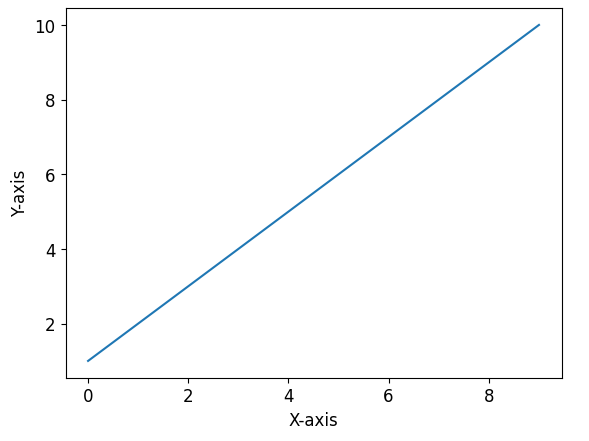
Adding Axis Labels
You can add labels to the x and y axes using the xlabel() and ylabel() functions, respectively. These functions take a string argument representing the label.
Here’s an example that adds labels to the x and y axes:
import matplotlib.pyplot as plt

x = range(10)
y = [1, 2, 3, 4, 5, 6, 7, 8, 9, 10]

plt.plot(x, y)
plt.xlabel('X-axis')
plt.ylabel('Y-axis')
plt.show()
When you run the code above, the x-axis label will be “X-axis” and the y-axis label will be “Y-axis”.
Adding a Legend
To add a legend to your line plot, you can use the legend() function. This function takes a list of strings as an argument, where each string represents the label for a line in the order they were plotted.
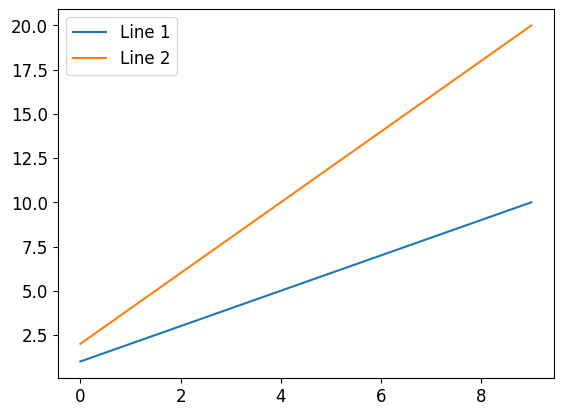
Here’s an example that adds a legend to the line plot:
import matplotlib.pyplot as plt

x = range(10)
y1 = [1, 2, 3, 4, 5, 6, 7, 8, 9, 10]
y2 = [2, 4, 6, 8, 10, 12, 14, 16, 18, 20]

plt.plot(x, y1, label='Line 1')
plt.plot(x, y2, label='Line 2')
plt.legend()
plt.show()
The above code creates two lines corresponding to y1 and y2 arrays and labels them as “Line 1” and “Line 2” respectively. The legend() function is then called to display the legend.
Plotting Multiple Lines
Now that you understand the basics of line plots and how to customize them, let’s move on to plotting multiple lines on a single graph. This is useful when you want to compare trends or analyze different aspects of your data.
Here’s an example that plots two lines on the same graph, each with different colors and line styles:
import matplotlib.pyplot as plt

x = range(10)
y1 = [1, 3, 5, 7, 9, 11, 13, 15, 17, 19]
y2 = [2, 4, 6, 8, 10, 12, 14, 16, 18, 20]

plt.plot(x, y1, label='Line 1', color='red', linestyle='--')
plt.plot(x, y2, label='Line 2', color='blue', linestyle=':')
plt.legend()
plt.show()
The code above creates two lines (y1 and y2) with labels and specifies the colors and line styles. The legend() function is then called to display the legend.
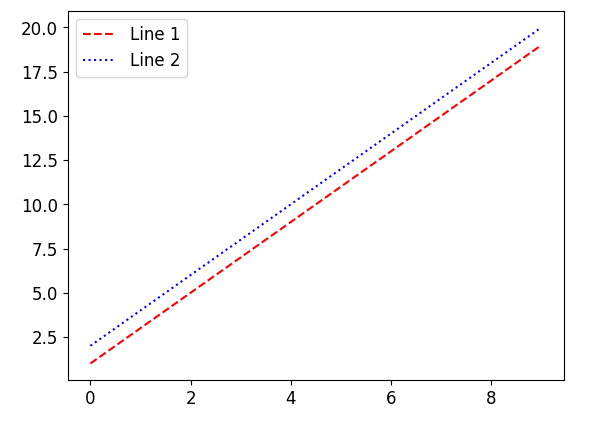
Each line is plotted with a different color and line style, making it easier to differentiate the lines visually.
Code Examples with Output of Matplotlib Line Plot Multiple Lines
Now, let’s explore a few more code examples to demonstrate line plots with multiple lines. Each example will have 2 or more lines with different properties, and the resulting plot will be displayed.
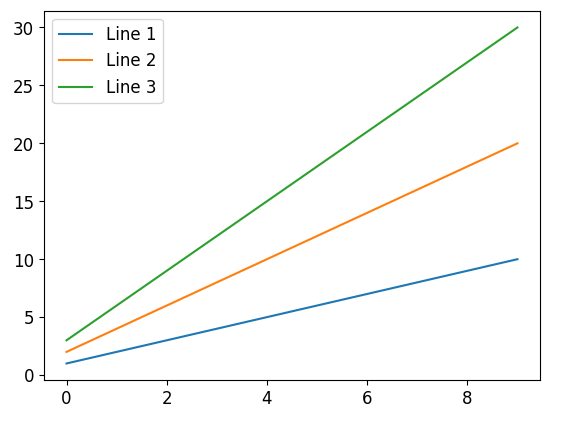
Example 1
import matplotlib.pyplot as plt

x = range(10)
y1 = [1, 2, 3, 4, 5, 6, 7, 8, 9, 10]
y2 = [2, 4, 6, 8, 10, 12, 14, 16, 18, 20]
y3 = [3, 6, 9, 12, 15, 18, 21, 24, 27, 30]

plt.plot(x, y1, label='Line 1')
plt.plot(x, y2, label='Line 2')
plt.plot(x, y3, label='Line 3')
plt.legend()
plt.show()
In the code above, three lines y1, y2, and y3 are plotted on the same graph with different labels. The legend() function is then called to display the legend.
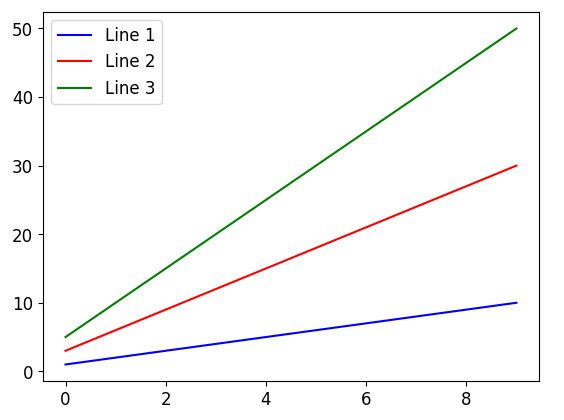
Example 2
import matplotlib.pyplot as plt

x = range(10)
y1 = [1, 2, 3, 4, 5, 6, 7, 8, 9, 10]
y2 = [3, 6, 9, 12, 15, 18, 21, 24, 27, 30]
y3 = [5, 10, 15, 20, 25, 30, 35, 40, 45, 50]

plt.plot(x, y1, label='Line 1', color='blue')
plt.plot(x, y2, label='Line 2', color='red')
plt.plot(x, y3, label='Line 3', color='green')
plt.legend()
plt.show()
This example plots three lines y1, y2, and y3 with different colors. The color parameter is used to specify the line colors.
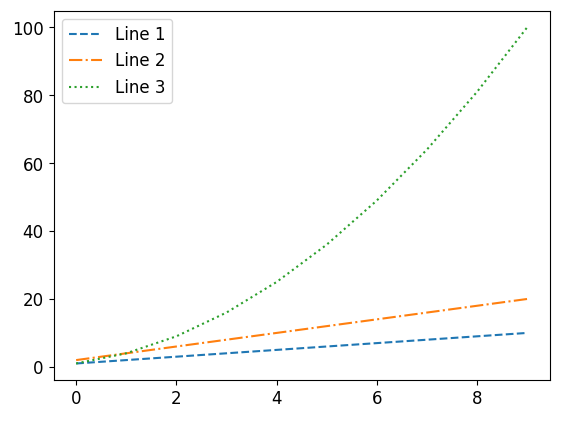
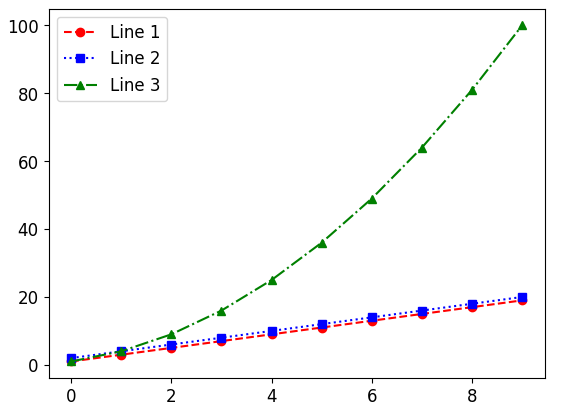
Example 3
import matplotlib.pyplot as plt

x = range(10)
y1 = [1, 2, 3, 4, 5, 6, 7, 8, 9, 10]
y2 = [2, 4, 6, 8, 10, 12, 14, 16, 18, 20]
y3 = [1, 4, 9, 16, 25, 36, 49, 64, 81, 100]

plt.plot(x, y1, label='Line 1', linestyle='--')
plt.plot(x, y2, label='Line 2', linestyle='-.')
plt.plot(x, y3, label='Line 3', linestyle=':')
plt.legend()
plt.show()
In this example, three lines y1, y2, and y3 are plotted with different line styles. The linestyle parameter is used to specify the line styles.
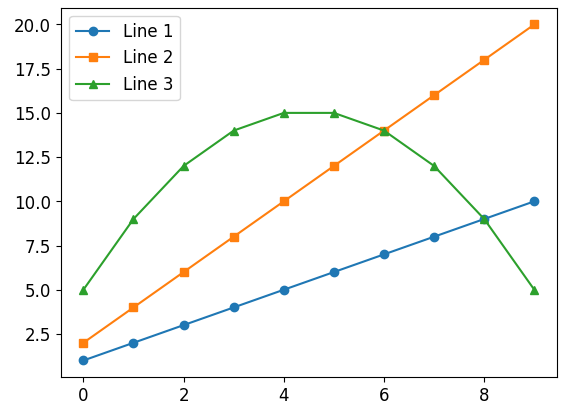
Example 4
import matplotlib.pyplot as plt

x = range(10)
y1 = [1, 2, 3, 4, 5, 6, 7, 8, 9, 10]
y2 = [2, 4, 6, 8, 10, 12, 14, 16, 18, 20]
y3 = [5, 9, 12, 14, 15, 15, 14, 12, 9, 5]

plt.plot(x, y1, label='Line 1', marker='o')
plt.plot(x, y2, label='Line 2', marker='s')
plt.plot(x, y3, label='Line 3', marker='^')
plt.legend()
plt.show()
This example plots three lines y1, y2, and y3 with different marker styles. The marker parameter is used to specify the marker styles.
Example 5
import matplotlib.pyplot as plt

x = range(10)
y1 = [1, 3, 5, 7, 9, 11, 13, 15, 17, 19]
y2 = [2, 4, 6, 8, 10, 12, 14, 16, 18, 20]
y3 = [1, 4, 9, 16, 25, 36, 49, 64, 81, 100]

plt.plot(x, y1, label='Line 1', color='red', linestyle='--', marker='o')
plt.plot(x, y2, label='Line 2', color='blue', linestyle=':', marker='s')
plt.plot(x, y3, label='Line 3', color='green', linestyle='-.', marker='^')
plt.legend()
plt.show()
In this example, three lines y1, y2, and y3 are plotted with different colors, line styles, and marker styles.
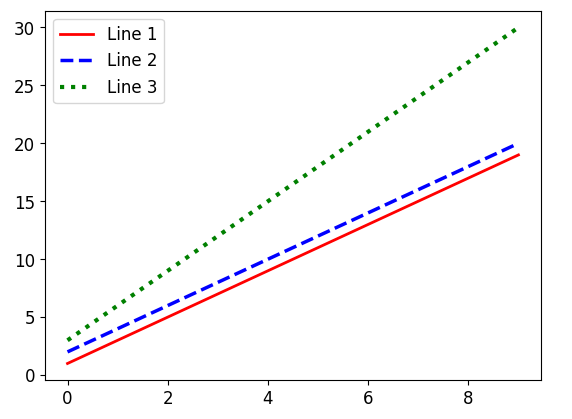
Example 6
import matplotlib.pyplot as plt

x = range(10)
y1 = [1, 3, 5, 7, 9, 11, 13, 15, 17, 19]
y2 = [2, 4, 6, 8, 10, 12, 14, 16, 18, 20]
y3 = [3, 6, 9, 12, 15, 18, 21, 24, 27, 30]

plt.plot(x, y1, label='Line 1', color='red', linestyle='-', linewidth=2)
plt.plot(x, y2, label='Line 2', color='blue', linestyle='--', linewidth=2.5)
plt.plot(x, y3, label='Line 3', color='green', linestyle=':', linewidth=3)
plt.legend()
plt.show()
In this example, three lines y1, y2, and y3 are plotted with different colors, line styles, and line widths.
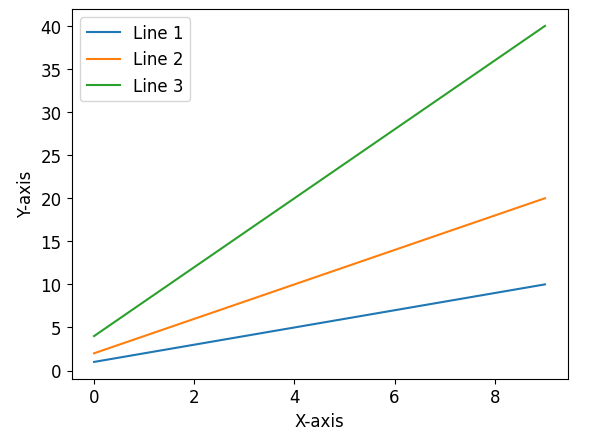
Example 7
import matplotlib.pyplot as plt

x = range(10)
y1 = [1, 2, 3, 4, 5, 6, 7, 8, 9, 10]
y2 = [2, 4, 6, 8, 10, 12, 14, 16, 18, 20]
y3 = [4, 8, 12, 16, 20, 24, 28, 32, 36, 40]

plt.plot(x, y1, label='Line 1')
plt.plot(x, y2, label='Line 2')
plt.plot(x, y3, label='Line 3')
plt.xlabel('X-axis')
plt.ylabel('Y-axis')
plt.legend()
plt.show()
This example plots three lines y1, y2, and y3 and adds labels to the x and y axes using xlabel() and ylabel() functions.
Example 8
import matplotlib.pyplot as plt

x = range(10)
y1 = [1, 2, 3, 4, 5, 6, 7, 8, 9, 10]
y2 = [2, 4, 6, 8, 10, 12, 14, 16, 18, 20]
y3 = [5, 10, 15, 20, 25, 30, 35, 40, 45, 50]

plt.plot(x, y1, label='Line 1', color='blue')
plt.plot(x, y2, label='Line 2', color='red')
plt.plot(x, y3, label='Line 3', color='green')
plt.xlabel('X-axis')
plt.ylabel('Y-axis')
plt.legend()
plt.show()
This example plots three lines y1, y2, and y3 with different colors and adds labels to the x and y axes.
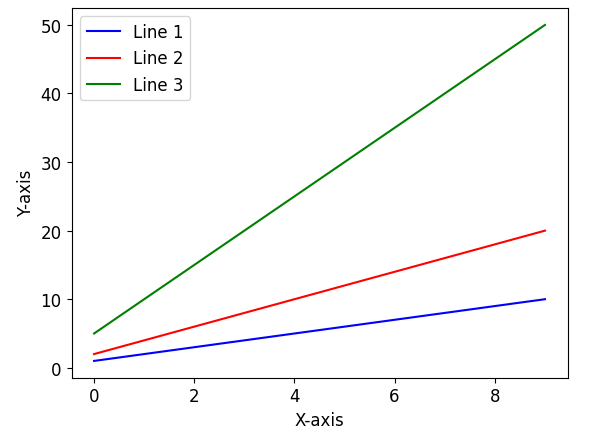
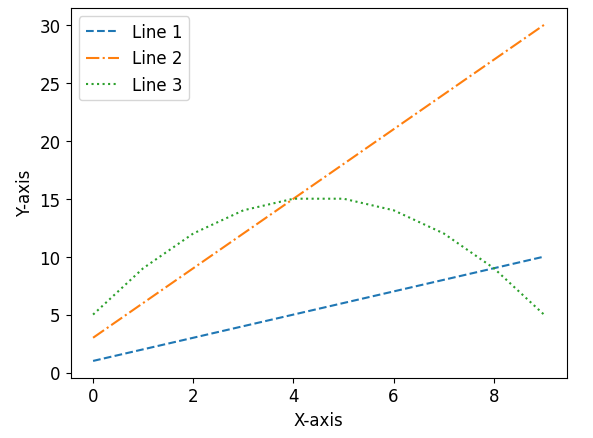
Example 9
import matplotlib.pyplot as plt

x = range(10)
y1 = [1, 2, 3, 4, 5, 6, 7, 8, 9, 10]
y2 = [3, 6, 9, 12, 15, 18, 21, 24, 27, 30]
y3 = [5, 9, 12, 14, 15, 15, 14, 12, 9, 5]

plt.plot(x, y1, label='Line 1', linestyle='--')
plt.plot(x, y2, label='Line 2', linestyle='-.')
plt.plot(x, y3, label='Line 3', linestyle=':')
plt.xlabel('X-axis')
plt.ylabel('Y-axis')
plt.legend()
plt.show()
In this example, three lines y1, y2, and y3 are plotted with different line styles. Labels are added to the x and y axes using xlabel() and ylabel() functions.
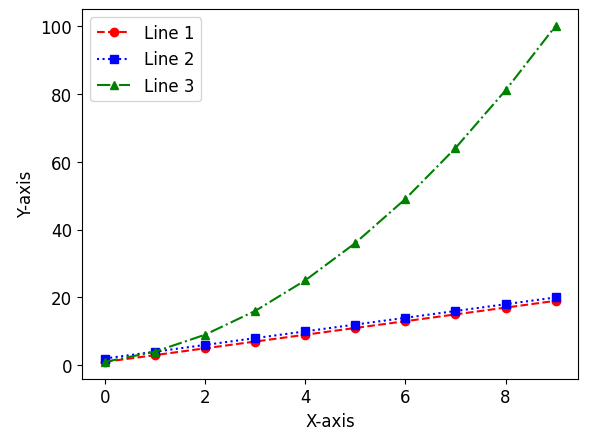
Example 10
import matplotlib.pyplot as plt

x = range(10)
y1 = [1, 3, 5, 7, 9, 11, 13, 15, 17, 19]
y2 = [2, 4, 6, 8, 10, 12, 14, 16, 18, 20]
y3 = [1, 4, 9, 16, 25, 36, 49, 64, 81, 100]

plt.plot(x, y1, label='Line 1', color='red', linestyle='--', marker='o')
plt.plot(x, y2, label='Line 2', color='blue', linestyle=':', marker='s')
plt.plot(x, y3, label='Line 3', color='green', linestyle='-.', marker='^')
plt.xlabel('X-axis')
plt.ylabel('Y-axis')
plt.legend()
plt.show()
This example plots three lines y1, y2, and y3 with different colors, line styles, and marker styles. Labels are added to the x and y axes.
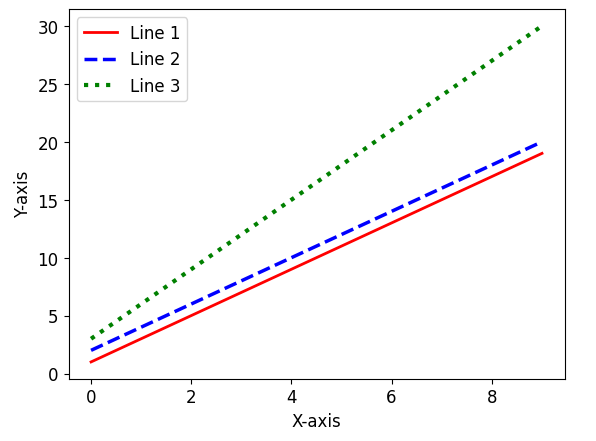
Example 11
import matplotlib.pyplot as plt

x = range(10)
y1 = [1, 3, 5, 7, 9, 11, 13, 15, 17, 19]
y2 = [2, 4, 6, 8, 10, 12, 14, 16, 18, 20]
y3 = [3, 6, 9, 12, 15, 18, 21, 24, 27, 30]

plt.plot(x, y1, label='Line 1', color='red', linestyle='-', linewidth=2)
plt.plot(x, y2, label='Line 2', color='blue', linestyle='--', linewidth=2.5)
plt.plot(x, y3, label='Line 3', color='green', linestyle=':', linewidth=3)
plt.xlabel('X-axis')
plt.ylabel('Y-axis')
plt.legend()
plt.show()
This example plots three lines y1, y2, and y3 with different colors, line styles, and line widths. Labels are added to the x and y axes.
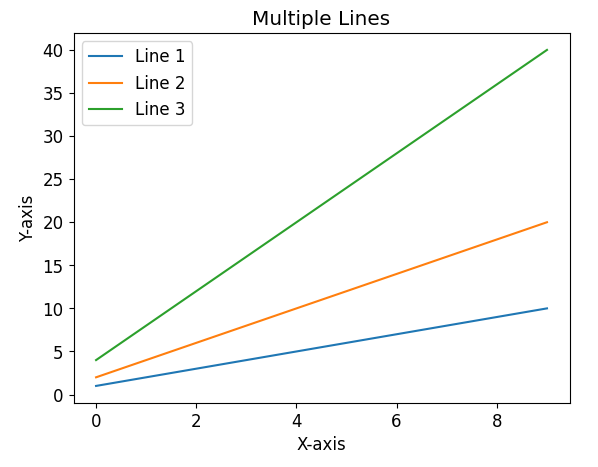
Example 12
import matplotlib.pyplot as plt

x = range(10)
y1 = [1, 2, 3, 4, 5, 6, 7, 8, 9, 10]
y2 = [2, 4, 6, 8, 10, 12, 14, 16, 18, 20]
y3 = [4, 8, 12, 16, 20, 24, 28, 32, 36, 40]

plt.plot(x, y1, label='Line 1')
plt.plot(x, y2, label='Line 2')
plt.plot(x, y3, label='Line 3')
plt.xlabel('X-axis')
plt.ylabel('Y-axis')
plt.title('Multiple Lines')
plt.legend()
plt.show()
This example plots three lines y1, y2, and y3 and adds labels to the x and y axes. A title is also added to the graph using title() function.
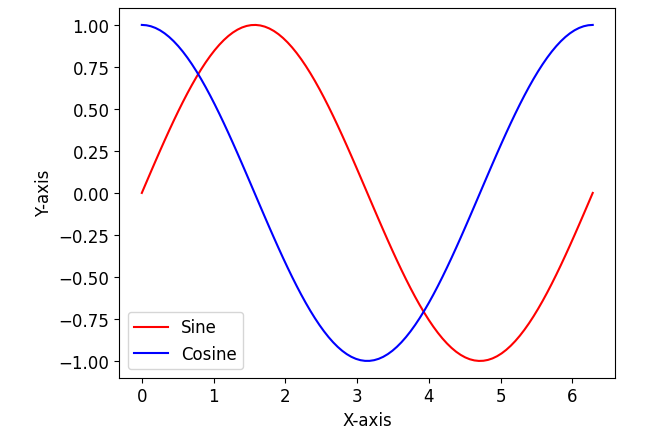
Example 13
import matplotlib.pyplot as plt
import numpy as np

x = np.linspace(0, 2*np.pi, 100)
y1 = np.sin(x)
y2 = np.cos(x)

plt.plot(x, y1, label='Sine', color='red')
plt.plot(x, y2, label='Cosine', color='blue')
plt.xlabel('X-axis')
plt.ylabel('Y-axis')
plt.legend()
plt.show()
In this example, the numpy module is used to generate an array x with values ranging from 0 to 2π. The sin() and cos() functions are then applied to x to obtain arrays y1 (sine values) and y2 (cosine values). These arrays are then plotted with different colors. Labels are added to the x and y axes, and a legend is displayed.
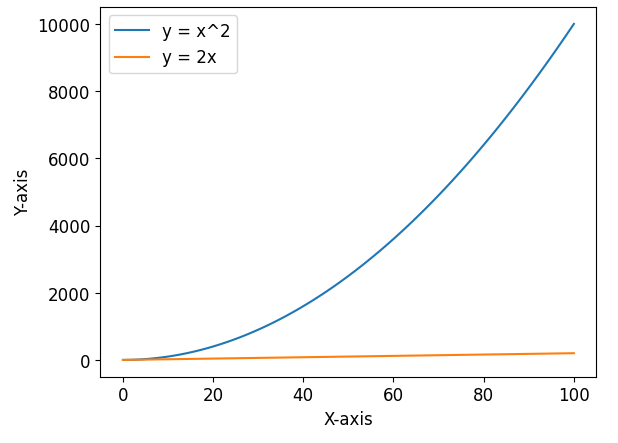
Example 14
import matplotlib.pyplot as plt

x = range(101)
y1 = [x_i**2 for x_i in x]
y2 = [2*x_i for x_i in x]

plt.plot(x, y1, label='y = x^2')
plt.plot(x, y2, label='y = 2x')
plt.xlabel('X-axis')
plt.ylabel('Y-axis')
plt.legend()
plt.show()
This example plots two lines y = x^2 and y = 2x where x ranges from 0 to 100. The lines are defined using list comprehensions. Labels are added to the x and y axes, and a legend is displayed.
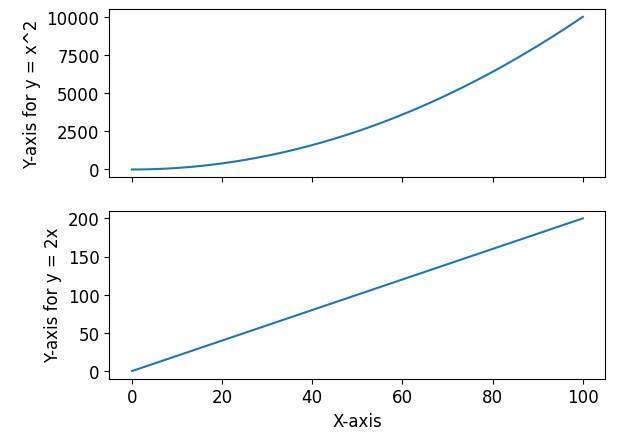
Example 15
import matplotlib.pyplot as plt

x = range(101)
y1 = [x_i**2 for x_i in x]
y2 = [2*x_i for x_i in x]

fig, (ax1, ax2) = plt.subplots(2, 1, sharex=True)

ax1.plot(x, y1)
ax1.set_ylabel('Y-axis for y = x^2')

ax2.plot(x, y2)
ax2.set_xlabel('X-axis')
ax2.set_ylabel('Y-axis for y = 2x')

plt.show()
This example plots two lines y = x^2 and y = 2x. The subplots are created using the subplots() function, and the axes are assigned to ax1 and ax2. The sharex=True parameter ensures that the x-axis is shared between the two subplots. Labels are added to each subplot using set_xlabel() and set_ylabel() functions.