Matplotlib Line Thickness
Matplotlib is a widely used library in Python for creating static, animated, and interactive visualizations in Python. One of the basic features of Matplotlib is the ability to control the thickness or width of lines in plots. In this article, we will explore how to adjust the line thickness in Matplotlib and provide several code examples to demonstrate the different options available.
Basics of Line Thickness in Matplotlib
In Matplotlib, line thickness or width is controlled by the linewidth parameter. This parameter determines the thickness of lines drawn for various elements such as lines, curves, scatter markers, etc.
By default, the linewidth parameter is set to 1.0, which represents a relatively thin line. However, we can adjust this parameter to achieve the desired thickness according to our visual needs.
To modify the line thickness, we need to pass the linewidth argument to the Matplotlib functions responsible for generating the desired plot. Let’s now take a look at some code examples to better understand how to adjust the line thickness using Matplotlib.
Matplotlib Line Thickness Code Examples
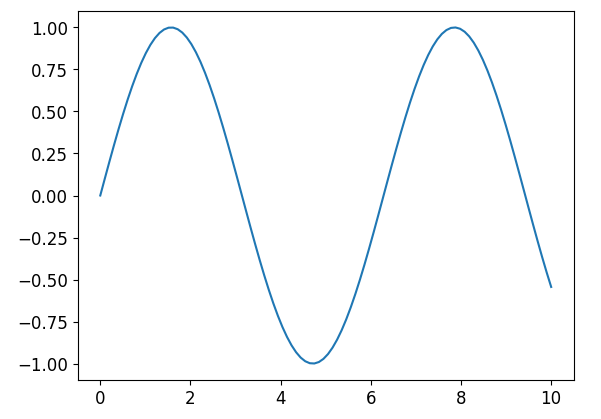
Example 1: Line Plot with Default Line Thickness
In this example, we will create a simple line plot using the plot function in Matplotlib without specifying the linewidth parameter. The default line thickness will be used.
import matplotlib.pyplot as plt
import numpy as np

x = np.linspace(0, 10, 100)
y = np.sin(x)

plt.plot(x, y)
plt.show()
The code above generates a basic line plot with the default line thickness. Now let’s move on to adjusting the line thickness.
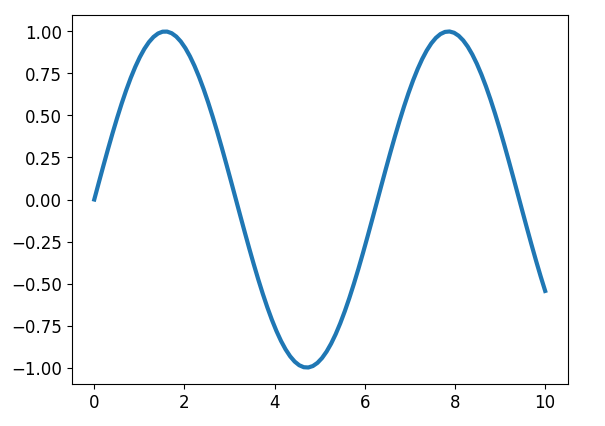
Example 2: Thicker Line Plot
To create a thicker line plot, we can modify the linewidth parameter. In this example, we will set linewidth to 3.0 to obtain a thicker line.
import matplotlib.pyplot as plt
import numpy as np

x = np.linspace(0, 10, 100)
y = np.sin(x)

plt.plot(x, y, linewidth=3.0)
plt.show()
Here, we have specified linewidth=3.0 in the plot function to increase the line thickness.
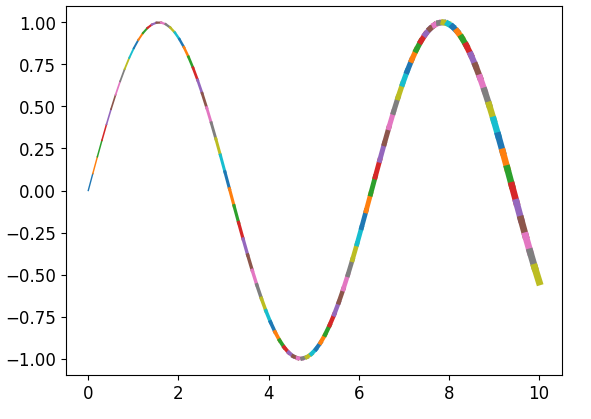
Example 3: Line Plot with Varying Thickness
In some cases, we may want to have lines with varying thickness across the plot. Matplotlib provides the option to specify a varying linewidth parameter by using an array of values.
import matplotlib.pyplot as plt
import numpy as np

x = np.linspace(0, 10, 100)
y = np.sin(x)
linewidths = np.linspace(1, 5, 100)

for i in range(len(x) - 1):
    plt.plot(x[i:i+2], y[i:i+2], linewidth=linewidths[i])

plt.show()
In this code snippet, we have created an array linewidths with values ranging from 1 to 5. The linewidth parameter is set to this array to achieve varying line thickness across the plot.
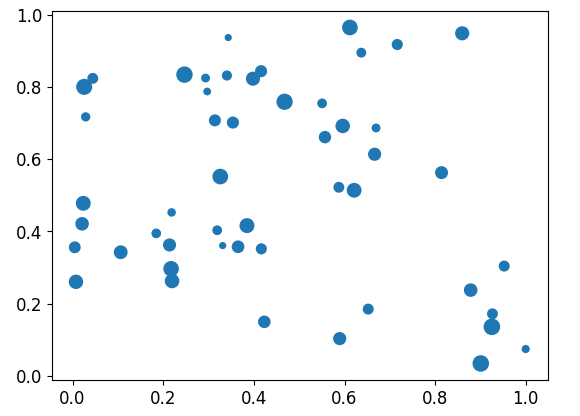
Example 4: Thick Scatter Plot Markers
Line thickness can also be adjusted for scatter plots to control the thickness of marker edges. In this example, we will use the scatter function to create a scatter plot with thicker markers.
import matplotlib.pyplot as plt
import numpy as np

x = np.random.rand(50)
y = np.random.rand(50)
sizes = np.random.randint(10, 100, 50)

plt.scatter(x, y, s=sizes, linewidth=2.0)
plt.show()
By specifying linewidth=2.0 in the scatter function, we increase the thickness of the marker edges.
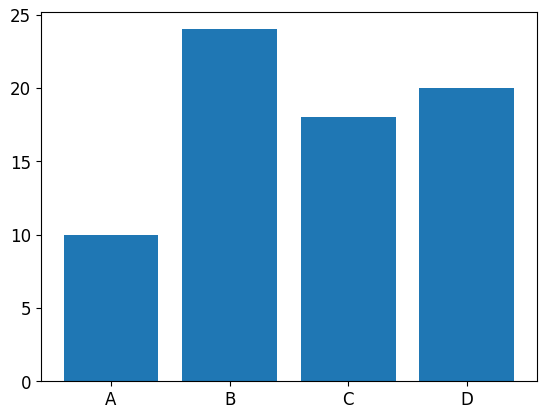
Example 5: Thick Lines in Bar Plot
A common visualization is the bar plot, which can also benefit from adjusting the line thickness. Let’s see an example of how to create a bar plot with thicker lines.
import matplotlib.pyplot as plt

categories = ['A', 'B', 'C', 'D']
values = [10, 24, 18, 20]

plt.bar(categories, values, linewidth=2.5)
plt.show()
The bar function accepts the linewidth parameter to set the thickness of the lines bordering each bar.
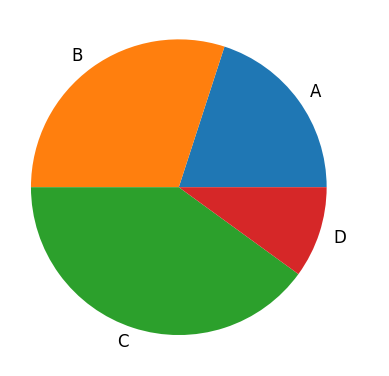
Example 6: Thick Lines in a Pie Chart
In a pie chart, we can adjust the thickness of the lines separating the different sections. Here is an example showing how to create a pie chart with thicker lines.
import matplotlib.pyplot as plt

sizes = [20, 30, 40, 10]
labels = ['A', 'B', 'C', 'D']

plt.pie(sizes, labels=labels, wedgeprops={'linewidth': 3.0})
plt.show()
By setting wedgeprops={'linewidth': 3.0} in the pie function, we increase the thickness of the lines in the pie chart.
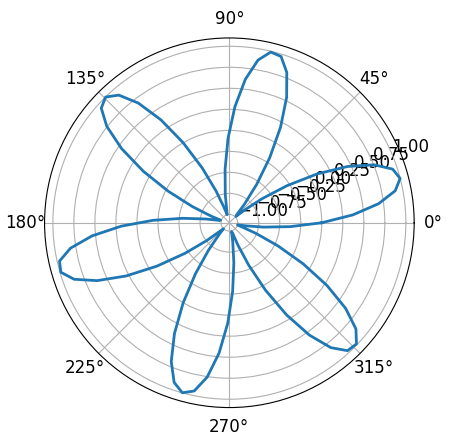
Example 7: Thick Lines in a Polar Plot
Matplotlib allows us to create polar plots using the polar function. We can adjust the line thickness in polar plots as well.
import matplotlib.pyplot as plt
import numpy as np

theta = np.linspace(0, 2 * np.pi, 100)
radius = np.sin(6 * theta)

plt.polar(theta, radius, linewidth=2.0)
plt.show()
Here, the linewidth parameter is set to 2.0 in the polar function to adjust the line thickness in the polar plot.
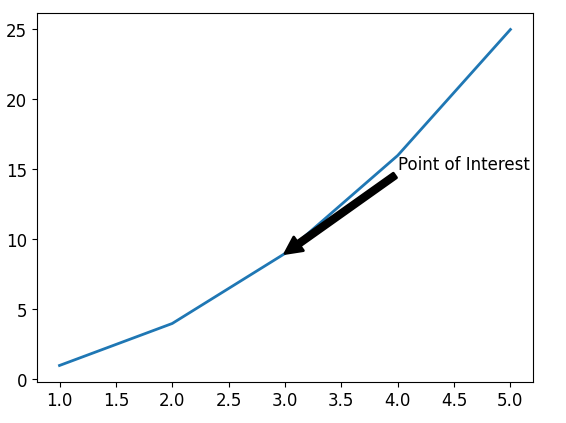
Example 8: Thick Lines with Annotations
In Matplotlib, we can add annotations or arrows to plots using the annotate function. Let’s see an example of how to create an annotated plot with thicker lines.
import matplotlib.pyplot as plt

x = [1, 2, 3, 4, 5]
y = [1, 4, 9, 16, 25]

plt.plot(x, y, linewidth=2.0)
plt.annotate('Point of Interest', xy=(3, 9), xytext=(4, 15),
             arrowprops=dict(facecolor='black', linewidth=2.0))
plt.show()
In this code snippet, we have set linewidth=2.0 in the plot function and linewidth=2.0 in the arrowprops argument of the annotate function to adjust the line thickness in both the plot and the arrow.
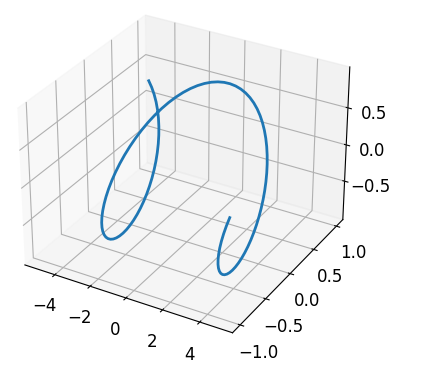
Example 9: Thick Lines in 3D Plot
Matplotlib also supports creating 3D plots using the mplot3d toolkit. Let’s see an example of how to create a 3D plot with thicker lines.
import matplotlib.pyplot as plt
from mpl_toolkits import mplot3d
import numpy as np

fig = plt.figure()
ax = plt.axes(projection='3d')

x = np.linspace(-5, 5, 100)
y = np.sin(x)
z = np.cos(x)

ax.plot3D(x, y, z, linewidth=2.0)
plt.show()
By setting linewidth=2.0 in the plot3D function, we increase the line thickness in the 3D plot.
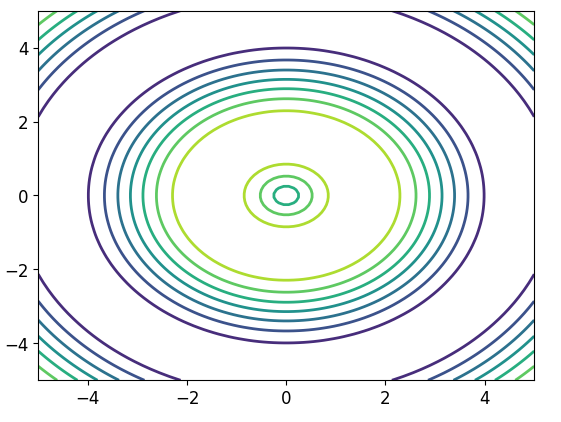
Example 10: Thick Lines in Contour Plot
Contour plots are widely used to represent 3D data on a 2D plane. We can customize the line thickness in contour plots as well.
import matplotlib.pyplot as plt
import numpy as np

x = np.linspace(-5, 5, 100)
y = np.linspace(-5, 5, 100)
X, Y = np.meshgrid(x, y)
Z = np.sin(np.sqrt(X ** 2 + Y ** 2))

plt.contour(X, Y, Z, linewidths=2.0)
plt.show()
Using the linewidths parameter in the contour function, we can adjust the line thickness in the contour plot.
Matplotlib Line Thickness Conclusion
In this article, we have explored how to adjust line thickness in Matplotlib. We have seen various examples of line thickness customization, including line plots, scatter plots, bar plots, pie charts, polar plots, annotations, 3D plots, and contour plots. By modifying the linewidth parameter, we can create visualizations with the desired line thickness, thereby enhancing the clarity and aesthetics of our plots.