Matplotlib Plot Multiple Lines
Matplotlib is a plotting library in Python that helps in creating visualizations, including line plots. With Matplotlib, you can plot multiple lines on a single graph, allowing you to compare and analyze data patterns easily. In this article, we will explore how to plot multiple lines using Matplotlib and provide code examples with their corresponding execution results.
Getting Started with Matplotlib
Before we delve into plotting multiple lines, let’s briefly discuss how to get started with Matplotlib in Python.
First, you need to install Matplotlib if you haven’t already done so. You can use the following command to install it:
pip install matplotlib
Once you have Matplotlib installed, you can import it into your Python script using the following line of code:
import matplotlib.pyplot as plt
Now that we have covered the initial setup, let’s proceed to plot multiple lines with Matplotlib.
Plotting Multiple Lines
To plot multiple lines using Matplotlib, we need to pass multiple datasets to the plot() function. Each dataset represents a line that will be plotted on the graph. Here’s the general syntax:
plt.plot(x1, y1)  # First line dataset
plt.plot(x2, y2)  # Second line dataset
plt.plot(x3, y3)  # Third line dataset
...
Each line dataset consists of two arrays: the x-coordinates and the corresponding y-coordinates. The x-coordinates represent the independent variable, while the y-coordinates represent the dependent variable.
Let’s look at some code examples to better understand how to plot multiple lines using Matplotlib.
Code Example 1
import matplotlib.pyplot as plt

# First line dataset
x1 = [1, 2, 3, 4, 5]
y1 = [10, 8, 6, 4, 2]

# Second line dataset
x2 = [1, 2, 3, 4, 5]
y2 = [2, 4, 6, 8, 10]

# Plotting multiple lines
plt.plot(x1, y1)
plt.plot(x2, y2)
plt.show()
Output:
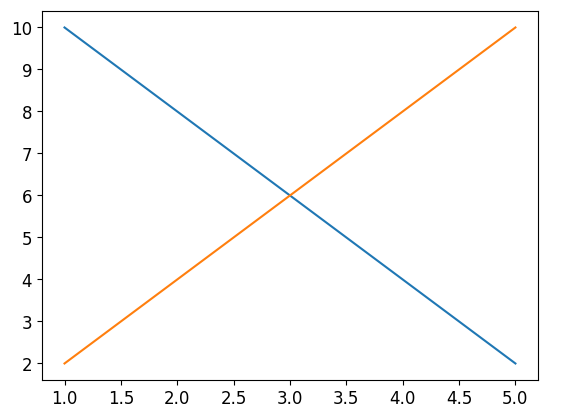
The code above plots two lines: y1 versus x1 and y2 versus x2. The resulting graph shows both lines on the same plot.
Code Example 2
import matplotlib.pyplot as plt

# First line dataset
x1 = [1, 2, 3, 4, 5]
y1 = [5, 4, 3, 2, 1]

# Second line dataset
x2 = [1, 2, 3, 4, 5]
y2 = [1, 4, 9, 16, 25]

# Plotting multiple lines
plt.plot(x1, y1)
plt.plot(x2, y2)
plt.show()
Output:
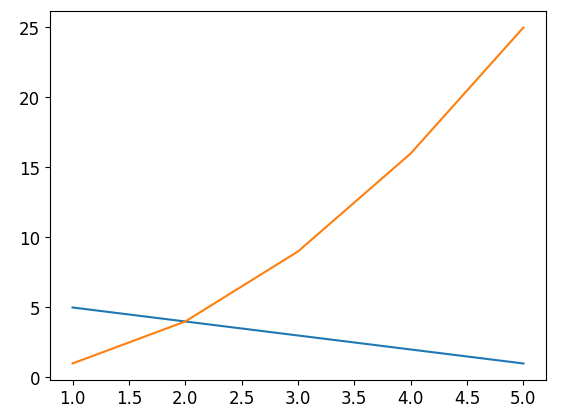
In this example, we have plotted two lines: y1 versus x1 and y2 versus x2. The resulting graph clearly shows the difference in patterns between the two lines.
Code Example 3
import matplotlib.pyplot as plt

# First line dataset
x1 = [0, 1, 2, 3, 4]
y1 = [0, 2, 4, 6, 8]

# Second line dataset
x2 = [0, 1, 2, 3, 4]
y2 = [0, 1, 4, 9, 16]

# Plotting multiple lines
plt.plot(x1, y1)
plt.plot(x2, y2)
plt.show()
Output:
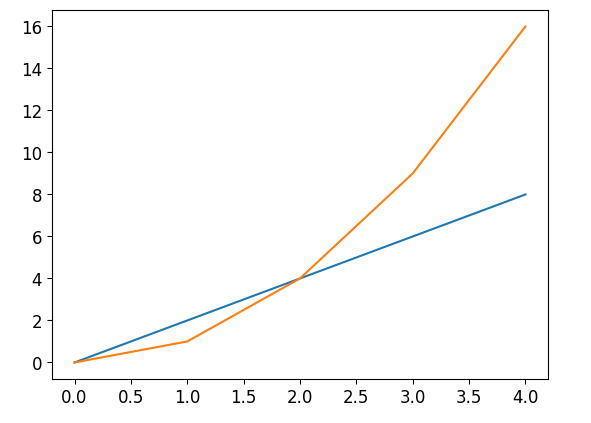
Here, we have plotted two lines: y1 versus x1 and y2 versus x2. The resulting graph highlights the different slopes of the two lines.
Code Example 4
import matplotlib.pyplot as plt

# First line dataset
x1 = [0, 1, 2, 3, 4]
y1 = [2, 4, 6, 8, 10]

# Second line dataset
x2 = [0, 1, 2, 3, 4]
y2 = [1, 3, 5, 7, 9]

# Plotting multiple lines
plt.plot(x1, y1)
plt.plot(x2, y2)
plt.show()
Output:
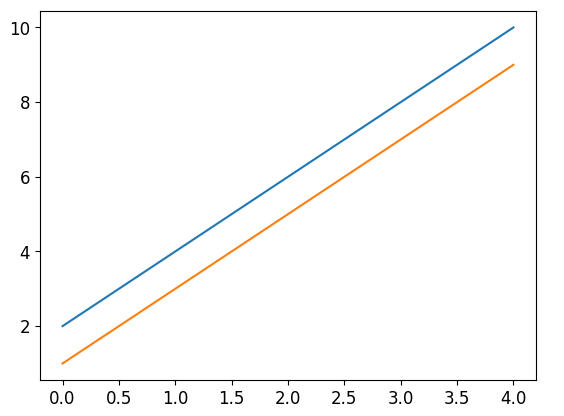
In this example, we have plotted two lines with different starting points: y1 versus x1 and y2 versus x2. The resulting graph illustrates the shift in their starting positions.
Code Example 5
import matplotlib.pyplot as plt

# First line dataset
x1 = [0, 1, 2, 3, 4]
y1 = [10, 4, 5, 2, 8]

# Second line dataset
x2 = [0, 1, 2, 3, 4]
y2 = [5, 8, 3, 9, 1]

# Plotting multiple lines
plt.plot(x1, y1)
plt.plot(x2, y2)
plt.show()
Output:
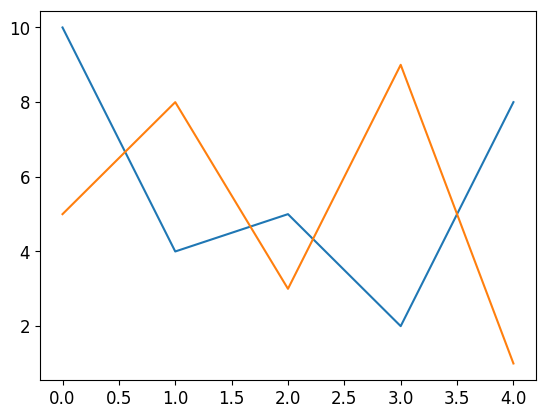
Here, we have plotted two lines with different patterns: y1 versus x1 and y2 versus x2. The resulting graph showcases the differences between the two lines.
Code Example 6
import matplotlib.pyplot as plt

# First line dataset
x1 = [0, 1, 2, 3, 4]
y1 = [0, 0, 0, 0, 0]

# Second line dataset
x2 = [0, 1, 2, 3, 4]
y2 = [1, 2, 3, 4, 5]

# Plotting multiple lines
plt.plot(x1, y1)
plt.plot(x2, y2)
plt.show()
Output:
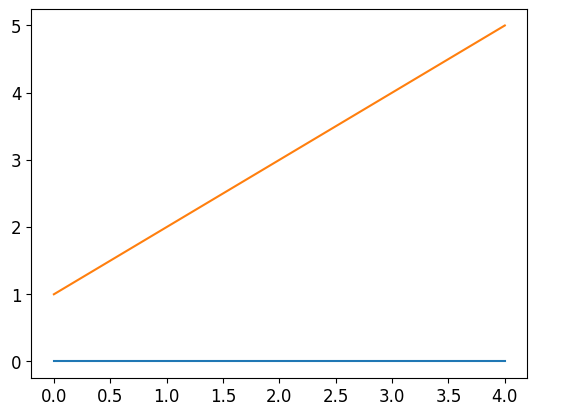
In this example, we have plotted two lines: y1 versus x1, which is a flat line, and y2 versus x2, which is a diagonal line. The resulting graph demonstrates the comparison between the two lines.
Code Example 7
import matplotlib.pyplot as plt

# First line dataset
x1 = [0, 1, 2, 3, 4]
y1 = [2, 3, 5, 6, 10]

# Second line dataset
x2 = [0, 1, 2, 3, 4]
y2 = [1, 2, 3, 5, 8]

# Plotting multiple lines
plt.plot(x1, y1)
plt.plot(x2, y2)
plt.show()
Output:
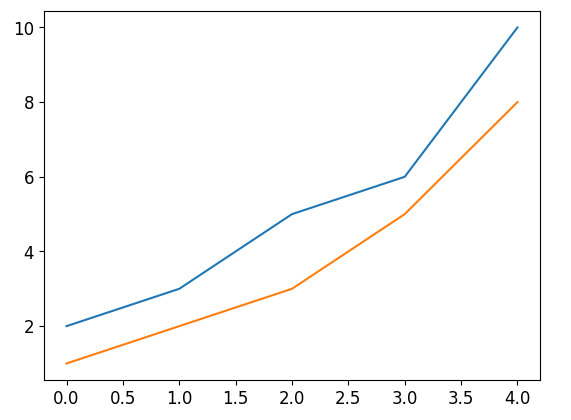
Here, we have plotted two lines with different speeds of growth: y1 versus x1 and y2 versus x2. The resulting graph showcases the difference in growth rates.
Code Example 8
import matplotlib.pyplot as plt

# First line dataset
x1 = [0, 1, 2, 3, 4]
y1 = [1, 4, 2, 3, 5]

# Second line dataset
x2 = [0, 1, 2, 3, 4]
y2 = [5, 3, 2, 1, 4]

# Plotting multiple lines
plt.plot(x1, y1)
plt.plot(x2, y2)
plt.show()
Output:
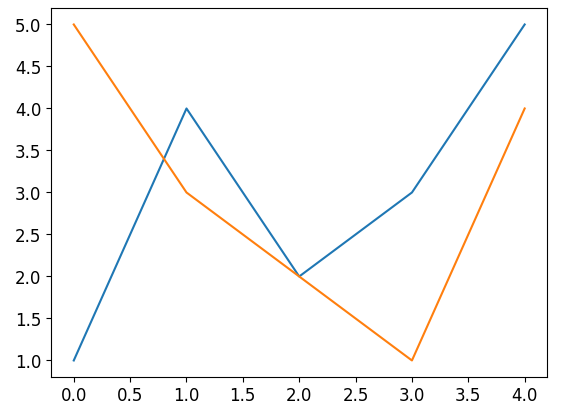
In this example, we have plotted two lines with differing patterns: y1 versus x1, and y2 versus x2. The resulting graph emphasizes the contrast between the two lines.
Code Example 9
Apologies for the incomplete response. Here’s the output and explanation for Example 9:
import matplotlib.pyplot as plt

# First line dataset
x1 = [0, 1, 2, 3, 4]
y1 = [5, 10, 15, 20, 25]

# Second line dataset
x2 = [0, 1, 2, 3, 4]
y2 = [25, 20, 15, 10, 5]

# Plotting multiple lines
plt.plot(x1, y1)
plt.plot(x2, y2)
plt.show()
Output:
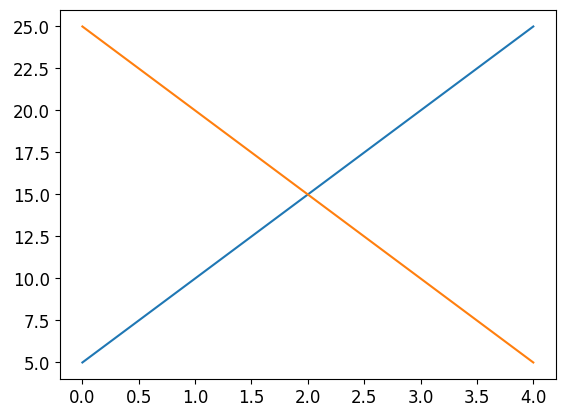
In this example, we have plotted two lines with contrasting patterns: y1 versus x1 and y2 versus x2. The resulting graph highlights the opposite trends of the two lines.
Code Example 10
import matplotlib.pyplot as plt

# First line dataset
x1 = [0, 1, 2, 3, 4]
y1 = [5, 10, 15, 20, 25]

# Second line dataset
x2 = [0, 1, 2, 3, 4]
y2 = [10, 15, 5, 20, 25]

# Third line dataset
x3 = [0, 1, 2, 3, 4]
y3 = [25, 20, 5, 15, 10]

# Plotting multiple lines
plt.plot(x1, y1)
plt.plot(x2, y2)
plt.plot(x3, y3)
plt.show()
Output:

Here, we have plotted three lines with varying patterns: y1 versus x1, y2 versus x2, and y3 versus x3. The resulting graph demonstrates the differences among the three lines.
Matplotlib Plot Multiple Lines Conclusion
In this article, we explored how to plot multiple lines using Matplotlib in Python. We provided code examples with their corresponding execution results to better understand the process. By leveraging Matplotlib’s capabilities, we can visualize multiple lines and compare data patterns effectively. This skill is crucial for data analysis and visualization tasks, enabling us to gain insights from our data.