Comprehensive Guide to Matplotlib.pyplot.setp() Function in Python
Matplotlib.pyplot.setp() function in Python is a powerful tool for customizing plot properties in data visualization. This versatile function allows you to set multiple properties for collections of artists or a single artist in a single function call. Whether you’re working with lines, markers, text, or other plot elements, Matplotlib.pyplot.setp() provides a convenient way to adjust their appearance and behavior.
In this comprehensive guide, we’ll explore the various aspects of the Matplotlib.pyplot.setp() function, its syntax, usage, and practical applications. We’ll cover how to use this function to modify properties of different plot elements, handle multiple artists, and create visually appealing and informative plots.
Understanding the Basics of Matplotlib.pyplot.setp()
Matplotlib.pyplot.setp() function is part of the pyplot module in Matplotlib, which provides a MATLAB-like plotting interface. The setp() function is designed to set properties on artists or collections of artists. It’s particularly useful when you want to modify multiple properties of one or more artists simultaneously.
The basic syntax of Matplotlib.pyplot.setp() is as follows:
import matplotlib.pyplot as plt

plt.setp(object_or_sequence, **kwargs)
Here, object_or_sequence can be a single artist (like a Line2D object) or a sequence of artists. The **kwargs are keyword arguments that specify the properties you want to set.
Let’s start with a simple example to illustrate how Matplotlib.pyplot.setp() works:
import matplotlib.pyplot as plt
import numpy as np

x = np.linspace(0, 10, 100)
y = np.sin(x)

fig, ax = plt.subplots()
line, = ax.plot(x, y)

plt.setp(line, color='red', linewidth=2, linestyle='--')

plt.title('How to use Matplotlib.pyplot.setp() - how2matplotlib.com')
plt.show()
Output:
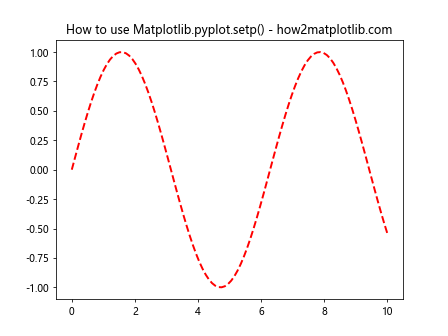
In this example, we create a simple sine wave plot and use Matplotlib.pyplot.setp() to set the color, linewidth, and linestyle of the line. The function allows us to set multiple properties in a single call, making our code more concise and readable.
Setting Properties for Multiple Artists
One of the strengths of Matplotlib.pyplot.setp() is its ability to set properties for multiple artists at once. This is particularly useful when you have several plot elements that you want to style consistently.
Here’s an example that demonstrates how to use Matplotlib.pyplot.setp() with multiple lines:
import matplotlib.pyplot as plt
import numpy as np

x = np.linspace(0, 10, 100)
y1 = np.sin(x)
y2 = np.cos(x)
y3 = np.tan(x)

fig, ax = plt.subplots()
line1, = ax.plot(x, y1)
line2, = ax.plot(x, y2)
line3, = ax.plot(x, y3)

plt.setp([line1, line2, line3], linewidth=2)
plt.setp(line1, color='red')
plt.setp(line2, color='green')
plt.setp(line3, color='blue')

plt.title('Multiple Artists with Matplotlib.pyplot.setp() - how2matplotlib.com')
plt.show()
Output:
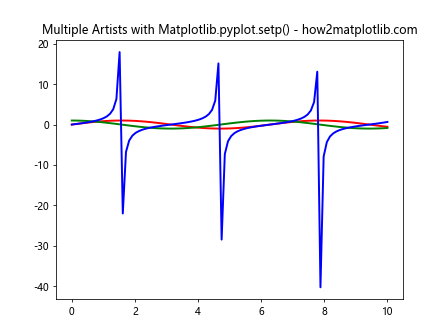
In this example, we create three different trigonometric function plots and use Matplotlib.pyplot.setp() to set the linewidth for all three lines at once. Then, we set individual colors for each line. This demonstrates how Matplotlib.pyplot.setp() can be used both for bulk property setting and for individual artist customization.
Adjusting Text Properties with Matplotlib.pyplot.setp()
Matplotlib.pyplot.setp() can also be used to modify text properties, including those of titles, labels, and annotations. Here’s an example that demonstrates this capability:
import matplotlib.pyplot as plt
import numpy as np

x = np.linspace(0, 10, 100)
y = np.sin(x)

fig, ax = plt.subplots()
ax.plot(x, y)

title = ax.set_title('Sine Wave')
xlabel = ax.set_xlabel('X-axis')
ylabel = ax.set_ylabel('Y-axis')

plt.setp([title, xlabel, ylabel], fontsize=14, fontweight='bold', color='navy')
plt.setp(title, fontsize=16)

plt.title('Text Properties with Matplotlib.pyplot.setp() - how2matplotlib.com')
plt.show()
Output:
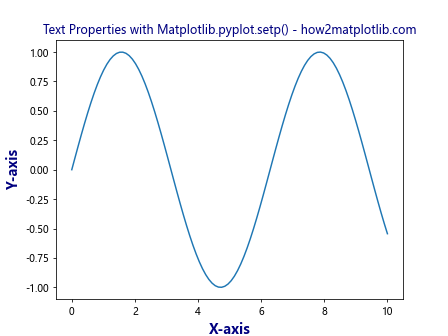
In this example, we create a simple sine wave plot and use Matplotlib.pyplot.setp() to set the font size, font weight, and color for the title and axis labels. We then use it again to increase the font size of the title specifically. This demonstrates how Matplotlib.pyplot.setp() can be used to set properties for multiple text elements at once and then fine-tune individual elements.
Using Matplotlib.pyplot.setp() with Axes and Figures
Matplotlib.pyplot.setp() can also be used to modify properties of axes and figures. This is particularly useful when you want to adjust the overall appearance of your plot. Here’s an example:
import matplotlib.pyplot as plt
import numpy as np

x = np.linspace(0, 10, 100)
y = np.sin(x)

fig, ax = plt.subplots()
ax.plot(x, y)

plt.setp(ax, facecolor='lightgray', alpha=0.3)
plt.setp(ax.spines.values(), linewidth=2, color='darkblue')
plt.setp(ax.get_xticklabels(), rotation=45, ha='right')

plt.title('Axes and Figure Properties with Matplotlib.pyplot.setp() - how2matplotlib.com')
plt.tight_layout()
plt.show()
Output:
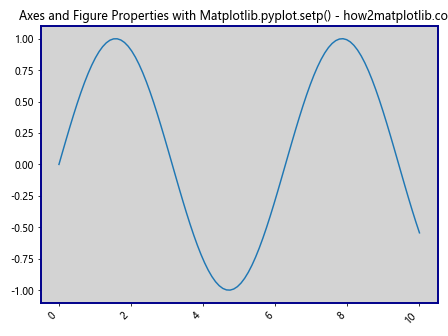
In this example, we use Matplotlib.pyplot.setp() to set the background color of the axes, the linewidth and color of the spines (the lines that frame the plot area), and the rotation of the x-axis tick labels. This demonstrates how Matplotlib.pyplot.setp() can be used to fine-tune various aspects of the plot’s appearance.
Setting Properties for Legend with Matplotlib.pyplot.setp()
Legends are an important part of many plots, and Matplotlib.pyplot.setp() can be used to customize their appearance. Here’s an example:
import matplotlib.pyplot as plt
import numpy as np

x = np.linspace(0, 10, 100)
y1 = np.sin(x)
y2 = np.cos(x)

fig, ax = plt.subplots()
line1, = ax.plot(x, y1, label='Sine')
line2, = ax.plot(x, y2, label='Cosine')

legend = ax.legend()

plt.setp(legend.get_texts(), fontsize=12)
plt.setp(legend.get_title(), fontsize=14, fontweight='bold')
plt.setp(legend.get_frame(), facecolor='lightgray', edgecolor='black')

plt.title('Legend Properties with Matplotlib.pyplot.setp() - how2matplotlib.com')
plt.show()
Output:
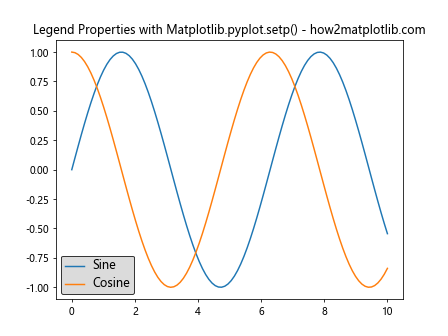
In this example, we create a plot with two lines and a legend. We then use Matplotlib.pyplot.setp() to customize the font size of the legend text, the font size and weight of the legend title, and the appearance of the legend box. This demonstrates how Matplotlib.pyplot.setp() can be used to fine-tune various aspects of the legend’s appearance.
Using Matplotlib.pyplot.setp() with Colorbars
Colorbars are often used in plots to provide a reference for color-mapped data. Matplotlib.pyplot.setp() can be used to customize their appearance as well. Here’s an example:
import matplotlib.pyplot as plt
import numpy as np

x = np.linspace(-3, 3, 100)
y = np.linspace(-3, 3, 100)
X, Y = np.meshgrid(x, y)
Z = np.sin(X) * np.cos(Y)

fig, ax = plt.subplots()
im = ax.imshow(Z, cmap='viridis')
cbar = fig.colorbar(im)

plt.setp(cbar.ax.get_yticklabels(), fontsize=10)
plt.setp(cbar.ax.get_ylabel(), fontsize=12, rotation=270, labelpad=15)

plt.title('Colorbar Properties with Matplotlib.pyplot.setp() - how2matplotlib.com')
plt.show()
Output:
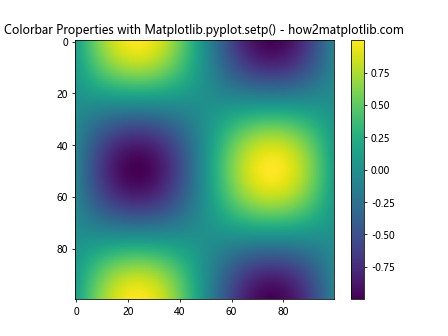
In this example, we create a 2D color plot and add a colorbar. We then use Matplotlib.pyplot.setp() to set the font size of the colorbar tick labels and to adjust the font size, rotation, and padding of the colorbar label. This demonstrates how Matplotlib.pyplot.setp() can be used to customize various aspects of a colorbar’s appearance.
Setting Properties for Multiple Subplots
When working with multiple subplots, Matplotlib.pyplot.setp() can be particularly useful for setting properties across all subplots at once. Here’s an example:
import matplotlib.pyplot as plt
import numpy as np

x = np.linspace(0, 10, 100)
y1 = np.sin(x)
y2 = np.cos(x)
y3 = np.tan(x)
y4 = np.exp(-x/10)

fig, axs = plt.subplots(2, 2, figsize=(10, 10))
axs = axs.ravel()

axs[0].plot(x, y1)
axs[1].plot(x, y2)
axs[2].plot(x, y3)
axs[3].plot(x, y4)

plt.setp(axs, xlim=(0, 10), ylim=(-2, 2))
plt.setp(axs[2:], ylim=(-10, 10))

for ax in axs:
    plt.setp(ax.spines.values(), linewidth=2, color='gray')
    plt.setp(ax.get_xticklabels(), rotation=45, ha='right')

plt.suptitle('Multiple Subplots with Matplotlib.pyplot.setp() - how2matplotlib.com', fontsize=16)
plt.tight_layout()
plt.show()
Output:
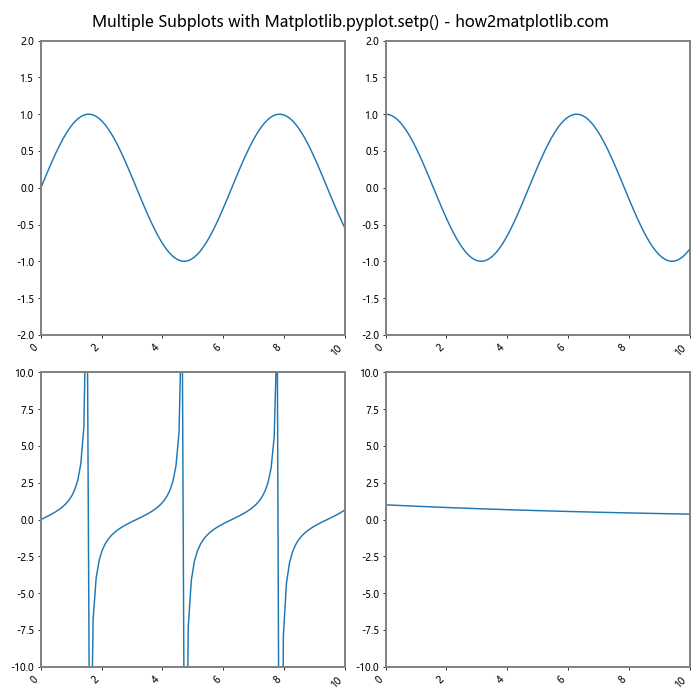
In this example, we create a 2×2 grid of subplots, each with a different function plotted. We use Matplotlib.pyplot.setp() to set the x and y limits for all subplots at once, then adjust the y limits for the bottom two subplots. We also use it in a loop to set the spine properties and x-tick label rotation for all subplots. This demonstrates how Matplotlib.pyplot.setp() can be used to efficiently set properties across multiple subplots.
Using Matplotlib.pyplot.setp() with 3D Plots
Matplotlib.pyplot.setp() can also be used with 3D plots to customize various aspects of the visualization. Here’s an example:
import matplotlib.pyplot as plt
import numpy as np
from mpl_toolkits.mplot3d import Axes3D

fig = plt.figure()
ax = fig.add_subplot(111, projection='3d')

theta = np.linspace(-4 * np.pi, 4 * np.pi, 100)
z = np.linspace(-2, 2, 100)
r = z**2 + 1
x = r * np.sin(theta)
y = r * np.cos(theta)

line, = ax.plot(x, y, z)

plt.setp(line, linewidth=2, color='red')
plt.setp(ax.xaxis.get_majorticklabels(), rotation=45)
plt.setp(ax.yaxis.get_majorticklabels(), rotation=45)
plt.setp(ax.zaxis.get_majorticklabels(), rotation=45)

ax.set_xlabel('X axis')
ax.set_ylabel('Y axis')
ax.set_zlabel('Z axis')

plt.title('3D Plot with Matplotlib.pyplot.setp() - how2matplotlib.com')
plt.show()
Output:
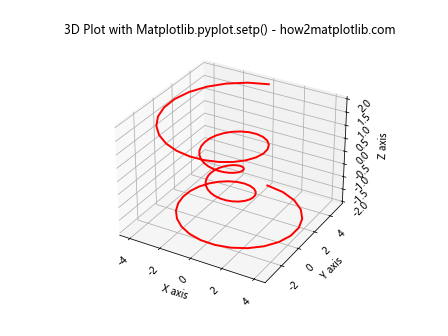
In this example, we create a 3D spiral plot and use Matplotlib.pyplot.setp() to set the linewidth and color of the spiral. We also use it to rotate the tick labels on all three axes for better readability. This demonstrates how Matplotlib.pyplot.setp() can be applied to 3D plots to enhance their appearance and readability.
Advanced Usage: Setting Properties Dynamically
One of the powerful features of Matplotlib.pyplot.setp() is its ability to set properties dynamically based on data or other conditions. Here’s an example that demonstrates this:
import matplotlib.pyplot as plt
import numpy as np

x = np.linspace(0, 10, 100)
y1 = np.sin(x)
y2 = np.cos(x)

fig, ax = plt.subplots()
lines = ax.plot(x, y1, x, y2)

colors = ['red', 'blue']
linestyles = ['-', '--']

for line, color, linestyle in zip(lines, colors, linestyles):
    plt.setp(line, color=color, linestyle=linestyle, linewidth=2)

plt.setp(lines, marker='o', markersize=4)

plt.title('Dynamic Property Setting with Matplotlib.pyplot.setp() - how2matplotlib.com')
plt.show()
Output:
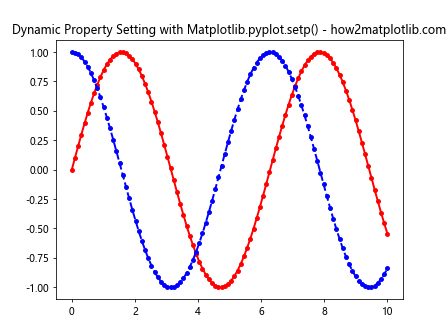
In this example, we create two lines and use Matplotlib.pyplot.setp() in a loop to set different colors and linestyles for each line. We then use it again to set markers for both lines at once. This demonstrates how Matplotlib.pyplot.setp() can be used in more complex scenarios to dynamically set properties based on data or iteration.
Error Handling with Matplotlib.pyplot.setp()
When using Matplotlib.pyplot.setp(), it’s important to handle potential errors, especially when setting properties that may not be valid for all artists. Here’s an example that demonstrates error handling:
import matplotlib.pyplot as plt
import numpy as np

x = np.linspace(0, 10, 100)
y = np.sin(x)

fig, ax = plt.subplots()
line, = ax.plot(x, y)

try:
    plt.setp(line, color='red', linewidth=2, invalid_property='value')
except AttributeError as e:
    print(f"AttributeError: {e}")
    plt.setp(line, color='red', linewidth=2)

plt.title('Error Handling with Matplotlib.pyplot.setp() - how2matplotlib.com')
plt.show()
Output:
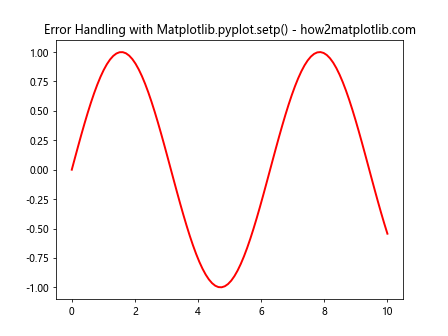
In this example, we attempt to set an invalid property (‘invalid_property’) along with valid properties. The try-except block catches the AttributeError that results from the invalid property and allows us to proceed with setting the valid properties. This demonstrates how to handle potential errors when using Matplotlib.pyplot.setp(), ensuring that your code remains robust even when dealing with potentially invalid property settings.
Using Matplotlib.pyplot.setp() with Custom Artists
Matplotlib.pyplot.setp() can also be used with custom artists that you create. This is particularly useful when you’re creating complex visualizationswith custom elements. Here’s an example that demonstrates this:
import matplotlib.pyplot as plt
import matplotlib.patches as patches

fig, ax = plt.subplots()

# Create a custom rectangle
rect = patches.Rectangle((0.2, 0.2), 0.6, 0.6, fill=False)
ax.add_patch(rect)

# Use setp to customize the rectangle
plt.setp(rect, linewidth=2, edgecolor='red', linestyle='--')

# Create a custom circle
circle = patches.Circle((0.5, 0.5), 0.3, fill=False)
ax.add_patch(circle)

# Use setp to customize the circle
plt.setp(circle, linewidth=2, edgecolor='blue', linestyle=':')

ax.set_xlim(0, 1)
ax.set_ylim(0, 1)

plt.title('Custom Artists with Matplotlib.pyplot.setp() - how2matplotlib.com')
plt.show()
Output:
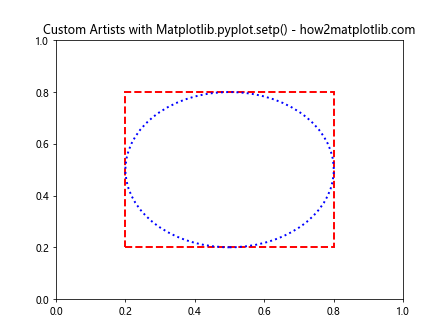
In this example, we create custom rectangle and circle patches and add them to the plot. We then use Matplotlib.pyplot.setp() to customize their appearance. This demonstrates how Matplotlib.pyplot.setp() can be used with custom artists to achieve precise control over their properties.
Performance Considerations with Matplotlib.pyplot.setp()
While Matplotlib.pyplot.setp() is a powerful and convenient function, it’s worth noting that for very large numbers of artists or properties, it may be slightly slower than setting properties directly. However, for most use cases, the difference is negligible, and the readability and convenience of Matplotlib.pyplot.setp() often outweigh any minor performance considerations.
Here’s an example that sets properties both directly and using Matplotlib.pyplot.setp():
import matplotlib.pyplot as plt
import numpy as np

x = np.linspace(0, 10, 100)
y = np.sin(x)

fig, (ax1, ax2) = plt.subplots(1, 2, figsize=(12, 5))

# Setting properties directly
line1, = ax1.plot(x, y)
line1.set_color('red')
line1.set_linewidth(2)
line1.set_linestyle('--')
ax1.set_title('Direct Property Setting')

# Setting properties with setp
line2, = ax2.plot(x, y)
plt.setp(line2, color='red', linewidth=2, linestyle='--')
ax2.set_title('Property Setting with setp')

plt.suptitle('Performance Comparison - how2matplotlib.com')
plt.show()
Output:
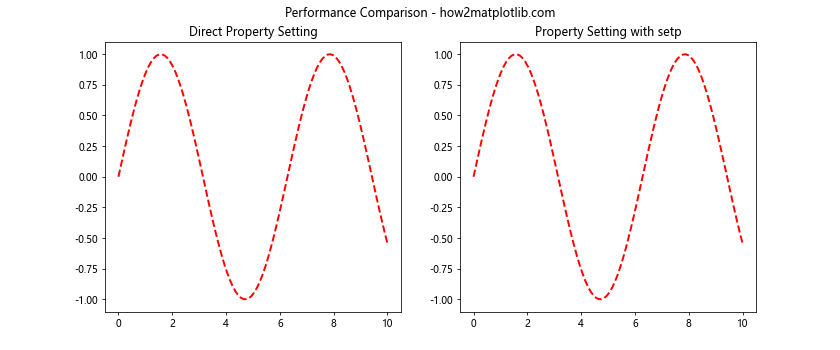
In this example, we set the same properties for two lines, one using direct property setting and the other using Matplotlib.pyplot.setp(). The visual result is identical, and for most applications, the performance difference is negligible.
Combining Matplotlib.pyplot.setp() with Other Matplotlib Functions
Matplotlib.pyplot.setp() can be effectively combined with other Matplotlib functions to create complex and highly customized plots. Here’s an example that demonstrates this:
import matplotlib.pyplot as plt
import numpy as np

x = np.linspace(0, 10, 100)
y1 = np.sin(x)
y2 = np.cos(x)

fig, ax = plt.subplots()

line1, = ax.plot(x, y1, label='sin(x)')
line2, = ax.plot(x, y2, label='cos(x)')

plt.setp([line1, line2], linewidth=2)
plt.setp(line1, color='red', linestyle='-')
plt.setp(line2, color='blue', linestyle='--')

ax.fill_between(x, y1, y2, alpha=0.3)
plt.setp(ax.collections, facecolor='lightgreen')

ax.set_xlabel('X-axis')
ax.set_ylabel('Y-axis')
ax.set_title('Combined Plot')
ax.legend()

plt.setp(ax.get_legend().get_texts(), fontsize=12)
plt.setp(ax.get_xticklabels(), rotation=45, ha='right')

plt.title('Combining Functions with Matplotlib.pyplot.setp() - how2matplotlib.com')
plt.tight_layout()
plt.show()
Output:
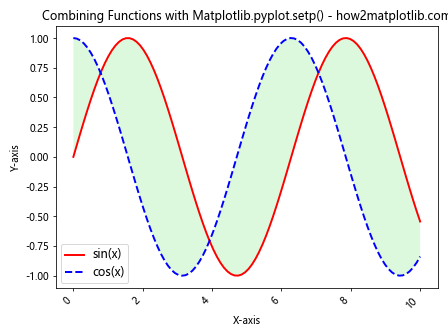
In this example, we combine Matplotlib.pyplot.setp() with other Matplotlib functions like fill_between(), set_xlabel(), set_ylabel(), and legend(). We use Matplotlib.pyplot.setp() to customize the appearance of lines, the filled area, legend text, and x-axis tick labels. This demonstrates how Matplotlib.pyplot.setp() can be seamlessly integrated with other Matplotlib functions to create complex, highly customized plots.
Best Practices for Using Matplotlib.pyplot.setp()
When working with Matplotlib.pyplot.setp(), there are several best practices to keep in mind:
- Group related property settings: When setting multiple properties for the same artist or group of artists, try to do it in a single Matplotlib.pyplot.setp() call. This improves readability and can be more efficient.
Use for consistency: Matplotlib.pyplot.setp() is particularly useful when you want to apply the same properties to multiple artists. Use it to ensure consistency across your plot elements.
Leverage its flexibility: Remember that Matplotlib.pyplot.setp() can work with individual artists, lists of artists, or even all artists of a certain type in an axes or figure.
Combine with direct property setting: While Matplotlib.pyplot.setp() is powerful, sometimes directly setting a property (e.g.,
line.set_color('red')) can be more intuitive. Don’t hesitate to use a mix of both approaches.Use for dynamic property setting: Matplotlib.pyplot.setp() is excellent for setting properties dynamically based on data or in loops.
Handle errors: When setting properties that might not be valid for all artists, use try-except blocks to handle potential AttributeErrors.
Here’s an example that incorporates some of these best practices: