Matplotlib Plot Title
The Matplotlib library is a powerful tool for creating visually appealing plots and visualizations in Python. One important aspect of any plot is the title, which provides a brief description or explanation of the data being presented. In this article, we will explore various ways to set the title of a plot using Matplotlib.
Setting a Static Plot Title in Matplotlib
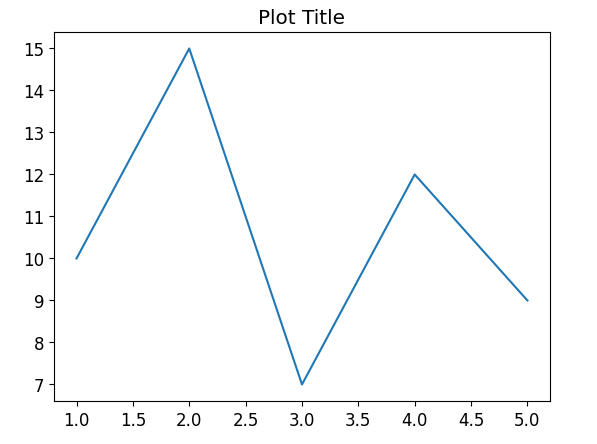
The simplest way to set a plot title is to use the title function provided by Matplotlib. This function takes a string as an argument and sets it as the title of the plot.
Here’s an example that demonstrates setting a static plot title:
import matplotlib.pyplot as plt

# Data
x = [1, 2, 3, 4, 5]
y = [10, 15, 7, 12, 9]

# Plotting
plt.plot(x, y)

# Setting the title
plt.title("Plot Title")

# Display the plot
plt.show()
Output:
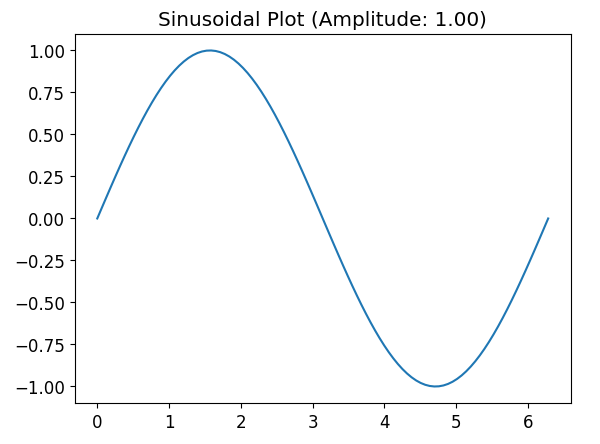
Dynamically Setting the Plot Title in Matplotlib
Sometimes, we may want to dynamically set the title based on some variable or calculation. Matplotlib allows us to achieve this by using string formatting or concatenation to construct the title string.
import matplotlib.pyplot as plt
import numpy as np

# Data
x = np.linspace(0, 2 * np.pi, 100)
y = np.sin(x)

# Plotting
plt.plot(x, y)

# Dynamically setting the title
amplitude = np.max(y)
plt.title(f"Sinusoidal Plot (Amplitude: {amplitude:.2f})")

# Display the plot
plt.show()
Output:
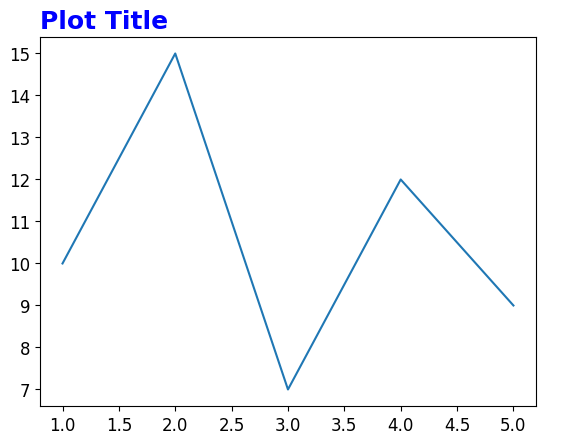
Customizing the Title Appearance in Matplotlib
Matplotlib provides various parameters that allow us to customize the appearance of the plot title. These parameters include the font size, font weight, font color, and alignment.
Here’s an example of customizing the title appearance:
import matplotlib.pyplot as plt

# Data
x = [1, 2, 3, 4, 5]
y = [10, 15, 7, 12, 9]

# Plotting
plt.plot(x, y)

# Customizing the title appearance
plt.title("Plot Title", fontsize=18, fontweight="bold", color="blue", loc="left")

# Display the plot
plt.show()
Output:
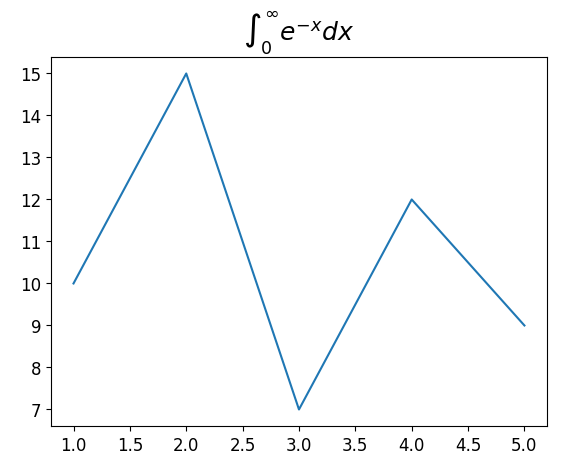
Using LaTeX in Plot Titles in Matplotlib
Matplotlib also supports the use of LaTeX expressions in plot titles. This allows us to create more complex mathematical expressions or symbols as part of the title.
import matplotlib.pyplot as plt

# Data
x = [1, 2, 3, 4, 5]
y = [10, 15, 7, 12, 9]

# Plotting
plt.plot(x, y)

# Using LaTeX in plot title
plt.title(r"$\int_{0}^{\infty} e^{-x} dx$", fontsize=18)

# Display the plot
plt.show()
Output:
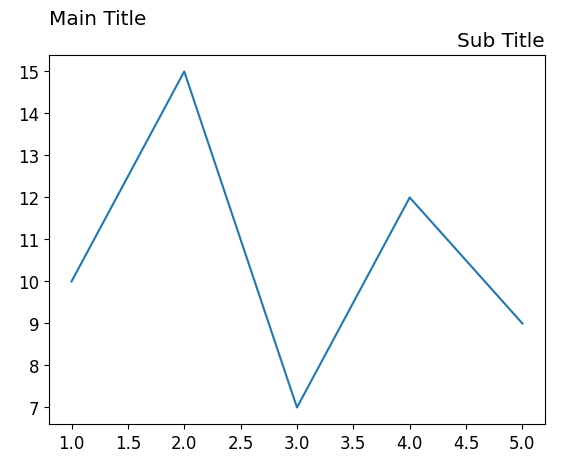
Setting Multiple Titles
In some cases, we may want to set multiple titles for different parts of a plot. Matplotlib allows us to do this by manipulating the positions of title components using the set_title function and specifying the loc parameter.
import matplotlib.pyplot as plt

# Data
x = [1, 2, 3, 4, 5]
y = [10, 15, 7, 12, 9]

# Plotting
plt.plot(x, y)

# Setting multiple titles
plt.title("Main Title\n", loc="left")
plt.title("Sub Title", loc="right")

# Display the plot
plt.show()
Output:
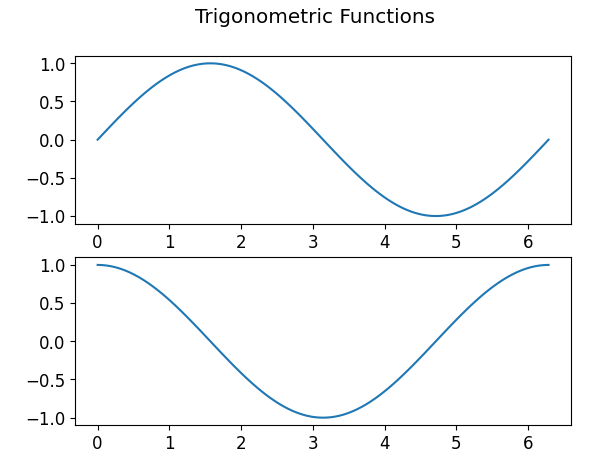
Plot Title in a Grid of Subplots
When working with a grid of subplots, we can set a common title for all the subplots using the suptitle function. This function sets a title for the entire figure rather than individual subplots.
Here’s an example of setting a common title in a grid of subplots:
import matplotlib.pyplot as plt
import numpy as np

# Data
x = np.linspace(0, 2 * np.pi, 100)
y1 = np.sin(x)
y2 = np.cos(x)

# Creating a grid of subplots
fig, axs = plt.subplots(2)

# Plotting the data
axs[0].plot(x, y1)
axs[1].plot(x, y2)

# Setting a common title for all subplots
plt.suptitle("Trigonometric Functions")

# Display the subplots
plt.show()
Output:
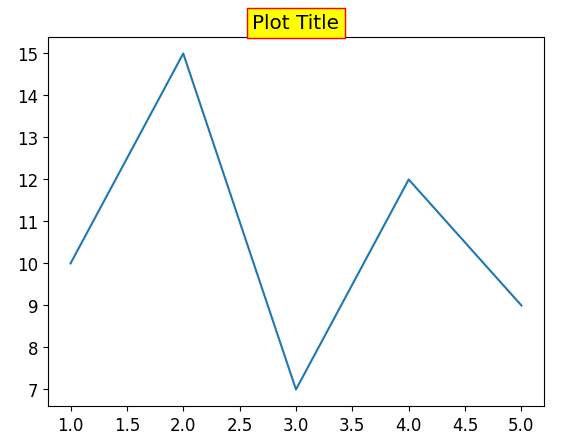
Plot Title with a Background Color
Matplotlib allows us to set a background color for the plot title using the bbox parameter. This parameter accepts a dictionary with various properties such as facecolor, edgecolor, and linewidth, among others.
import matplotlib.pyplot as plt

# Data
x = [1, 2, 3, 4, 5]
y = [10, 15, 7, 12, 9]

# Plotting
plt.plot(x, y)

# Plot title with a background color
plt.title("Plot Title", bbox={"facecolor": "yellow", "edgecolor": "red", "linewidth": 1})

# Display the plot
plt.show()
Output:
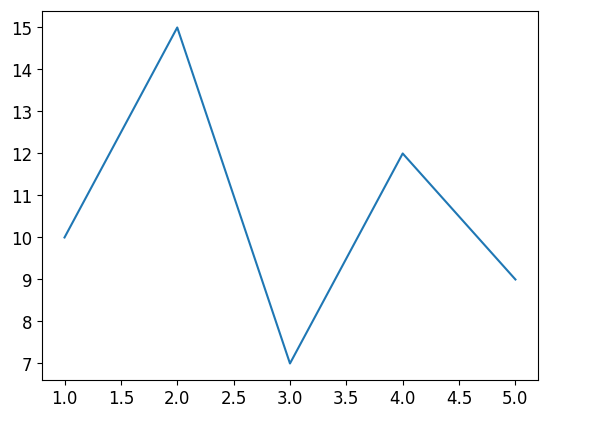
Removing the Plot Title
If we decide to remove the plot title altogether, we can simply call the title function with an empty string as the argument.
import matplotlib.pyplot as plt

# Data
x = [1, 2, 3, 4, 5]
y = [10, 15, 7, 12, 9]

# Plotting
plt.plot(x, y)

# Removing the plot title
plt.title("")

# Display the plot
plt.show()
Output:
Matplotlib Plot Title Conclusion
In this article, we explored various techniques for setting and customizing the plot title in Matplotlib. From static titles to dynamically calculated titles, customizing appearance, using LaTeX expressions, and setting multiple titles, Matplotlib offers a wide range of options to make your plot titles informative and visually appealing. Understanding these techniques will allow you to effectively communicate the purpose and content of your plots to your audience.