How to Place Matplotlib Legend Outside the Plot: A Comprehensive Guide
Matplotlib legend outside is a crucial technique for creating clear and informative visualizations. By placing the legend outside the plot area, you can maximize the space available for your data while still providing essential information about the different elements in your graph. This article will explore various methods and best practices for positioning your matplotlib legend outside the plot, along with numerous examples to help you master this important skill.
Understanding the Importance of Matplotlib Legend Outside
When working with matplotlib, the legend is an essential component that helps viewers interpret the data presented in your plots. However, sometimes the default legend placement can obscure important parts of your visualization. This is where the technique of placing the matplotlib legend outside the plot becomes invaluable.
By moving the legend outside, you can:
- Maximize the visible area for your data
- Improve the overall readability of your plot
- Accommodate longer legend labels without compromising the plot’s clarity
- Create a more professional and polished look for your visualizations
Let’s start with a basic example of how to place a matplotlib legend outside the plot:
import matplotlib.pyplot as plt

# Data for the plot
x = [1, 2, 3, 4, 5]
y1 = [2, 4, 6, 8, 10]
y2 = [1, 3, 5, 7, 9]

# Create the plot
plt.figure(figsize=(10, 6))
plt.plot(x, y1, label='Line 1 - how2matplotlib.com')
plt.plot(x, y2, label='Line 2 - how2matplotlib.com')

# Place the legend outside the plot
plt.legend(bbox_to_anchor=(1.05, 1), loc='upper left')

# Adjust the layout to prevent the legend from being cut off
plt.tight_layout()

# Show the plot
plt.show()
Output:
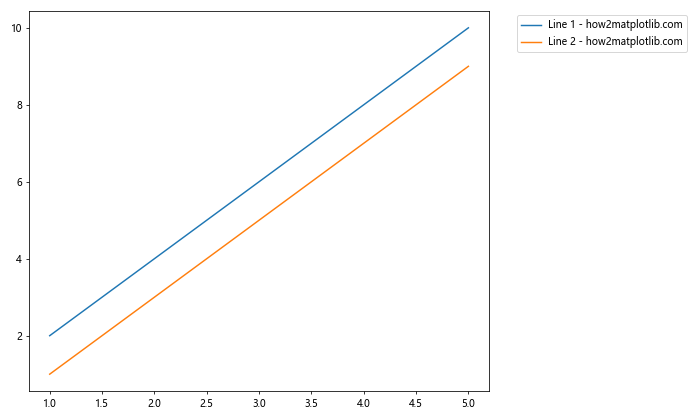
In this example, we use the bbox_to_anchor parameter to position the legend outside the plot area. The loc parameter specifies the alignment of the legend relative to the anchor point.
Exploring Different Positions for Matplotlib Legend Outside
There are several options for placing your matplotlib legend outside the plot. Let’s explore some common positions:
Right Side of the Plot
Placing the matplotlib legend outside on the right side of the plot is a popular choice:
import matplotlib.pyplot as plt

# Data for the plot
categories = ['A', 'B', 'C', 'D', 'E']
values1 = [10, 15, 7, 12, 9]
values2 = [8, 16, 5, 11, 13]

# Create the plot
plt.figure(figsize=(12, 6))
plt.bar(categories, values1, label='Series 1 - how2matplotlib.com')
plt.bar(categories, values2, bottom=values1, label='Series 2 - how2matplotlib.com')

# Place the legend outside on the right
plt.legend(bbox_to_anchor=(1.05, 1), loc='upper left')

# Adjust the layout
plt.tight_layout()

# Show the plot
plt.show()
Output:

This example demonstrates how to place the matplotlib legend outside for a stacked bar chart. The legend is positioned to the right of the plot, making it easy to read without interfering with the data visualization.
Below the Plot
Another option is to place the matplotlib legend outside below the plot:
import matplotlib.pyplot as plt
import numpy as np

# Generate data
x = np.linspace(0, 10, 100)
y1 = np.sin(x)
y2 = np.cos(x)
y3 = np.tan(x)

# Create the plot
plt.figure(figsize=(10, 8))
plt.plot(x, y1, label='sin(x) - how2matplotlib.com')
plt.plot(x, y2, label='cos(x) - how2matplotlib.com')
plt.plot(x, y3, label='tan(x) - how2matplotlib.com')

# Place the legend outside below the plot
plt.legend(bbox_to_anchor=(0.5, -0.15), loc='upper center', ncol=3)

# Adjust the layout
plt.tight_layout()

# Show the plot
plt.show()
Output:
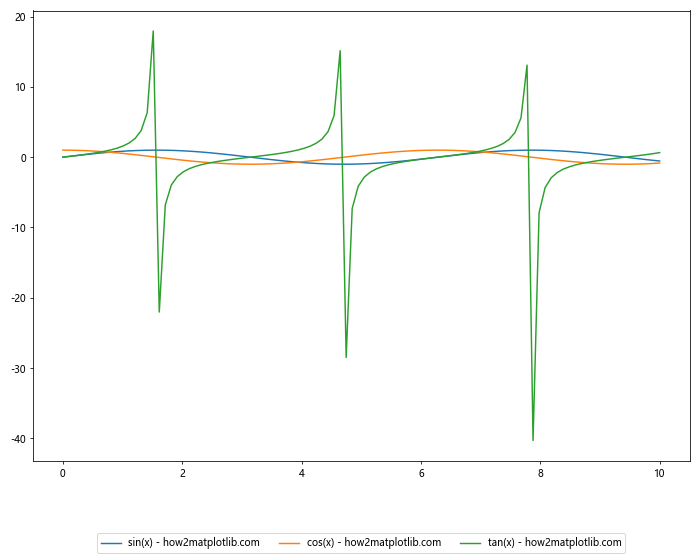
In this example, we place the matplotlib legend outside below the plot and center it horizontally. The ncol parameter is used to arrange the legend items in three columns, creating a more compact layout.
Above the Plot
Placing the matplotlib legend outside above the plot can be useful in certain situations:
import matplotlib.pyplot as plt
import numpy as np

# Generate data
categories = ['Category A', 'Category B', 'Category C', 'Category D']
values = [25, 40, 30, 35]

# Create the plot
plt.figure(figsize=(10, 8))
plt.pie(values, labels=categories, autopct='%1.1f%%')

# Place the legend outside above the plot
plt.legend(title='Categories - how2matplotlib.com', bbox_to_anchor=(0.5, 1.15), loc='upper center', ncol=2)

# Adjust the layout
plt.tight_layout()

# Show the plot
plt.show()
Output:

This example shows how to place the matplotlib legend outside above a pie chart. The legend is centered and split into two columns for better readability.
Customizing the Appearance of Matplotlib Legend Outside
When placing your matplotlib legend outside the plot, you may want to customize its appearance to better match your visualization style. Let’s explore some customization options:
Changing the Legend Box Style
You can modify the appearance of the legend box when placing the matplotlib legend outside:
import matplotlib.pyplot as plt

# Data for the plot
x = [1, 2, 3, 4, 5]
y1 = [2, 4, 6, 8, 10]
y2 = [1, 3, 5, 7, 9]

# Create the plot
plt.figure(figsize=(10, 6))
plt.plot(x, y1, label='Line 1 - how2matplotlib.com')
plt.plot(x, y2, label='Line 2 - how2matplotlib.com')

# Place the legend outside with custom box style
plt.legend(bbox_to_anchor=(1.05, 1), loc='upper left',
           fancybox=True, shadow=True, borderpad=1)

# Adjust the layout
plt.tight_layout()

# Show the plot
plt.show()
Output:
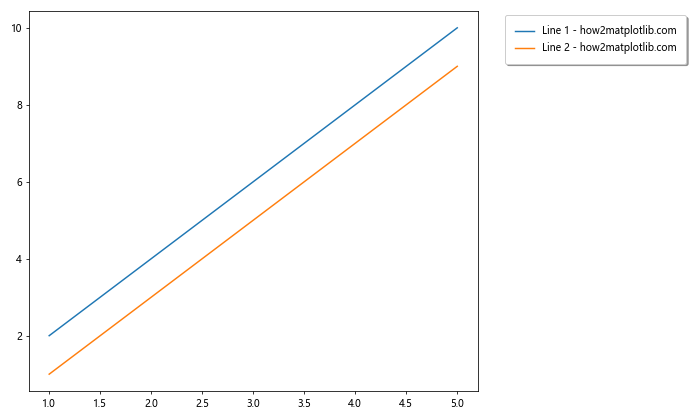
In this example, we use fancybox=True to create rounded corners, shadow=True to add a shadow effect, and borderpad=1 to increase the padding inside the legend box.
Handling Multiple Legends with Matplotlib Legend Outside
Sometimes you may need to include multiple legends in your plot. Here’s how you can handle this scenario:
import matplotlib.pyplot as plt

# Data for the plot
x = [1, 2, 3, 4, 5]
y1 = [2, 4, 6, 8, 10]
y2 = [1, 3, 5, 7, 9]
y3 = [5, 4, 3, 2, 1]

# Create the plot
fig, ax = plt.subplots(figsize=(12, 6))

# Plot the data
line1 = ax.plot(x, y1, label='Line 1 - how2matplotlib.com')
line2 = ax.plot(x, y2, label='Line 2 - how2matplotlib.com')
line3 = ax.plot(x, y3, label='Line 3 - how2matplotlib.com')

# Create the first legend
legend1 = ax.legend(handles=[line1[0], line2[0]], bbox_to_anchor=(1.05, 1), loc='upper left', title='Legend 1')

# Add the first legend to the plot
ax.add_artist(legend1)

# Create the second legend
ax.legend(handles=[line3[0]], bbox_to_anchor=(1.05, 0.6), loc='center left', title='Legend 2')

# Adjust the layout
plt.tight_layout()

# Show the plot
plt.show()
Output:
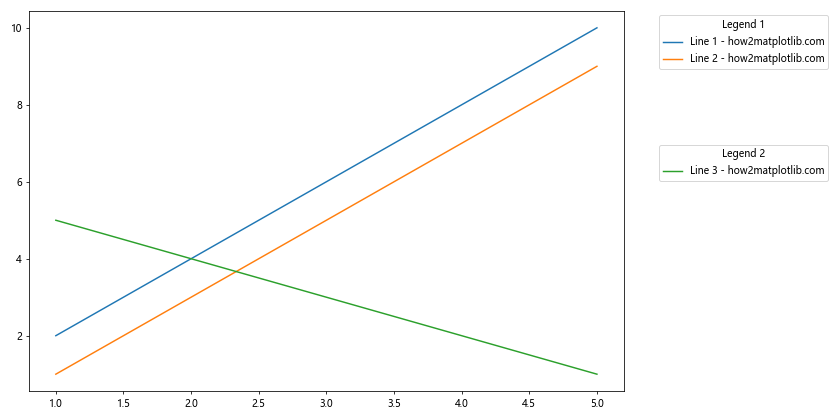
This example shows how to create and position multiple legends when using matplotlib legend outside. We use add_artist() to ensure both legends are displayed.
Matplotlib Legend Outside in Subplots
When working with subplots, you may want to place a single legend outside that covers all subplots. Here’s how you can achieve this:
import matplotlib.pyplot as plt
import numpy as np

# Generate data
x = np.linspace(0, 10, 100)
y1 = np.sin(x)
y2 = np.cos(x)

# Create the subplots
fig, (ax1, ax2) = plt.subplots(2, 1, figsize=(10, 8))

# Plot data on the first subplot
line1 = ax1.plot(x, y1, label='sin(x) - how2matplotlib.com')
line2 = ax1.plot(x, y2, label='cos(x) - how2matplotlib.com')

# Plot data on the second subplot
ax2.plot(x, y1**2, label='sin²(x) - how2matplotlib.com')
ax2.plot(x, y2**2, label='cos²(x) - how2matplotlib.com')

# Collect all line objects
lines = line1 + line2 + ax2.get_lines()

# Place a single legend outside for both subplots
fig.legend(lines, [l.get_label() for l in lines],
           bbox_to_anchor=(1.05, 0.5), loc='center left')

# Adjust the layout
plt.tight_layout()

# Show the plot
plt.show()
Output:
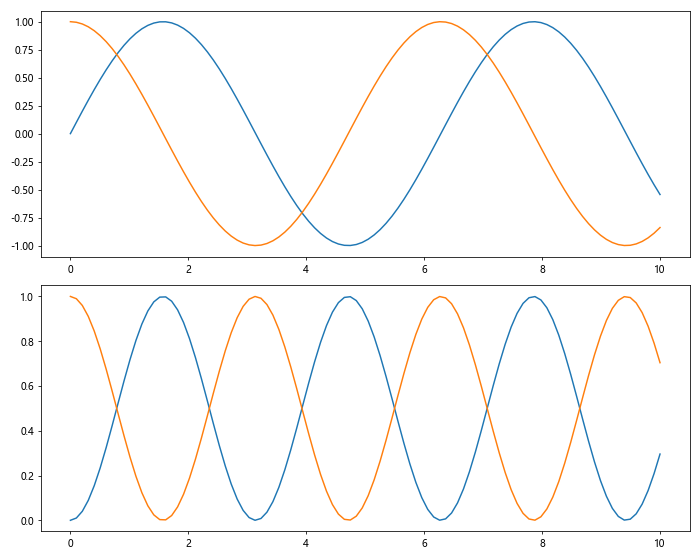
This example demonstrates how to create a single matplotlib legend outside that covers multiple subplots.
Using Matplotlib Legend Outside with Different Plot Types
The technique of placing the matplotlib legend outside can be applied to various types of plots. Let’s explore some examples:
Scatter Plot with Matplotlib Legend Outside
import matplotlib.pyplot as plt
import numpy as np

# Generate data
np.random.seed(42)
x = np.random.rand(50)
y1 = x + np.random.normal(0, 0.1, 50)
y2 = x + 0.5 + np.random.normal(0, 0.1, 50)

# Create the plot
plt.figure(figsize=(10, 6))
plt.scatter(x, y1, label='Group A - how2matplotlib.com')
plt.scatter(x, y2, label='Group B - how2matplotlib.com')

# Place the legend outside
plt.legend(bbox_to_anchor=(1.05, 1), loc='upper left')

# Adjust the layout
plt.tight_layout()

# Show the plot
plt.show()
Output:
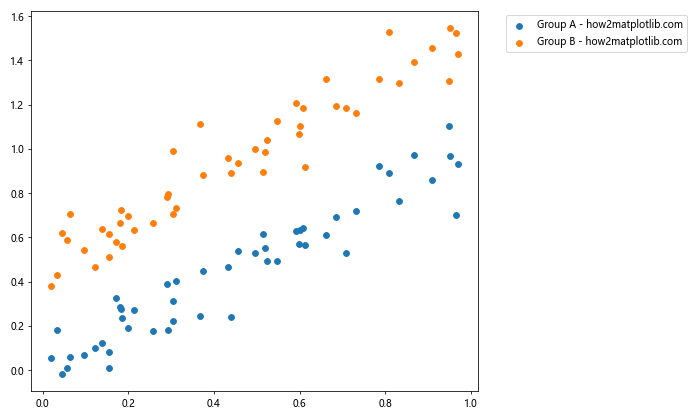
This example shows how to place the matplotlib legend outside for a scatter plot, which is useful when dealing with multiple data series.
Histogram with Matplotlib Legend Outside
import matplotlib.pyplot as plt
import numpy as np

# Generate data
np.random.seed(42)
data1 = np.random.normal(0, 1, 1000)
data2 = np.random.normal(2, 1, 1000)

# Create the plot
plt.figure(figsize=(10, 6))
plt.hist(data1, bins=30, alpha=0.7, label='Distribution 1 - how2matplotlib.com')
plt.hist(data2, bins=30, alpha=0.7, label='Distribution 2 - how2matplotlib.com')

# Place the legend outside
plt.legend(bbox_to_anchor=(1.05, 1), loc='upper left')

# Adjust the layout
plt.tight_layout()

# Show the plot
plt.show()
Output:
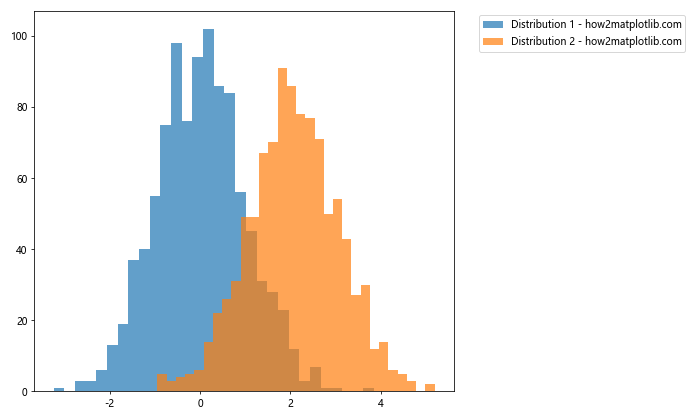
This example demonstrates how to use matplotlib legend outside with a histogram, which is particularly useful when comparing multiple distributions.
Advanced Techniques for Matplotlib Legend Outside
Let’s explore some advanced techniques for placing and customizing your matplotlib legend outside the plot:
Using a Custom Legend Handler
You can create custom legend handlers to represent your data in unique ways:
import matplotlib.pyplot as plt
import matplotlib.patches as mpatches

class CustomHandler:
    def legend_artist(self, legend, orig_handle, fontsize, handlebox):
        x0, y0 = handlebox.xdescent, handlebox.ydescent
        width, height = handlebox.width, handlebox.height
        patch = mpatches.Rectangle([x0, y0], width, height, facecolor='lightblue',
                                   edgecolor='black', hatch='///', label='_nolegend_')
        handlebox.add_artist(patch)
        return patch

# Create the plot
plt.figure(figsize=(10, 6))
plt.plot([1, 2, 3], [1, 2, 3], label='Custom Legend - how2matplotlib.com')

# Place the legend outside with a custom handler
plt.legend(handler_map={plt.Line2D: CustomHandler()},
           bbox_to_anchor=(1.05, 1), loc='upper left')

# Adjust the layout
plt.tight_layout()

# Show the plot
plt.show()
Output:
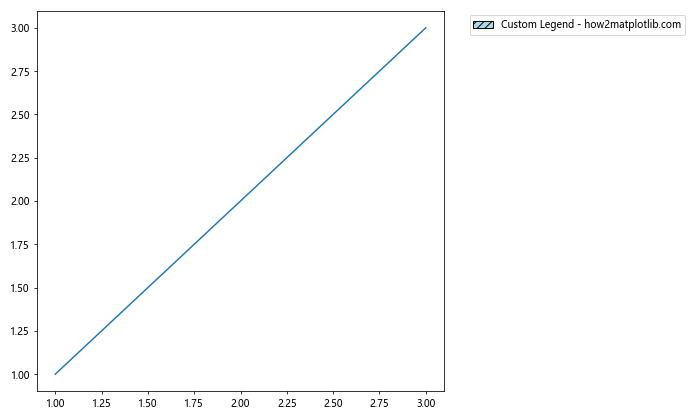
This example shows how to create a custom legend handler that represents line plots with a hatched rectangle.
Dynamically Adjusting Figure Size for Matplotlib Legend Outside
When placing the matplotlib legend outside, you may need to adjust the figure size dynamically to accommodate the legend:
import matplotlib.pyplot as plt

def adjust_figure_size(fig, ax, legend):
    # Get the bounding box of the legend
    bbox = legend.get_window_extent(fig.canvas.get_renderer())
    # Transform from pixels to figure coordinates
    bbox = bbox.transformed(fig.transFigure.inverted())

    # Adjust the figure size
    fig.set_size_inches(fig.get_size_inches()[0] * (1 + bbox.width), fig.get_size_inches()[1])

    # Adjust the axes position
    ax.set_position([ax.get_position().x0 / (1 + bbox.width),
                     ax.get_position().y0,
                     ax.get_position().width / (1 + bbox.width),
                     ax.get_position().height])

# Create the plot
fig, ax = plt.subplots(figsize=(8, 6))
ax.plot([1, 2, 3], [1, 2, 3], label='Line 1 - how2matplotlib.com')
ax.plot([1, 2, 3], [2, 3, 4], label='Line 2 - how2matplotlib.com')

# Place the legend outside
legend = ax.legend(bbox_to_anchor=(1.05, 1), loc='upper left')

# Adjust the figure size
adjust_figure_size(fig, ax, legend)

# Show the plot
plt.show()
Output:
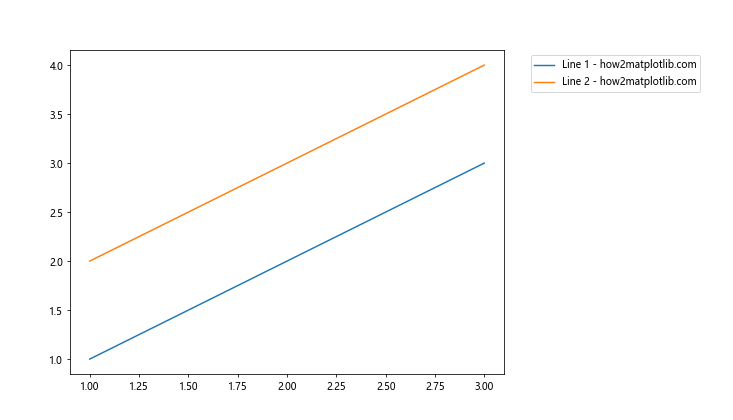
This example demonstrates how to dynamically adjust the figure size to accommodate the matplotlib legend outside without cutting it off.
Best Practices for Using Matplotlib Legend Outside
When working with matplotlib legend outside, consider the following best practices:
- Consistency: Maintain a consistent legend position across all plots in your project for a professional look.
Readability: Ensure2. Readability: Ensure that the legend text is easily readable by adjusting font size and style as needed.
Color contrast: Use colors that provide good contrast between the legend text and background.
Avoid overcrowding: If you have many items in your legend, consider using multiple columns or grouping similar items.
Use descriptive labels: Make sure your legend labels are clear and informative.
Test different positions: Experiment with different legend positions to find the best fit for your specific plot.
Consider the overall layout: Ensure that the legend doesn’t interfere with other plot elements or annotations.
Let’s look at an example that incorporates these best practices: