How to Master Matplotlib Legend Position: A Comprehensive Guide
Matplotlib legend position is a crucial aspect of data visualization that can significantly enhance the readability and interpretation of your plots. In this comprehensive guide, we’ll explore various techniques and best practices for positioning legends in Matplotlib, providing you with the knowledge and tools to create professional-looking visualizations. From basic legend placement to advanced customization options, we’ll cover everything you need to know about matplotlib legend position.
Understanding the Importance of Matplotlib Legend Position
Matplotlib legend position plays a vital role in creating clear and informative visualizations. A well-placed legend can help viewers quickly understand the different elements in your plot, making it easier to interpret the data. On the other hand, a poorly positioned legend can obscure important data points or make the plot cluttered and difficult to read.
When working with matplotlib legend position, it’s essential to consider factors such as:
- The overall layout of your plot
- The density of data points
- The number of elements in your legend
- The size and aspect ratio of your figure
By carefully considering these factors and applying the techniques we’ll discuss in this guide, you can optimize your matplotlib legend position for maximum clarity and impact.
Basic Matplotlib Legend Position Techniques
Let’s start by exploring some basic techniques for controlling matplotlib legend position. These methods will give you a solid foundation for working with legends in your plots.
Using the loc Parameter
The simplest way to control matplotlib legend position is by using the loc parameter in the legend() function. This parameter accepts various string values or numerical codes to specify the legend’s location.
Here’s a basic example:
import matplotlib.pyplot as plt

plt.figure(figsize=(8, 6))
plt.plot([1, 2, 3, 4], [1, 4, 2, 3], label='Line 1')
plt.plot([1, 2, 3, 4], [2, 3, 4, 1], label='Line 2')
plt.title('Basic Matplotlib Legend Position Example - how2matplotlib.com')
plt.legend(loc='upper right')
plt.show()
Output:
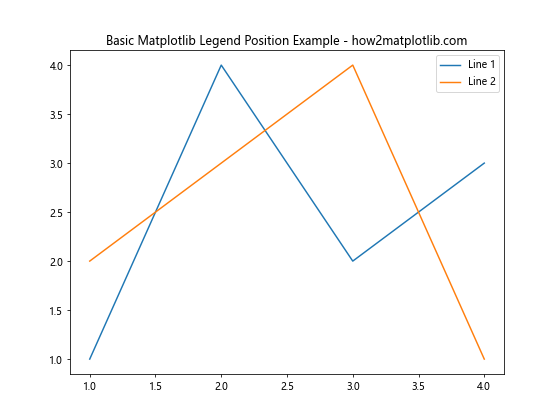
In this example, we’ve set the matplotlib legend position to the upper right corner of the plot using loc='upper right'. This is one of the most common legend positions, as it typically doesn’t interfere with the data points in the plot.
Common loc Values for Matplotlib Legend Position
Here are some commonly used loc values for controlling matplotlib legend position:
'best': Automatically chooses the best location'upper right': Top-right corner'upper left': Top-left corner'lower right': Bottom-right corner'lower left': Bottom-left corner'center': Center of the plot'center left': Center-left edge'center right': Center-right edge'lower center': Bottom-center edge'upper center': Top-center edge
Let’s create an example that demonstrates these different matplotlib legend position options:
import matplotlib.pyplot as plt

fig, axs = plt.subplots(3, 3, figsize=(15, 15))
locations = ['best', 'upper right', 'upper left', 'lower right', 'lower left', 'center', 'center left', 'center right', 'lower center']

for i, ax in enumerate(axs.flat):
    ax.plot([1, 2, 3, 4], [1, 4, 2, 3], label='Line 1')
    ax.plot([1, 2, 3, 4], [2, 3, 4, 1], label='Line 2')
    ax.set_title(f"Legend loc='{locations[i]}' - how2matplotlib.com")
    ax.legend(loc=locations[i])

plt.tight_layout()
plt.show()
Output:
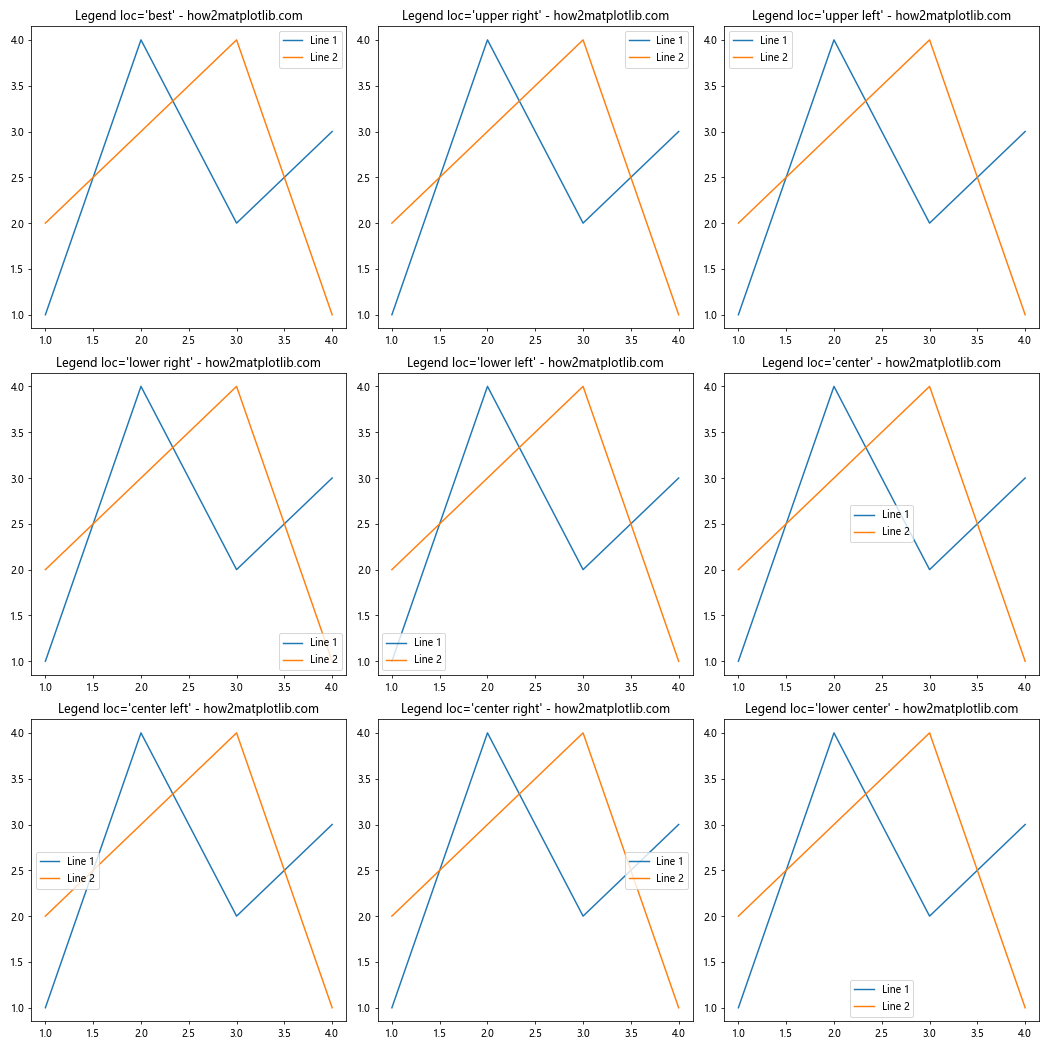
This example creates a 3×3 grid of subplots, each demonstrating a different matplotlib legend position using the loc parameter. This visual comparison can help you choose the most appropriate position for your specific plot.
Advanced Matplotlib Legend Position Techniques
While the basic loc parameter is sufficient for many use cases, there are times when you need more precise control over your matplotlib legend position. Let’s explore some advanced techniques for fine-tuning legend placement.
Using Numerical Values for Precise Positioning
Instead of using string values, you can use numerical values to specify the matplotlib legend position. This method allows for more precise control over the legend’s location.
The numerical values are specified as a tuple of two floats, where (0, 0) represents the lower-left corner of the plot, and (1, 1) represents the upper-right corner.
Here’s an example demonstrating this technique:
import matplotlib.pyplot as plt

plt.figure(figsize=(8, 6))
plt.plot([1, 2, 3, 4], [1, 4, 2, 3], label='Line 1')
plt.plot([1, 2, 3, 4], [2, 3, 4, 1], label='Line 2')
plt.title('Precise Matplotlib Legend Position - how2matplotlib.com')
plt.legend(loc=(0.7, 0.5))  # Position legend at (0.7, 0.5)
plt.show()
Output:
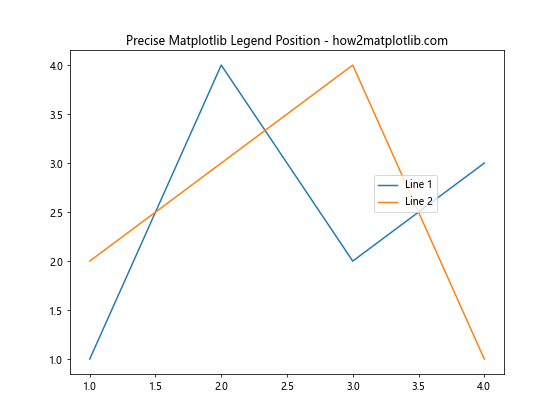
In this example, we’ve positioned the legend at (0.7, 0.5), which places it slightly to the right and vertically centered in the plot area.
Using the bbox_to_anchor Parameter
For even more control over matplotlib legend position, you can use the bbox_to_anchor parameter. This parameter allows you to specify the legend’s position relative to a specific point in the plot.
The bbox_to_anchor parameter takes a tuple of 2 to 4 floats:
- (x, y): The x and y coordinates of the anchor point
- (x, y, width, height): The x and y coordinates of the anchor point, along with the width and height of the bounding box
Here’s an example using bbox_to_anchor:
import matplotlib.pyplot as plt

plt.figure(figsize=(8, 6))
plt.plot([1, 2, 3, 4], [1, 4, 2, 3], label='Line 1')
plt.plot([1, 2, 3, 4], [2, 3, 4, 1], label='Line 2')
plt.title('Matplotlib Legend Position with bbox_to_anchor - how2matplotlib.com')
plt.legend(bbox_to_anchor=(1.05, 1), loc='upper left')
plt.tight_layout()
plt.show()
Output:
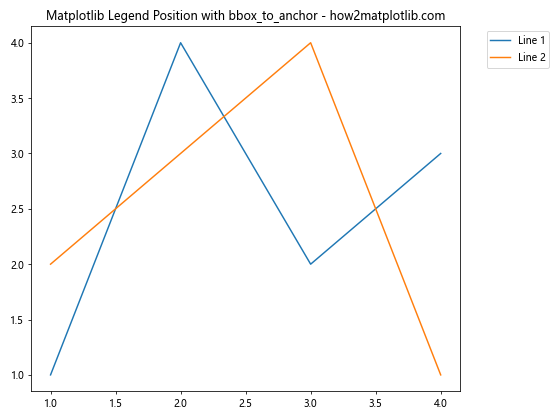
In this example, we’ve positioned the legend outside the plot area, to the right of the plot. The bbox_to_anchor parameter is set to (1.05, 1), which places the legend’s upper-left corner slightly to the right of the plot’s right edge.
Customizing Matplotlib Legend Position for Multiple Legends
Sometimes, you may need to include multiple legends in your plot. Matplotlib allows you to create and position multiple legends with ease. Let’s explore some techniques for working with multiple legends and controlling their positions.
Creating Multiple Legends
To create multiple legends in matplotlib, you can use the legend() function multiple times, specifying different handles and labels for each legend. Here’s an example:
import matplotlib.pyplot as plt

fig, ax = plt.subplots(figsize=(10, 6))

# Plot data
line1, = ax.plot([1, 2, 3, 4], [1, 4, 2, 3], label='Line 1')
line2, = ax.plot([1, 2, 3, 4], [2, 3, 4, 1], label='Line 2')
scatter1 = ax.scatter([1, 2, 3, 4], [3, 1, 4, 2], c='red', label='Scatter 1')
scatter2 = ax.scatter([1, 2, 3, 4], [4, 3, 2, 1], c='green', label='Scatter 2')

# Create first legend for lines
first_legend = ax.legend(handles=[line1, line2], loc='upper left', title='Lines')
ax.add_artist(first_legend)  # Add the first legend to the plot

# Create second legend for scatter plots
ax.legend(handles=[scatter1, scatter2], loc='lower right', title='Scatter')

plt.title('Multiple Legends with Different Positions - how2matplotlib.com')
plt.tight_layout()
plt.show()
Output:
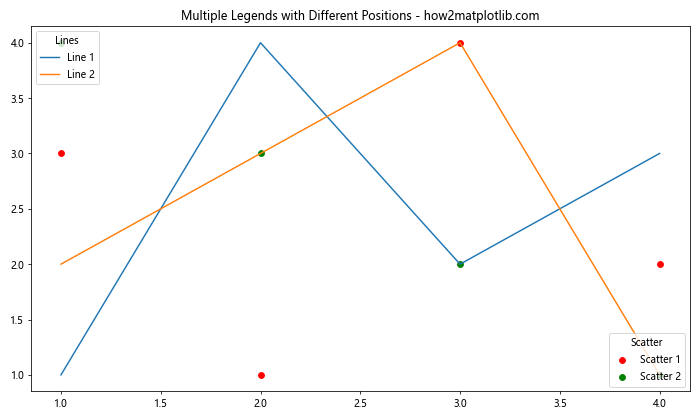
In this example, we’ve created two separate legends: one for the line plots and another for the scatter plots. We’ve positioned them in different locations using the loc parameter.
Positioning Multiple Legends
When working with multiple legends, you have the flexibility to position each legend independently. You can use any of the techniques we’ve discussed earlier, such as loc, numerical values, or bbox_to_anchor, for each legend.
Here’s an example that demonstrates positioning multiple legends using different techniques:
import matplotlib.pyplot as plt

fig, ax = plt.subplots(figsize=(10, 6))

# Plot data
line1, = ax.plot([1, 2, 3, 4], [1, 4, 2, 3], label='Line 1')
line2, = ax.plot([1, 2, 3, 4], [2, 3, 4, 1], label='Line 2')
scatter1 = ax.scatter([1, 2, 3, 4], [3, 1, 4, 2], c='red', label='Scatter 1')
scatter2 = ax.scatter([1, 2, 3, 4], [4, 3, 2, 1], c='green', label='Scatter 2')

# Create first legend for lines using bbox_to_anchor
first_legend = ax.legend(handles=[line1, line2], bbox_to_anchor=(1.05, 1), loc='upper left', title='Lines')
ax.add_artist(first_legend)

# Create second legend for scatter plots using numerical position
ax.legend(handles=[scatter1, scatter2], loc=(0.1, 0.1), title='Scatter')

plt.title('Multiple Legends with Different Positioning Techniques - how2matplotlib.com')
plt.tight_layout()
plt.show()
Output:
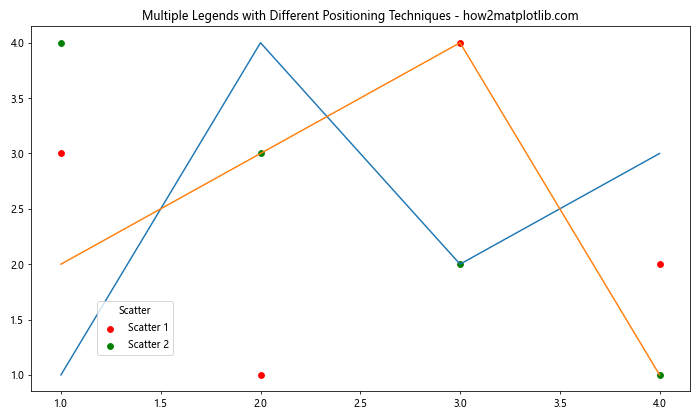
In this example, we’ve positioned the first legend outside the plot area using bbox_to_anchor, and the second legend using numerical values for precise positioning.
Adjusting Matplotlib Legend Position for Different Plot Types
Different types of plots may require different approaches to legend positioning. Let’s explore how to adjust matplotlib legend position for various common plot types.
Bar Plots
When working with bar plots, you may want to position the legend to avoid overlapping with the bars. Here’s an example of how to adjust the matplotlib legend position for a bar plot:
import matplotlib.pyplot as plt
import numpy as np

categories = ['A', 'B', 'C', 'D']
values1 = [4, 7, 3, 8]
values2 = [3, 6, 5, 7]

x = np.arange(len(categories))
width = 0.35

fig, ax = plt.subplots(figsize=(10, 6))
rects1 = ax.bar(x - width/2, values1, width, label='Group 1')
rects2 = ax.bar(x + width/2, values2, width, label='Group 2')

ax.set_ylabel('Values')
ax.set_title('Bar Plot with Adjusted Legend Position - how2matplotlib.com')
ax.set_xticks(x)
ax.set_xticklabels(categories)

ax.legend(loc='upper center', bbox_to_anchor=(0.5, -0.05), ncol=2)

plt.tight_layout()
plt.show()
Output:
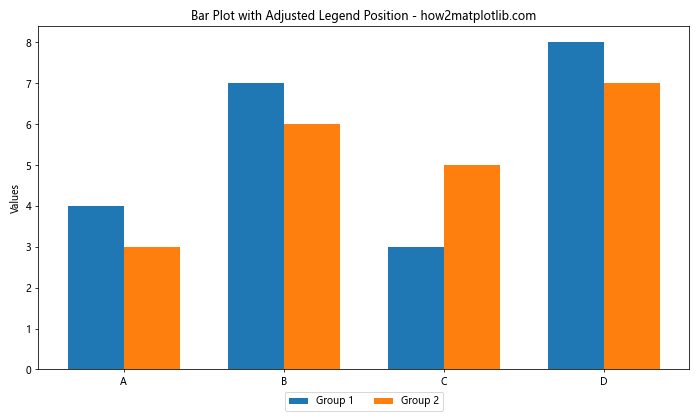
In this example, we’ve positioned the legend below the plot using bbox_to_anchor and set ncol=2 to arrange the legend items horizontally.
Pie Charts
For pie charts, you might want to position the legend outside the plot area to avoid cluttering the chart. Here’s an example:
import matplotlib.pyplot as plt

sizes = [30, 25, 20, 15, 10]
labels = ['A', 'B', 'C', 'D', 'E']
colors = ['#ff9999', '#66b3ff', '#99ff99', '#ffcc99', '#ff99cc']

fig, ax = plt.subplots(figsize=(10, 6))
ax.pie(sizes, labels=labels, colors=colors, autopct='%1.1f%%', startangle=90)
ax.axis('equal')

plt.title('Pie Chart with Legend Outside - how2matplotlib.com')
plt.legend(labels, title="Categories", loc="center left", bbox_to_anchor=(1, 0, 0.5, 1))

plt.tight_layout()
plt.show()
Output:
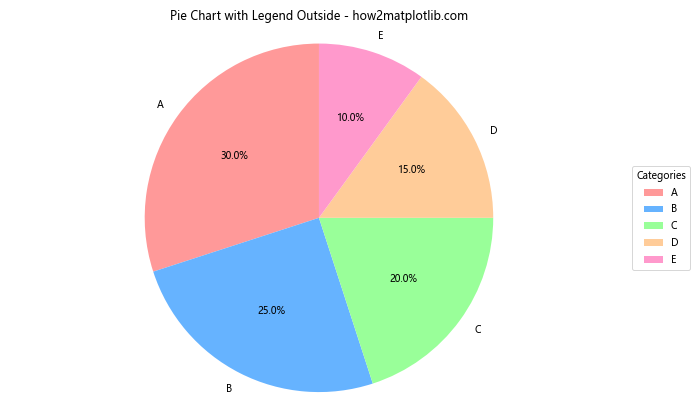
In this example, we’ve positioned the legend to the right of the pie chart using bbox_to_anchor.
Handling Matplotlib Legend Position in Subplots
When working with subplots, you may need to adjust the matplotlib legend position for each subplot individually or create a single legend for all subplots. Let’s explore both scenarios.
Individual Legends for Each Subplot
Here’s an example of how to position legends for individual subplots:
import matplotlib.pyplot as plt

fig, (ax1, ax2) = plt.subplots(1, 2, figsize=(12, 5))

# Subplot 1
ax1.plot([1, 2, 3, 4], [1, 4, 2, 3], label='Line 1')
ax1.plot([1, 2, 3, 4], [2, 3, 4, 1], label='Line 2')
ax1.set_title('Subplot 1 - how2matplotlib.com')
ax1.legend(loc='upper right')

# Subplot 2
ax2.scatter([1, 2, 3, 4], [3, 1, 4, 2], label='Scatter 1')
ax2.scatter([1, 2, 3, 4], [4, 3, 2, 1], label='Scatter 2')
ax2.set_title('Subplot 2 - how2matplotlib.com')
ax2.legend(loc='lower left')

plt.tight_layout()
plt.show()
Output:
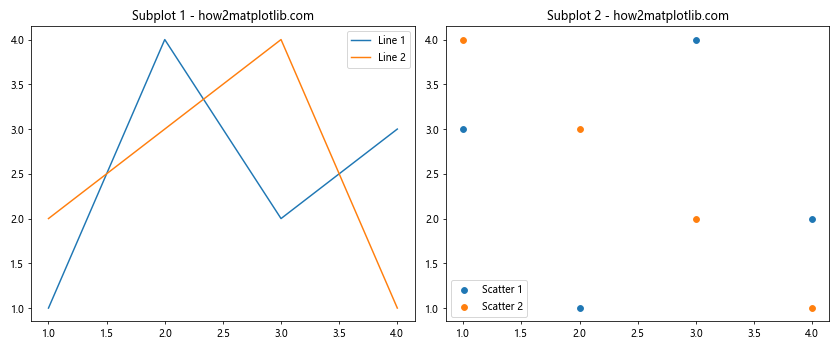
In this example, we’ve positioned the legend for each subplot independently using the loc parameter.
Single Legend for Multiple Subplots
Sometimes, you may want to create a single legend for all subplots. Here’s how you can achieve this:
import matplotlib.pyplot as plt

fig, (ax1, ax2) = plt.subplots(1, 2, figsize=(12, 5))

# Subplot 1
line1, = ax1.plot([1, 2, 3, 4], [1, 4, 2, 3], label='Line 1')
line2, = ax1.plot([1, 2, 3, 4], [2, 3, 4, 1], label='Line 2')
ax1.set_title('Subplot 1 - how2matplotlib.com')

# Subplot 2
scatter1 = ax2.scatter([1, 2, 3, 4], [3, 1, 4, 2], label='Scatter 1')
scatter2 = ax2.scatter([1, 2, 3, 4], [4, 3, 2, 1], label='Scatter 2')
ax2.set_title('Subplot 2 - how2matplotlib.com')

# Create a single legend for both subplots
fig.legend(handles=[line1, line2, scatter1, scatter2], loc='lower center', ncol=4, bbox_to_anchor=(0.5, -0.05))

plt.tight_layout()
plt.show()
Output:
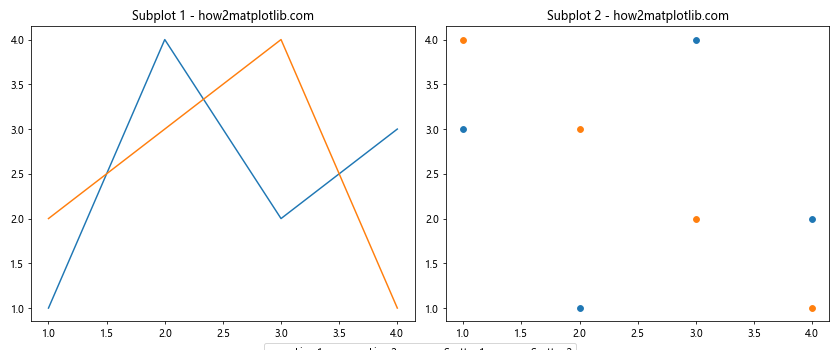
In this example, we’ve created a single legend for both subplots and positioned it below the figure using fig.legend() and bbox_to_anchor.
Fine-tuning Matplotlib Legend Position
To achieve the perfect matplotlib legend position, you may need to fine-tune various aspects of the legend. Let’s explore some advanced techniques for optimizing legend placement and appearance.
Adjusting Legend Size and Spacing
You can control the size and spacing of your legend to better fit your plot. Here’s an example demonstrating how to adjust these properties:
import matplotlib.pyplot as plt

fig, ax = plt.subplots(figsize=(10, 6))

ax.plot([1, 2, 3, 4], [1, 4, 2, 3], label='Line 1')
ax.plot([1, 2, 3, 4], [2, 3, 4, 1], label='Line 2')
ax.plot([1, 2, 3, 4], [3, 1, 4, 2], label='Line 3')

ax.set_title('Fine-tuned Legend Size and Spacing - how2matplotlib.com')

legend = ax.legend(loc='upper right', fontsize='small',
                   labelspacing=1.2, handlelength=3,
                   handletextpad=0.5, borderpad=0.5)

plt.tight_layout()
plt.show()
Output:
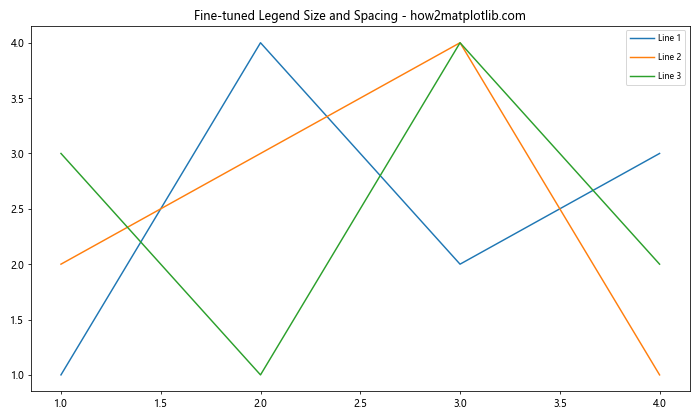
In this example, we’ve adjusted several properties of the legend:
fontsize: Controls the size of the text in the legendlabelspacing: Adjusts the vertical space between legend entrieshandlelength: Sets the length of the legend handleshandletextpad: Controls the space between the handle and the textborderpad: Adjusts the padding around the legend border
Using a Custom Legend Location
For even more precise control over matplotlib legend position, you can create a custom location using axes coordinates. This method allows you to specify the exact position of the legend within the axes.
Here’s an example:
import matplotlib.pyplot as plt

fig, ax = plt.subplots(figsize=(10, 6))

ax.plot([1, 2, 3, 4], [1, 4, 2, 3], label='Line 1')
ax.plot([1, 2, 3, 4], [2, 3, 4, 1], label='Line 2')

ax.set_title('Custom Legend Location - how2matplotlib.com')

# Create a custom legend location
legend = ax.legend(loc='upper left', bbox_to_anchor=(0.2, 0.2), bbox_transform=ax.transAxes)

plt.tight_layout()
plt.show()
Output:
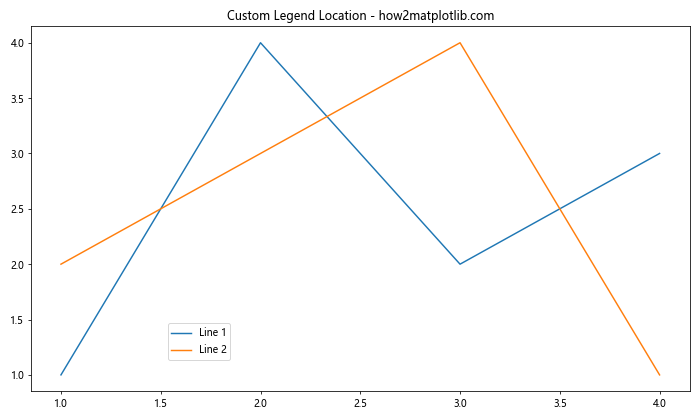
In this example, we’ve used bbox_to_anchor with ax.transAxes to position the legend at (0.2, 0.2) in axes coordinates, where (0, 0) is the bottom-left corner and (1, 1) is the top-right corner of the axes.
Handling Overlapping Legends
When working with complex plots, you may encounter situations where the legend overlaps with data points or other plot elements. Let’s explore some techniques to handle these situations.
Using the best Location
Matplotlib’s best location option attempts to find the optimal position for the legend that minimizes overlap with data points. Here’s an example:
import matplotlib.pyplot as plt
import numpy as np

fig, ax = plt.subplots(figsize=(10, 6))

# Generate random data
np.random.seed(42)
for i in range(5):
    x = np.random.rand(20)
    y = np.random.rand(20)
    ax.scatter(x, y, label=f'Dataset {i+1}')

ax.set_title('Using "best" Legend Location - how2matplotlib.com')

# Use 'best' location
ax.legend(loc='best')

plt.tight_layout()
plt.show()
Output:
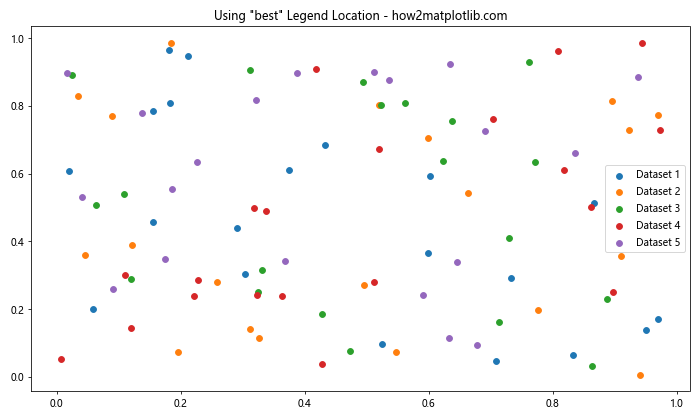
In this example, we’ve used loc='best' to let Matplotlib automatically choose the best position for the legend.
Expanding the Plot Area
If you have enough space in your figure, you can expand the plot area to accommodate the legend without overlapping. Here’s how you can do this:
import matplotlib.pyplot as plt

fig, ax = plt.subplots(figsize=(12, 6))

ax.plot([1, 2, 3, 4], [1, 4, 2, 3], label='Line 1')
ax.plot([1, 2, 3, 4], [2, 3, 4, 1], label='Line 2')
ax.plot([1, 2, 3, 4], [3, 1, 4, 2], label='Line 3')
ax.plot([1, 2, 3, 4], [4, 2, 1, 3], label='Line 4')

ax.set_title('Expanded Plot Area for Legend - how2matplotlib.com')

# Adjust the plot area to make room for the legend
plt.subplots_adjust(right=0.75)

# Position the legend outside the plot area
ax.legend(loc='center left', bbox_to_anchor=(1, 0.5))

plt.show()
Output:
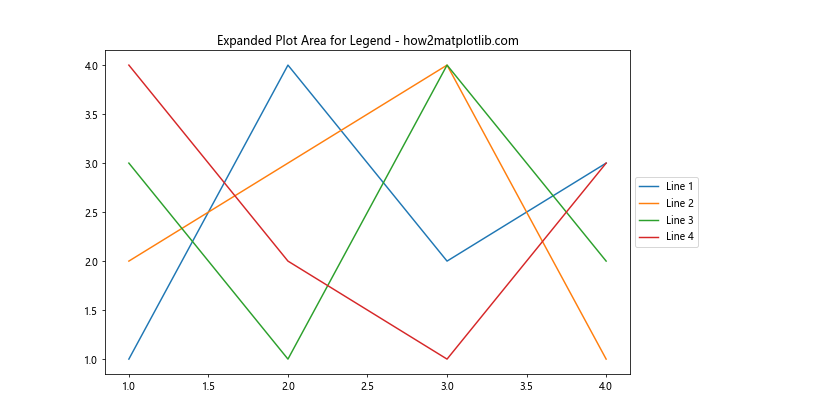
In this example, we’ve used plt.subplots_adjust() to reduce the width of the plot area, making room for the legend on the right side.
Matplotlib Legend Position in Different Coordinate Systems
Matplotlib supports different coordinate systems for positioning elements, including legends. Let’s explore how to use these coordinate systems to control matplotlib legend position.
Using Figure Coordinates
Figure coordinates allow you to position the legend relative to the entire figure, rather than just the axes. This can be useful for creating consistent legend positions across multiple plots.
Here’s an example:
import matplotlib.pyplot as plt

fig, ax = plt.subplots(figsize=(10, 6))

ax.plot([1, 2, 3, 4], [1, 4, 2, 3], label='Line 1')
ax.plot([1, 2, 3, 4], [2, 3, 4, 1], label='Line 2')

ax.set_title('Legend Position in Figure Coordinates - how2matplotlib.com')

# Position legend using figure coordinates
fig.legend(loc='upper right', bbox_to_anchor=(0.95, 0.95), bbox_transform=fig.transFigure)

plt.tight_layout()
plt.show()
Output:
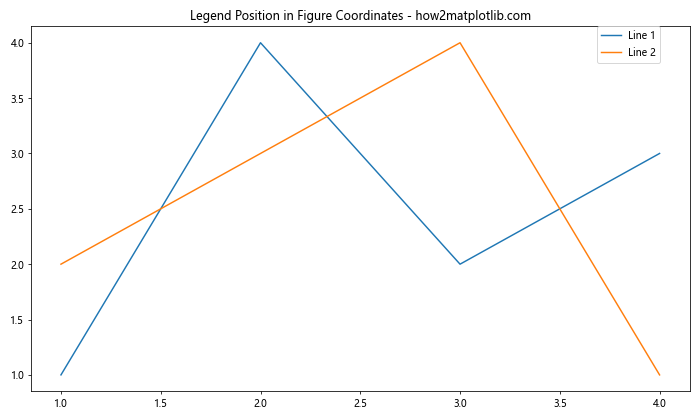
In this example, we’ve used fig.legend() with bbox_transform=fig.transFigure to position the legend relative to the figure coordinates.
Using Data Coordinates
You can also position the legend using data coordinates, which can be useful when you want to align the legend with specific data points.
Here’s an example:
import matplotlib.pyplot as plt

fig, ax = plt.subplots(figsize=(10, 6))

ax.plot([1, 2, 3, 4], [1, 4, 2, 3], label='Line 1')
ax.plot([1, 2, 3, 4], [2, 3, 4, 1], label='Line 2')

ax.set_title('Legend Position in Data Coordinates - how2matplotlib.com')

# Position legend using data coordinates
ax.legend(loc='upper left', bbox_to_anchor=(3, 4), bbox_transform=ax.transData)

plt.tight_layout()
plt.show()
Output:
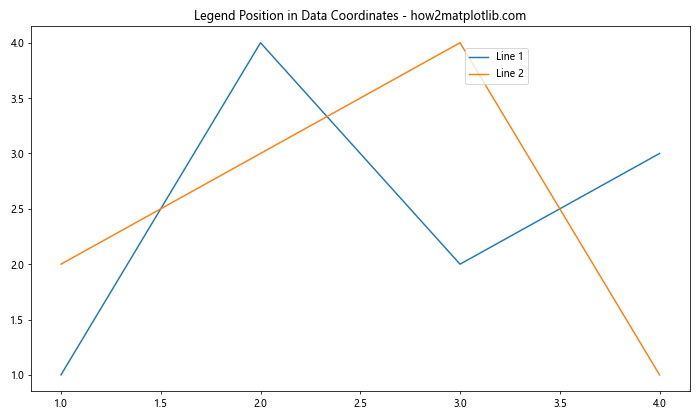
In this example, we’ve used bbox_transform=ax.transData to position the legend using data coordinates.
Advanced Matplotlib Legend Position Techniques
Let’s explore some advanced techniques for controlling matplotlib legend position and appearance.
Creating a Draggable Legend
You can create a draggable legend that allows users to interactively adjust its position. Here’s how:
import matplotlib.pyplot as plt

fig, ax = plt.subplots(figsize=(10, 6))

ax.plot([1, 2, 3, 4], [1, 4, 2, 3], label='Line 1')
ax.plot([1, 2, 3, 4], [2, 3, 4, 1], label='Line 2')

ax.set_title('Draggable Legend - how2matplotlib.com')

legend = ax.legend()
legend.set_draggable(True)

plt.tight_layout()
plt.show()
Output:
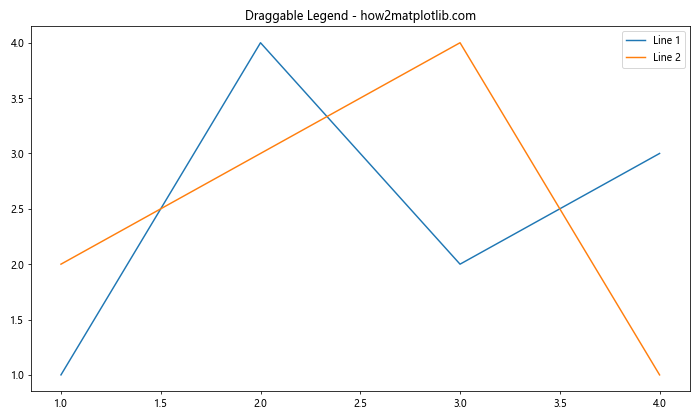
In this example, we’ve used legend.set_draggable(True) to make the legend draggable.
Creating a Legend for a Subset of Elements
Sometimes you may want to create a legend for only a subset of the elements in your plot. Here’s how you can do this:
import matplotlib.pyplot as plt

fig, ax = plt.subplots(figsize=(10, 6))

line1, = ax.plot([1, 2, 3, 4], [1, 4, 2, 3], label='Line 1')
line2, = ax.plot([1, 2, 3, 4], [2, 3, 4, 1], label='Line 2')
line3, = ax.plot([1, 2, 3, 4], [3, 1, 4, 2], label='Line 3')
line4, = ax.plot([1, 2, 3, 4], [4, 2, 1, 3], label='Line 4')

ax.set_title('Legend for Subset of Elements - how2matplotlib.com')

# Create legend for only the first two lines
ax.legend(handles=[line1, line2], loc='upper right')

plt.tight_layout()
plt.show()
Output:
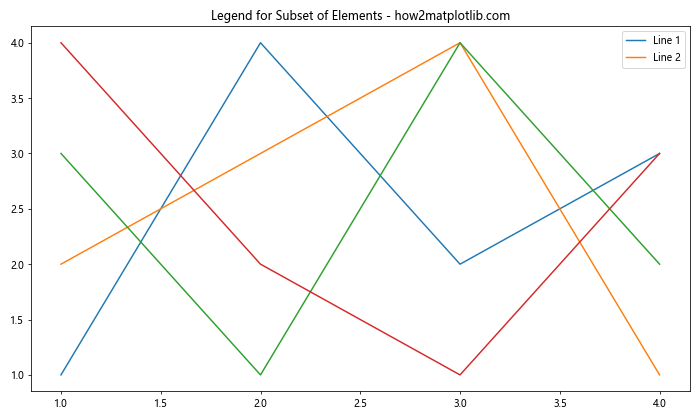
In this example, we’ve created a legend for only the first two lines by explicitly specifying the handles we want to include.
Troubleshooting Common Matplotlib Legend Position Issues
Even with all these techniques at your disposal, you may still encounter some issues when working with matplotlib legend position. Let’s address some common problems and their solutions.
Legend Overlapping with Plot Elements
If your legend is overlapping with plot elements, try the following:
- Use
loc='best'to let Matplotlib find the optimal position. - Adjust the plot layout using
plt.tight_layout()orplt.subplots_adjust(). - Position the legend outside the plot area using
bbox_to_anchor.
Here’s an example that demonstrates these solutions:
import matplotlib.pyplot as plt
import numpy as np

fig, (ax1, ax2, ax3) = plt.subplots(1, 3, figsize=(15, 5))

# Generate data with potential overlap
x = np.linspace(0, 10, 100)
y1 = np.sin(x)
y2 = np.cos(x)

# Plot 1: Using 'best' location
ax1.plot(x, y1, label='sin(x)')
ax1.plot(x, y2, label='cos(x)')
ax1.set_title("Using 'best' location - how2matplotlib.com")
ax1.legend(loc='best')

# Plot 2: Adjusting plot layout
ax2.plot(x, y1, label='sin(x)')
ax2.plot(x, y2, label='cos(x)')
ax2.set_title("Adjusting plot layout - how2matplotlib.com")
ax2.legend(loc='upper right')
plt.tight_layout()

# Plot 3: Positioning outside plot area
ax3.plot(x, y1, label='sin(x)')
ax3.plot(x, y2, label='cos(x)')
ax3.set_title("Outside plot area - how2matplotlib.com")
ax3.legend(bbox_to_anchor=(1.05, 1), loc='upper left')

plt.tight_layout()
plt.show()
Output:
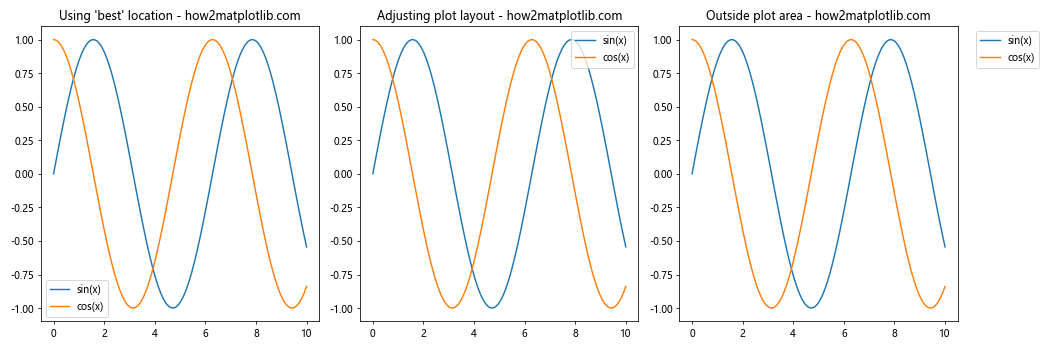
This example demonstrates three different approaches to handling legend overlap.
Legend Text Too Small or Large
If the legend text is too small or large, you can adjust it using the fontsize parameter:
import matplotlib.pyplot as plt

fig, (ax1, ax2) = plt.subplots(1, 2, figsize=(12, 5))

# Plot with small legend text
ax1.plot([1, 2, 3, 4], [1, 4, 2, 3], label='Line 1')
ax1.plot([1, 2, 3, 4], [2, 3, 4, 1], label='Line 2')
ax1.set_title('Small Legend Text - how2matplotlib.com')
ax1.legend(fontsize='small')

# Plot with large legend text
ax2.plot([1, 2, 3, 4], [1, 4, 2, 3], label='Line 1')
ax2.plot([1, 2, 3, 4], [2, 3, 4, 1], label='Line 2')
ax2.set_title('Large Legend Text - how2matplotlib.com')
ax2.legend(fontsize='large')

plt.tight_layout()
plt.show()
Output:
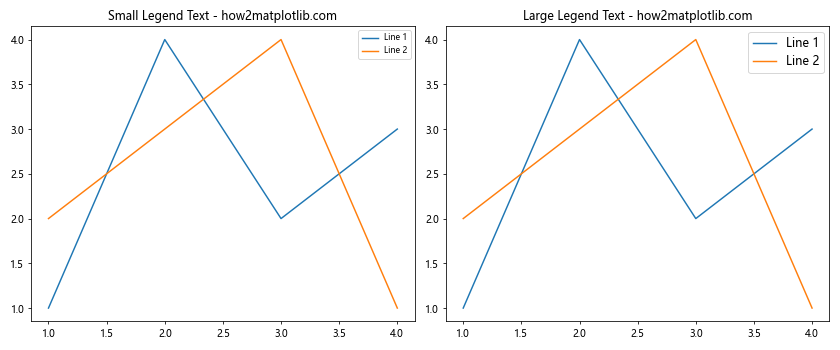
This example shows how to adjust the legend text size using the fontsize parameter.
Matplotlib legend position Conclusion
Mastering matplotlib legend position is crucial for creating clear, informative, and visually appealing plots. Throughout this comprehensive guide, we’ve explored various techniques for controlling legend placement, from basic methods to advanced customization options.
We’ve covered:
- Basic matplotlib legend position techniques using the
locparameter - Advanced positioning methods with
bbox_to_anchor - Handling multiple legends and subplots
- Fine-tuning legend appearance and size
- Using different coordinate systems for legend positioning
- Troubleshooting common issues with legend placement
By applying these techniques and best practices, you’ll be able to create professional-looking visualizations with perfectly positioned legends that enhance the readability and impact of your plots.
Remember to consider the overall layout of your plot, the density of data points, and the number of elements in your legend when deciding on the optimal matplotlib legend position. With practice and experimentation, you’ll develop an intuitive sense for the best legend placement in various scenarios.