Matplotlib Log Scale
Matplotlib is a powerful plotting library for Python that provides a wide range of options for customizing and visualizing data. One useful feature of Matplotlib is the ability to plot data on a logarithmic scale. In this article, we will explore how to use the log scale feature in Matplotlib, including how to set the scale for both the x-axis and y-axis, and how to customize the appearance of the plot.
Setting Log Scale
To set the log scale for a plot in Matplotlib, you can use the set_xscale and set_yscale methods on the axis object. Here are some examples of how to set the log scale for plots:
Example 1: Plotting data on a log scale
import matplotlib.pyplot as plt
import numpy as np

x = np.arange(1, 10)
y = x**2

plt.plot(x, y)
plt.yscale('log')
plt.show()
Output:
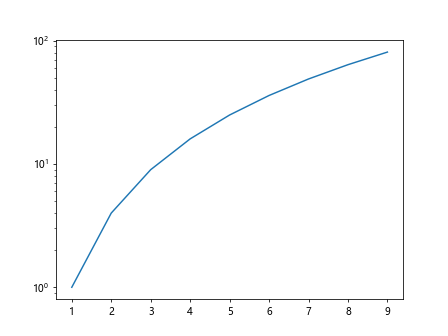
In this example, we create a simple plot of y = x^2 and set the y-axis to a logarithmic scale using the plt.yscale('log') function.
Example 2: Plotting data on a log scale with error bars
import matplotlib.pyplot as plt
import numpy as np

x = np.arange(1, 10)
y = x**2
yerr = np.sqrt(x)

plt.errorbar(x, y, yerr=yerr, fmt='o')
plt.yscale('log')
plt.show()
Output:
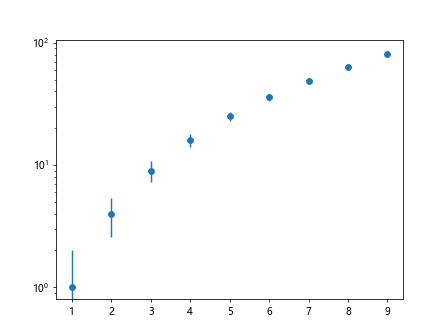
In this example, we plot y = x^2 with error bars and set the y-axis to a logarithmic scale.
Example 3: Scatter plot with log scale
import matplotlib.pyplot as plt
import numpy as np

x = np.linspace(1, 10, 100)
y = np.random.rand(100)

plt.scatter(x, y)
plt.xscale('log')
plt.show()
Output:
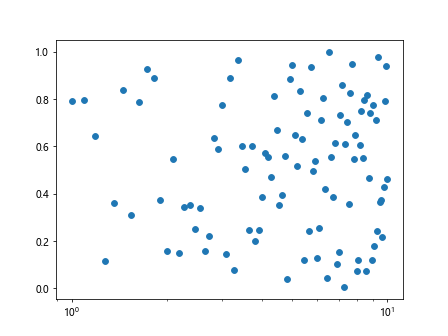
In this example, we create a scatter plot and set the x-axis to a logarithmic scale.
Customizing Log Scale Plots
In addition to setting the log scale for plots, you can also customize the appearance of log scale plots in Matplotlib. Here are some examples of customizing log scale plots:
Example 4: Setting log scale ticks
import matplotlib.pyplot as plt
import numpy as np

x = np.linspace(1, 10, 100)
y = np.exp(x)

plt.plot(x, y)
plt.xscale('log')
plt.xticks([1, 10], ['start', 'end'])
plt.show()
Output:
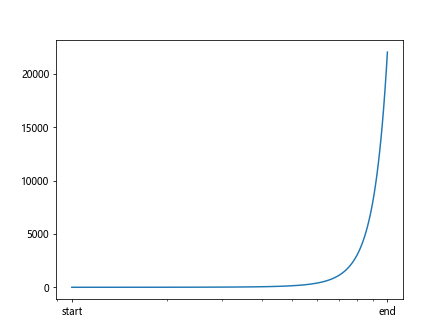
In this example, we set the x-axis ticks for a log scale plot.
Example 5: Changing log base
import matplotlib.pyplot as plt
import numpy as np

x = np.linspace(1, 10, 100)
y = x**2

plt.plot(x, y)
plt.yscale('log', base=2)
plt.show()
Output:
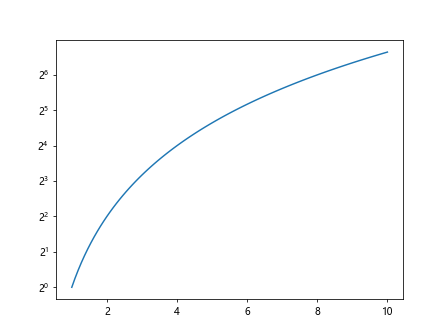
In this example, we change the base of the log scale to 2 for the y-axis.
Example 6: Log scale with custom axis limits
import matplotlib.pyplot as plt
import numpy as np

x = np.linspace(1, 100, 100)
y = np.exp(x)

plt.plot(x, y)
plt.xscale('log')
plt.xlim(10, 100)  # Set custom x-axis limits
plt.show()
Output:
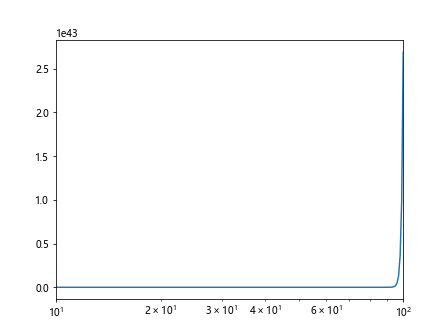
In this example, we set custom axis limits for a log scale plot.
Example 7: Log scale with minor ticks
import matplotlib.pyplot as plt
import numpy as np

x = np.linspace(1, 100, 100)
y = np.exp(x)

plt.plot(x, y)
plt.yscale('log')
plt.minorticks_on()
plt.show()
Output:
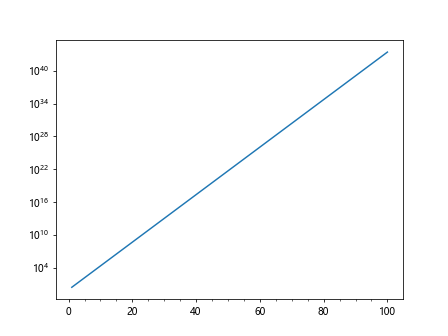
In this example, we enable minor ticks for a log scale plot.
Multiple Log Scale Plots
You can also create plots with multiple axes that have different log scales in Matplotlib. Here are examples of creating plots with multiple log scales:
Example 8: Plot with multiple log scales
import matplotlib.pyplot as plt
import numpy as np

fig, ax1 = plt.subplots()

x = np.linspace(1, 10, 100)
y1 = np.sin(x)
y2 = np.exp(x)

ax1.plot(x, y1, 'b-')
ax1.set_ylabel('sin', color='b')

ax2 = ax1.twinx()
ax2.plot(x, y2, 'r-')
ax2.set_ylabel('exp', color='r')

ax1.set_yscale('log')
ax2.set_yscale('log')

plt.show()
Output:
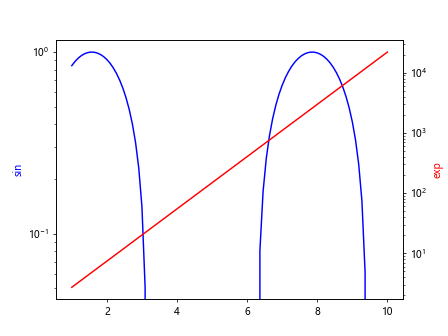
In this example, we create a plot with two y-axes, one with a sin function and the other with an exponential function, both on a log scale.
Example 9: Plot with log scale on both axes
import matplotlib.pyplot as plt
import numpy as np

x = np.linspace(1, 10, 100)
y = x**2

fig, ax = plt.subplots()
ax.plot(x, y)
ax.set_xscale('log')
ax.set_yscale('log')
plt.show()
Output:
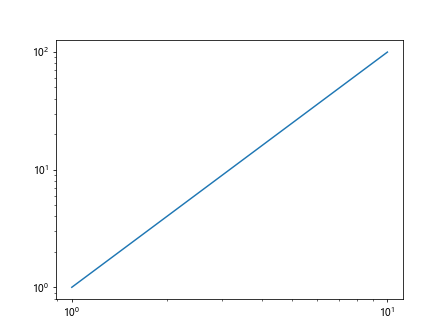
In this example, we create a plot with both the x-axis and y-axis on a log scale.
Logarithmic Colorbars
You can also create plots with log scale colorbars in Matplotlib. Here are examples of creating plots with log scale colorbars:
Example 10: Contour plot with log scale colorbar
import matplotlib.pyplot as plt
import numpy as np

x = np.linspace(1, 10, 100)
y = np.linspace(1, 10, 100)
X, Y = np.meshgrid(x, y)
Z = X**2 + Y**2

plt.contourf(X, Y, Z, levels=10)
plt.colorbar()
plt.xscale('log')
plt.yscale('log')
plt.show()
Output:
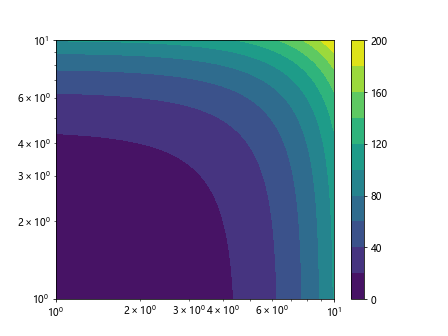
In this example, we create a contour plot with a log scale colorbar.
Example 11: Scatter plot with log scale colorbar
import matplotlib.pyplot as plt
import numpy as np

x = np.linspace(1, 10, 100)
y = np.random.rand(100)
c = np.exp(x)

plt.scatter(x, y, c=c, cmap='viridis')
plt.colorbar()
plt.xscale('log')
plt.show()
Output:
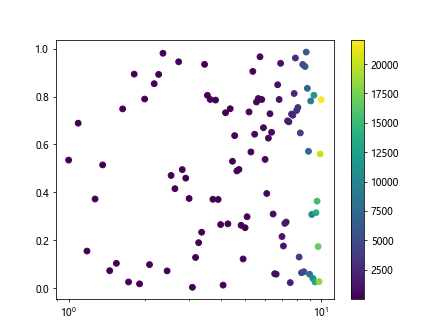
In this example, we create a scatter plot with a log scale colorbar based on the x-values.
Logarithmic Axes in 3D Plots
You can also create 3D plots with log scale axes in Matplotlib. Here are examples of creating 3D plots with log scale axes:
Example 12: 3D plot with log scale axes
import matplotlib.pyplot as plt
import numpy as np
from mpl_toolkits.mplot3d import Axes3D

x = np.linspace(1, 10, 100)
y = np.linspace(1, 10, 100)
X, Y = np.meshgrid(x, y)
Z = np.sqrt(X**2 + Y**2)

fig = plt.figure()
ax = fig.add_subplot(111, projection='3d')
ax.plot_surface(X, Y, Z, cmap='viridis')

ax.set_xscale('log')
ax.set_yscale('log')
ax.set_zscale('log')

plt.show()
Output:
In this example, we create a 3D surface plot with log scale axes.
Example 13: 3D scatter plot with log scale axes
import matplotlib.pyplot as plt
import numpy as np
from mpl_toolkits.mplot3d import Axes3D

x = np.linspace(1, 10, 100)
y = np.random.rand(100)
z = np.random.rand(100)

fig = plt.figure()
ax = fig.add_subplot(111, projection='3d')
ax.scatter(x, y, z)

ax.set_xscale('log')
ax.set_yscale('log')
ax.set_zscale('log')

plt.show()
Output:
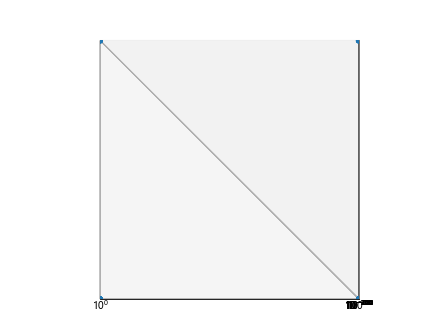
In this example, we create a 3D scatter plot with log scale axes.
Logarithmic Histograms
You can also create histograms with log scale axes in Matplotlib. Here are examples of creating histograms with log scale axes:
Example 14: Histogram with log scale y-axis
import matplotlib.pyplot as plt
import numpy as np

x = np.random.exponential(scale=2, size=1000)

plt.hist(x, bins=30)
plt.yscale('log')
plt.show()
Output:
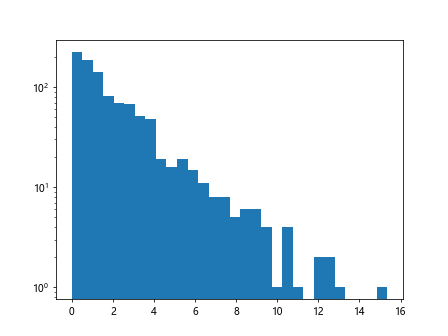
In this example, we create a histogram with a log scale y-axis.
Example 15: Histogram with log scale x-axis
import matplotlib.pyplot as plt
import numpy as np
x = np.random.exponential(scale=2, size=1000)

plt.hist(x, bins=30)
plt.xscale('log')
plt.show()
Output:
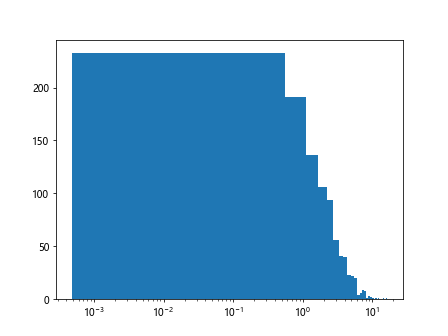
In this example, we create a histogram with a log scale x-axis.
Logarithmic Polar Plots
You can also create polar plots with log scale axes in Matplotlib. Here are examples of creating polar plots with log scale axes:
Example 16: Polar### Example 16: Polar plot with log scale radius
import matplotlib.pyplot as plt
import numpy as np

theta = np.linspace(0, 2*np.pi, 100)
r = np.exp(theta)

fig = plt.figure()
ax = fig.add_subplot(111, polar=True)
ax.plot(theta, r)
ax.set_yscale('log')
plt.show()
Output:
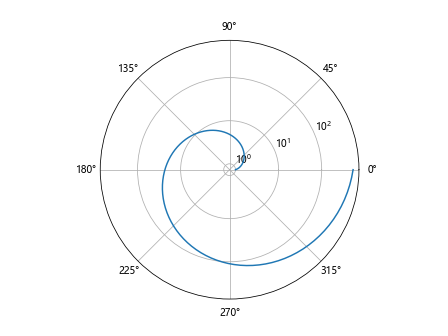
In this example, we create a polar plot with log scale radius.
Example 17: Polar plot with log scale theta
import matplotlib.pyplot as plt
import numpy as np

theta = np.linspace(0, 2*np.pi, 100)
r = np.abs(np.sin(theta))

fig = plt.figure()
ax = fig.add_subplot(111, polar=True)
ax.plot(theta, r)
ax.set_xscale('log')
plt.show()
In this example, we create a polar plot with log scale theta.
Logarithmic Axis Labels
You can also customize axis labels with log scale values in Matplotlib. Here are examples of creating plots with log scale axis labels:
Example 18: Log scale axis labels
import matplotlib.pyplot as plt
import numpy as np

x = np.linspace(1, 10, 100)
y = np.exp(x)

plt.plot(x, y)
plt.xlabel('log10(x)')
plt.ylabel('log10(y)')
plt.xscale('log')
plt.yscale('log')
plt.show()
Output:
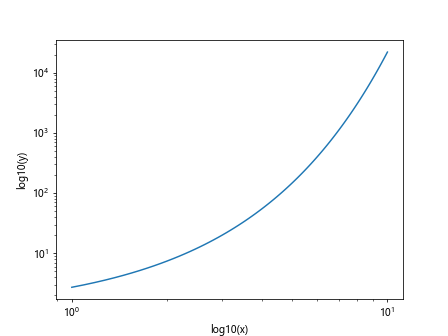
In this example, we create a plot with log scale axis labels for both x and y axes.
Example 19: Changing log format
import matplotlib.pyplot as plt
import numpy as np

x = np.linspace(1, 10, 100)
y = np.exp(x)

plt.plot(x, y)
plt.xscale('log')
plt.gca().xaxis.set_major_formatter(plt.FuncFormatter(lambda x, _: '{:.2e}'.format(x)))
plt.show()
Output:
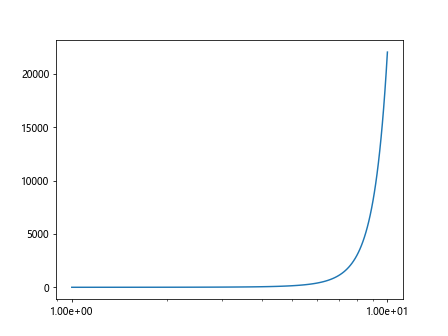
In this example, we change the format of the log scale ticks on the x-axis to scientific notation.
Logarithmic Gridlines
You can also customize gridlines for log scale plots in Matplotlib. Here are examples of creating plots with log scale gridlines:
Example 20: Log scale gridlines
import matplotlib.pyplot as plt
import numpy as np

x = np.linspace(1, 10, 100)
y = np.exp(x)

plt.plot(x, y)
plt.xscale('log')
plt.grid(which='both', axis='both')
plt.show()
Output:
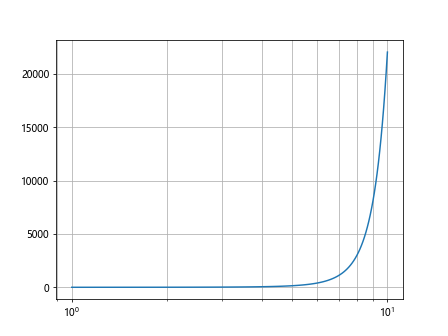
In this example, we create a plot with gridlines for both x and y axes on a log scale.
Matplotlib Log Scale Conclusion
In this article, we have explored how to use log scale in Matplotlib for a variety of plot types, customization options, and multiple axes. By using log scale, you can visualize data that spans a wide range of values in a more intuitive and informative way. Whether you are plotting simple data points or creating complex 3D visualizations, Matplotlib’s log scale feature provides a powerful tool for data visualization. Experiment with the examples provided in this article to enhance your plotting skills and effectively communicate your data insights.