Matplotlib Marker Size
Matplotlib is a popular Python library for creating static, animated, and interactive plots. One commonly used parameter in Matplotlib is the marker size, which allows you to change the size of the markers used in scatter plots, line plots, and other types of plots.
In this article, we will explore how to adjust the marker size in Matplotlib through various examples. We will cover how to set marker size in scatter plots, line plots, and bar plots.
Scatter Plot Marker Size
In scatter plots, marker size can be adjusted using the s parameter. This parameter can take a single value to set the marker size for all points or an array to set different sizes for individual points.
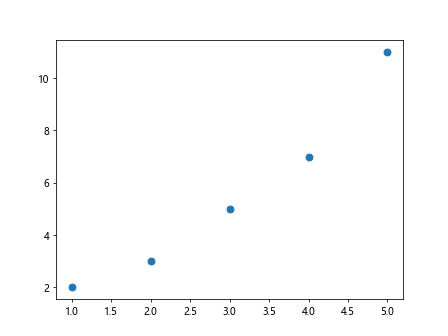
Example 1: Setting Marker Size for All Points
import matplotlib.pyplot as plt

x = [1, 2, 3, 4, 5]
y = [2, 3, 5, 7, 11]
sizes = 50  # marker size for all points

plt.scatter(x, y, s=sizes)
plt.show()
Output:
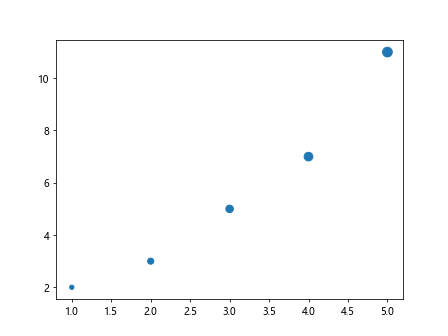
Example 2: Setting Marker Size for Individual Points
import matplotlib.pyplot as plt

x = [1, 2, 3, 4, 5]
y = [2, 3, 5, 7, 11]
sizes = [20, 40, 60, 80, 100]  # marker size for individual points

plt.scatter(x, y, s=sizes)
plt.show()
Output:
Line Plot Marker Size
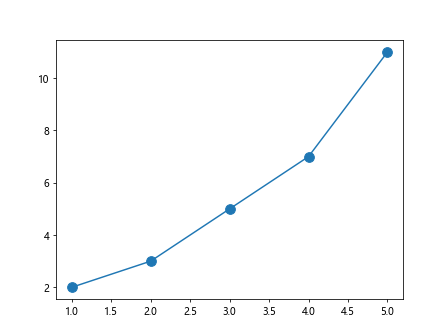
In line plots, marker size can be adjusted using the markersize parameter. This parameter sets the size of the markers used to indicate data points along the line.
Example 3: Setting Marker Size in Line Plot
import matplotlib.pyplot as plt

x = [1, 2, 3, 4, 5]
y = [2, 3, 5, 7, 11]

plt.plot(x, y, marker='o', markersize=10)
plt.show()
Output:
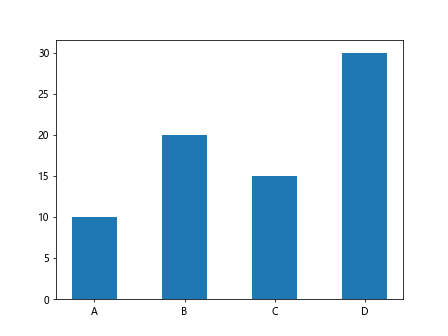
Bar Plot Marker Size
In bar plots, marker size can be adjusted using the width parameter. This parameter sets the width of the bars in the bar plot.
Example 4: Setting Marker Size in Bar Plot
import matplotlib.pyplot as plt

x = ['A', 'B', 'C', 'D']
y = [10, 20, 15, 30]
width = 0.5  # bar width

plt.bar(x, y, width=width)
plt.show()
Output:
Setting Marker Size in Different Plot Styles
Marker size can also be adjusted in various plot styles provided by Matplotlib, such as scatter plots, line plots, and bar plots.
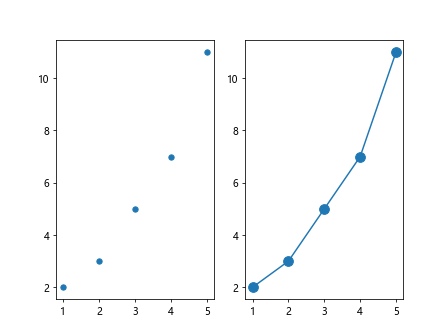
Example 5: Setting Marker Size in Subplots
import matplotlib.pyplot as plt

fig, (ax1, ax2) = plt.subplots(1, 2)

x = [1, 2, 3, 4, 5]
y = [2, 3, 5, 7, 11]

ax1.scatter(x, y, s=30)
ax2.plot(x, y, marker='o', markersize=10)

plt.show()
Output:
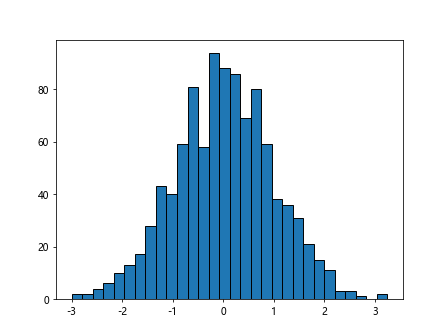
Example 6: Setting Marker Size in Histogram
import matplotlib.pyplot as plt
import numpy as np

data = np.random.normal(0, 1, 1000)

plt.hist(data, bins=30, edgecolor='black')
plt.show()
Output:
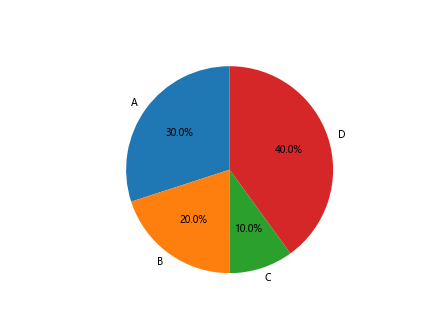
Example 7: Setting Marker Size in Pie Chart
import matplotlib.pyplot as plt

sizes = [30, 20, 10, 40]
labels = ['A', 'B', 'C', 'D']

plt.pie(sizes, labels=labels, autopct='%1.1f%%', startangle=90)
plt.show()
Output:
Advanced Marker Size Manipulations
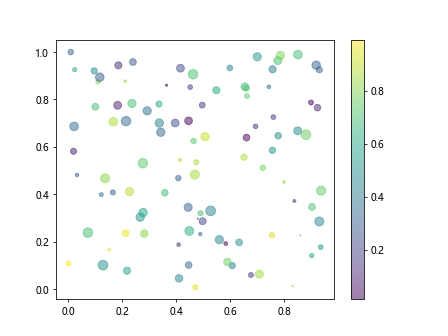
In addition to setting a fixed marker size, Matplotlib allows for more advanced marker size manipulations, such as using a colormap to map marker sizes to data values.
Example 8: Using Colormap to Map Marker Size
import matplotlib.pyplot as plt
import numpy as np

x = np.random.rand(100)
y = np.random.rand(100)
sizes = np.random.rand(100) * 100           # marker sizes
colors = np.random.rand(100)                 # marker colors

plt.scatter(x, y, s=sizes, c=colors, cmap='viridis', alpha=0.5)
plt.colorbar()
plt.show()
Output:
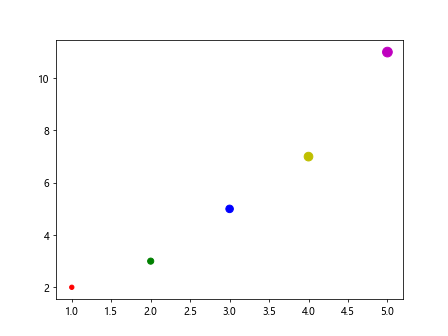
Example 9: Customizing Marker Size and Color
import matplotlib.pyplot as plt

x = [1, 2, 3, 4, 5]
y = [2, 3, 5, 7, 11]
sizes = [20, 40, 60, 80, 100]
colors = ['r', 'g', 'b', 'y', 'm']

plt.scatter(x, y, s=sizes, c=colors)
plt.show()
Output:
Matplotlib Marker Size Conclusion
In this article, we explored how to adjust the marker size in Matplotlib using various examples. We covered setting marker size in scatter plots, line plots, and bar plots, as well as in different plot styles such as subplots, histograms, and pie charts. We also looked at more advanced marker size manipulations using colormap and customizing marker size and color. By manipulating marker size, you can enhance the visual impact of your plots and improve data visualization in Matplotlib.
Remember, the marker size in Matplotlib is a versatile parameter that can be customized to suit your specific data visualization needs. Experiment with different marker sizes and styles to create visually appealing and informative plots.