Matplotlib Multiple Plots
Matplotlib is a powerful Python library for creating static, animated, and interactive visualizations in Python. One of the key features of Matplotlib is the ability to create multiple plots in the same figure. This can be useful for comparing different datasets, visualizing different aspects of the same data, or creating subplots with different types of plots.
In this article, we will explore various ways to create multiple plots using Matplotlib. We will cover how to create subplots, create plots in a grid layout, and customize the appearance of multiple plots in a single figure.
Creating Subplots
Subplots allow you to create multiple plots within a single figure. You can specify the number of rows and columns of subplots, as well as the position of each subplot within the grid.
Example 1: Creating a 2×2 Grid of Subplots
import matplotlib.pyplot as plt

# Create a figure with a 2x2 grid of subplots
fig, axs = plt.subplots(2, 2)

# Plot data on each subplot
axs[0, 0].plot([1, 2, 3, 4], [1, 4, 9, 16])
axs[0, 1].plot([1, 2, 3, 4], [1, 2, 3, 4])
axs[1, 0].scatter([1, 2, 3, 4], [10, 5, 20, 15])
axs[1, 1].bar([1, 2, 3, 4], [10, 5, 20, 15])

plt.show()
Output:
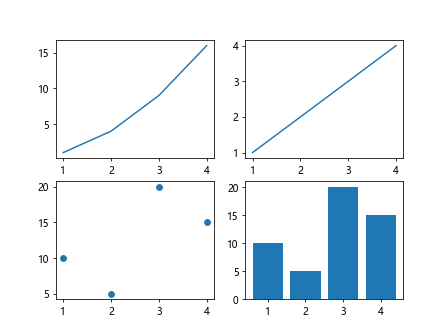
The plt.subplots() function is used to create a figure with a grid of subplots. In this example, we create a 2×2 grid of subplots and plot different types of data on each subplot.
Example 2: Customizing Subplot Layout
import matplotlib.pyplot as plt

# Create a figure with a custom layout of subplots
fig, axs = plt.subplots(2, 2, gridspec_kw={'width_ratios': [1, 2], 'height_ratios': [2, 1]})

# Plot data on each subplot
axs[0, 0].plot([1, 2, 3, 4], [1, 4, 9, 16])
axs[0, 1].plot([1, 2, 3, 4], [1, 2, 3, 4])
axs[1, 0].scatter([1, 2, 3, 4], [10, 5, 20, 15])
axs[1, 1].bar([1, 2, 3, 4], [10, 5, 20, 15])

plt.show()
Output:
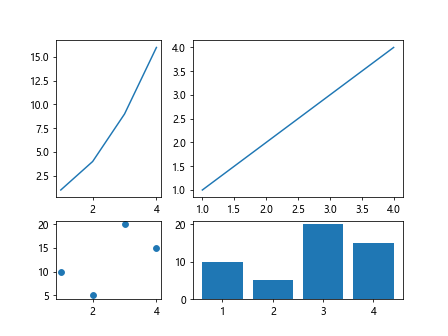
The gridspec_kw parameter in the plt.subplots() function allows you to customize the layout of subplots. In this example, we specify the relative widths and heights of the subplots using the width_ratios and height_ratios parameters.
Creating Plots in Grid Layout
In addition to creating subplots, Matplotlib also provides the subplot2grid() function for creating plots in a grid layout within a single figure. This function allows for more flexibility in arranging plots within a grid.
Example 3: Creating Plots in a 3×3 Grid Layout
import matplotlib.pyplot as plt

# Create a figure with a 3x3 grid layout
fig = plt.figure()

# Create plots in the grid layout
plt.subplot2grid((3, 3), (0, 0), colspan=3)
plt.plot([1, 2, 3, 4], [1, 4, 9, 16])

plt.subplot2grid((3, 3), (1, 0), colspan=2)
plt.scatter([1, 2, 3, 4], [10, 5, 20, 15])

plt.subplot2grid((3, 3), (1, 2), rowspan=2)
plt.bar([1, 2, 3, 4], [10, 5, 20, 15])

plt.subplot2grid((3, 3), (2, 0), colspan=3)
plt.plot([1, 2, 3, 4], [1, 2, 3, 4])

plt.show()
Output:
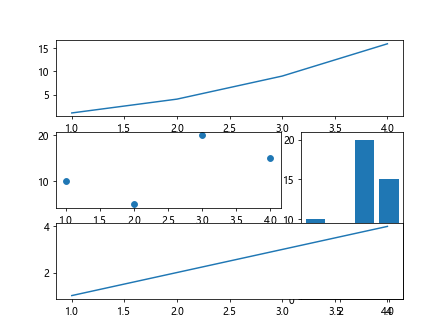
The subplot2grid() function allows you to create plots within a grid layout by specifying the grid dimensions and the position of each plot within the grid. You can also specify the number of columns or rows that each plot should span.
Example 4: Customizing Grid Layout
import matplotlib.pyplot as plt

# Create a figure with a custom grid layout
fig = plt.figure()

# Create plots in the grid layout
plt.subplot2grid((2, 3), (0, 0), colspan=3)
plt.plot([1, 2, 3, 4], [1, 4, 9, 16])

plt.subplot2grid((2, 3), (1, 0))
plt.scatter([1, 2, 3, 4], [10, 5, 20, 15])

plt.subplot2grid((2, 3), (1, 1), colspan=2)
plt.bar([1, 2, 3, 4], [10, 5, 20, 15])

plt.show()
Output:
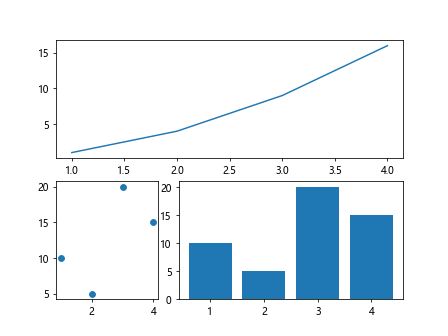
You can customize the grid layout of plots by specifying the grid dimensions and the position of each plot within the grid. In this example, we create a custom grid layout with dimensions (2, 3) and arrange plots accordingly.
Customizing Multiple Plots
Matplotlib provides extensive customization options for plots, including customizing plot colors, markers, line styles, labels, titles, and more. This allows you to create visually appealing and informative plots in a single figure.
Example 5: Customizing Plot Colors
import matplotlib.pyplot as plt

# Create a figure with two plots
fig, axs = plt.subplots(1, 2)

# Plot data with custom colors
axs[0].plot([1, 2, 3, 4], [1, 4, 9, 16], color='red')
axs[1].plot([1, 2, 3, 4], [1, 2, 3, 4], color='blue')

plt.show()
Output:
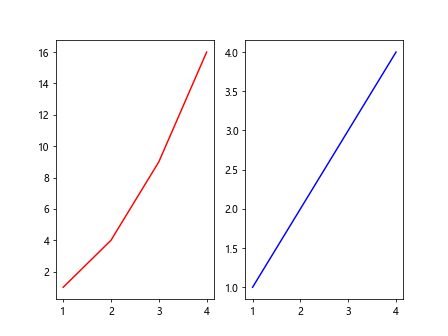
You can customize the colors of plots by specifying the color parameter in the plot functions. In this example, we create two plots with different custom colors.
Example 6: Customizing Plot Markers and Line Styles
import matplotlib.pyplot as plt

# Create a figure with two plots
fig, axs = plt.subplots(1, 2)

# Plot data with custom markers and line styles
axs[0].plot([1, 2, 3, 4], [1, 4, 9, 16], marker='o', linestyle='--')
axs[1].plot([1, 2, 3, 4], [1, 2, 3, 4], marker='x', linestyle=':')

plt.show()
Output:
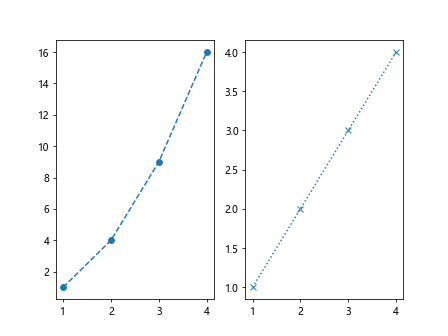
You can customize the markers and line styles of plots by specifying the marker and linestyle parameters in the plot functions. In this example, we create two plots with different custom markers and line styles.
Example 7: Adding Plot Labels and Titles
import matplotlib.pyplot as plt

# Create a figure with a plot
fig, ax = plt.subplots()

# Plot data with labels and title
ax.plot([1, 2, 3, 4], [1, 4, 9, 16])
ax.set_xlabel('X-axis')
ax.set_ylabel('Y-axis')
ax.set_title('Sample Plot Title')

plt.show()
Output:
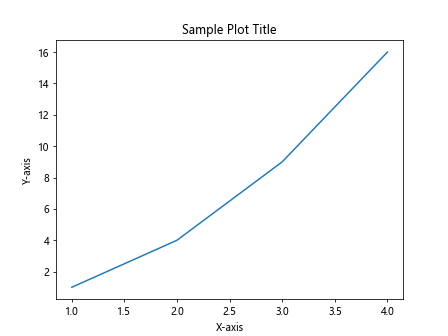
You can add labels to the x-axis and y-axis, as well as a title to the plot using the set_xlabel(), set_ylabel(), and set_title() functions. In this example, we create a plot with custom labels and a title.
Combining Multiple Plots
In addition to creating multiple plots within a single figure, Matplotlib also allows you to combine multiple plots into a single plot. This can beuseful for visualizing relationships between different datasets or comparing trends across different plots.
Example 8: Combining Line Plots
import matplotlib.pyplot as plt

# Create a figure with a single plot
fig, ax = plt.subplots()

# Plot multiple lines on the same plot
x = [1, 2, 3, 4]
y1 = [1, 4, 9, 16]
y2 = [2, 5, 10, 17]

ax.plot(x, y1, label='Line 1')
ax.plot(x, y2, label='Line 2')

ax.legend()

plt.show()
Output:
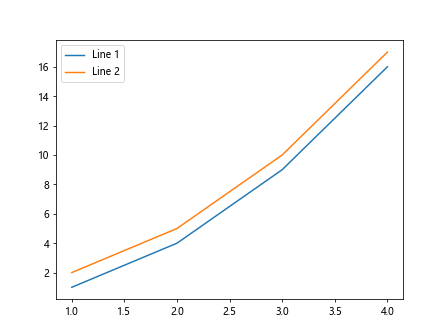
You can combine multiple line plots into a single plot by calling the plot() function multiple times with different datasets. The legend() function is used to display a legend with labels for each line.
Example 9: Combining Scatter Plots
import matplotlib.pyplot as plt

# Create a figure with a single plot
fig, ax = plt.subplots()

# Create scatter plots with different markers
x = [1, 2, 3, 4]
y1 = [1, 4, 9, 16]
y2 = [2, 5, 10, 17]

ax.scatter(x, y1, label='Data 1', marker='o')
ax.scatter(x, y2, label='Data 2', marker='x')

ax.legend()

plt.show()
Output:
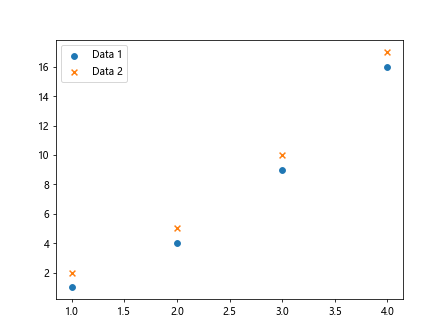
You can combine multiple scatter plots into a single plot by calling the scatter() function multiple times with different datasets and markers. The legend() function is used to display a legend with labels for each scatter plot.
Matplotlib Multiple Plots Conclusion
In this article, we explored various ways to create multiple plots using Matplotlib. We covered how to create subplots, create plots in a grid layout, customize the appearance of multiple plots, and combine multiple plots into a single figure. By using these techniques, you can create complex and informative visualizations that convey insights from your data effectively. Matplotlib’s versatility and customization options make it a powerful tool for data visualization in Python.