Matplotlib Plot
Matplotlib is a powerful and widely used plotting library in Python for creating interactive and static plots. In this article, we will explore various aspects of using Matplotlib for creating different types of plots. We will cover topics like line plots, scatter plots, bar plots, pie charts, histograms, and much more. Each topic will include example code snippets and the resulting plots.
Line Plot
Line plots are useful for visualizing data points connected by line segments. Let’s create a simple line plot using Matplotlib.
import matplotlib.pyplot as plt

# Data
x = [1, 2, 3, 4, 5]
y = [2, 4, 6, 8, 10]

# Create a line plot
plt.plot(x, y)
plt.xlabel('X-axis')
plt.ylabel('Y-axis')
plt.title('Simple Line Plot')
plt.show()
Output:
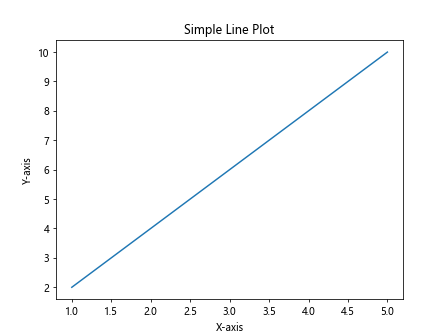
The above code will generate a line plot with x-axis values 1, 2, 3, 4, 5 and corresponding y-axis values 2, 4, 6, 8, 10.
Scatter Plot
Scatter plots are used to visualize the relationship between two variables by placing points on a graph. Let’s create a simple scatter plot using Matplotlib.
import matplotlib.pyplot as plt

# Data
x = [1, 2, 3, 4, 5]
y = [2, 4, 6, 8, 10]

# Create a scatter plot
plt.scatter(x, y)
plt.xlabel('X-axis')
plt.ylabel('Y-axis')
plt.title('Simple Scatter Plot')
plt.show()
Output:
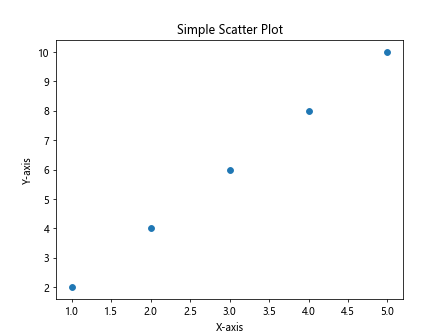
The above code will generate a scatter plot with x-axis values 1, 2, 3, 4, 5 and corresponding y-axis values 2, 4, 6, 8, 10.
Bar Plot
Bar plots are used to compare different categories of data. Let’s create a simple bar plot using Matplotlib.
import matplotlib.pyplot as plt

# Data
x = ['A', 'B', 'C', 'D', 'E']
y = [10, 20, 15, 25, 30]

# Create a bar plot
plt.bar(x, y)
plt.xlabel('Categories')
plt.ylabel('Values')
plt.title('Simple Bar Plot')
plt.show()
Output:
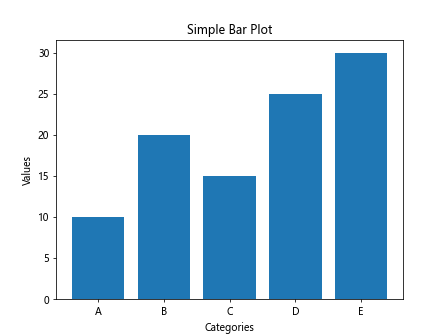
The above code will generate a bar plot with x-axis categories A, B, C, D, E and corresponding y-axis values 10, 20, 15, 25, 30.
Pie Chart
Pie charts are useful for showing the proportions of different categories in a dataset. Let’s create a simple pie chart using Matplotlib.
import matplotlib.pyplot as plt

# Data
sizes = [25, 30, 20, 15, 10]
labels = ['A', 'B', 'C', 'D', 'E']

# Create a pie chart
plt.pie(sizes, labels=labels, autopct='%1.1f%%')
plt.title('Simple Pie Chart')
plt.show()
Output:
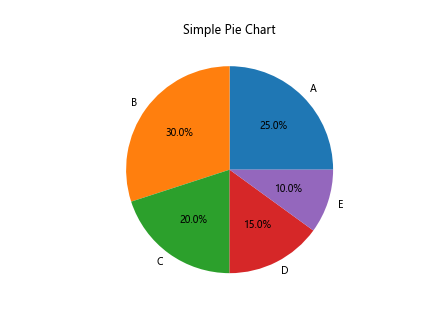
The above code will generate a pie chart with proportions for categories A, B, C, D, E.
Histogram
Histograms are used to visualize the distribution of a dataset. Let’s create a simple histogram using Matplotlib.
import matplotlib.pyplot as plt
import numpy as np

# Data
data = np.random.randn(1000)

# Create a histogram
plt.hist(data, bins=30)
plt.xlabel('Value')
plt.ylabel('Frequency')
plt.title('Simple Histogram')
plt.show()
Output:
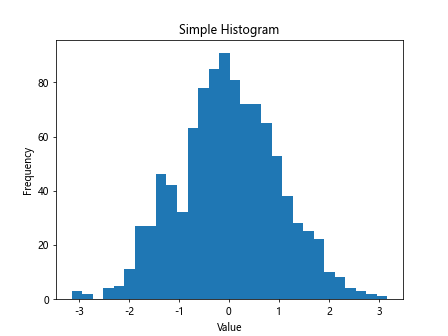
The above code will generate a histogram of a dataset with 1000 random values.
Subplots
Subplots allow us to create multiple plots within a single figure. Let’s create multiple subplots using Matplotlib.
import matplotlib.pyplot as plt

# Data
x = [1, 2, 3, 4, 5]
y1 = [2, 4, 6, 8, 10]
y2 = [1, 3, 5, 7, 9]

# Create subplots
plt.figure(figsize=(10, 5))

plt.subplot(1, 2, 1)
plt.plot(x, y1)
plt.title('Subplot 1')

plt.subplot(1, 2, 2)
plt.plot(x, y2)
plt.title('Subplot 2')

plt.show()
Output:
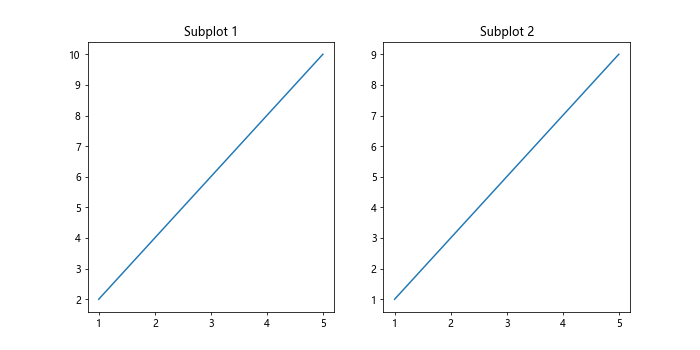
The above code will generate two subplots within a single figure.
Customization
Matplotlib allows for extensive customization of plots. Let’s customize a plot by changing colors, line styles, and markers.
import matplotlib.pyplot as plt

# Data
x = [1, 2, 3, 4, 5]
y = [2, 4, 6, 8, 10]

# Customization
plt.plot(x, y, color='red', linestyle='--', marker='o')
plt.xlabel('X-axis')
plt.ylabel('Y-axis')
plt.title('Customized Line Plot')
plt.show()
Output:
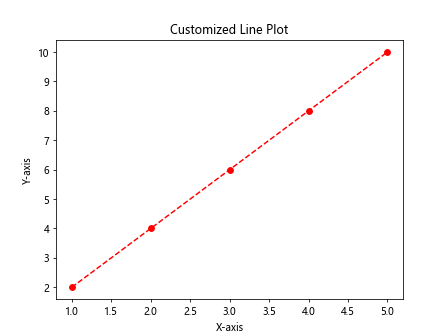
The above code will generate a customized line plot with a red color, dashed line style, and circle markers.
Annotations
Annotations can be used to add text or arrows to specific points on a plot. Let’s add annotations to a plot using Matplotlib.
import matplotlib.pyplot as plt

# Data
x = [1, 2, 3, 4, 5]
y = [2, 4, 6, 8, 10]

# Create a plot
plt.plot(x, y)
plt.xlabel('X-axis')
plt.ylabel('Y-axis')
plt.title('Annotated Line Plot')

# Annotate a point
plt.annotate('Point of Interest', (3, 6), xytext=(4, 8), arrowprops=dict(arrowstyle='->'))
plt.show()
Output:
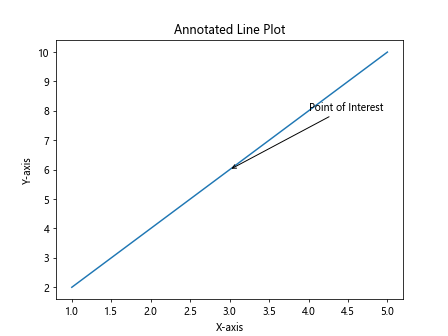
The above code will generate a line plot with an annotation at the point (3,6).
Logarithmic Scale
Matplotlib supports logarithmic scales for both x and y axes. Let’s create a plot with a logarithmic scale using Matplotlib.
import matplotlib.pyplot as plt

# Data
x = [1, 10, 100, 1000, 10000]
y = [1, 2, 3, 4, 5]

# Create a plot with logarithmic scale
plt.plot(x, y)
plt.xscale('log')
plt.yscale('log')
plt.xlabel('X-axis (log scale)')
plt.ylabel('Y-axis (log scale)')
plt.title('Logarithmic Scale Plot')
plt.show()
Output:
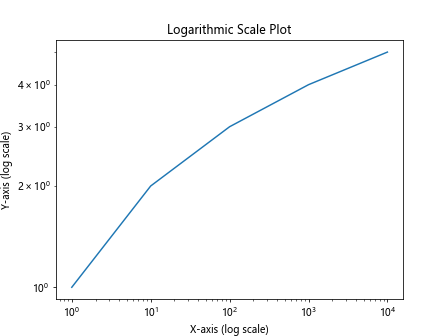
The above code will generate a plot with both x and y axes on a logarithmic scale.
Error Bars
Error bars are used to show the uncertainty in data points. Let’s add error bars to a plot using Matplotlib.
import matplotlib.pyplot as plt

# Data
x = [1, 2, 3, 4, 5]
y = [2, 4, 6, 8, 10]
errors = [0.5, 0.3, 0.4, 0.6, 0.8]

# Create a plot with error bars
plt.errorbar(x, y, yerr=errors, fmt='o', capsize=5)
plt.xlabel('X-axis')
plt.ylabel('Y-axis')
plt.title('Error Bar Plot')
plt.show()
Output:
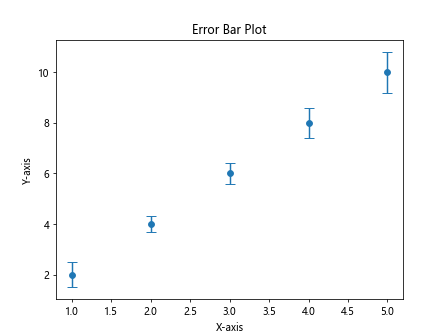
The above code will generate a plot with error bars for each data point.
3D Plot
Matplotlib can also create 3D plots to visualize three-dimensional data. Let’s create a simple 3D plot using Matplotlib.
import matplotlib.pyplot as plt
from mpl_toolkits.mplot3d import Axes3D
import numpy as np

# Data
x = np.linspace(-5, 5, 100)
y = np.linspace(-5, 5, 100)
x, y = np.meshgrid(x, y)
z = np.sin(np.sqrt(x**2 + y**2))

# Create a 3D plot
fig = plt.figure()
ax = fig.add_subplot(111, projection='3d')
ax.plot_surface(x, y, z)
ax.set_xlabel('X-axis')
ax.set_ylabel('Y-axis')
ax.set_zlabel('Z-axis')
plt.title('3D Plot')
plt.show()
Output:
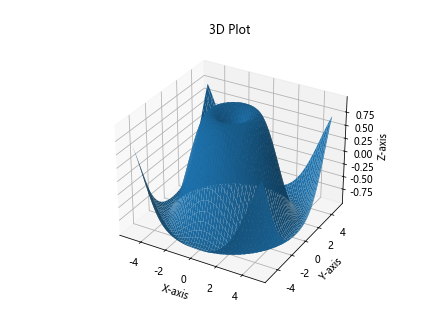
The above code will generate a 3D plot of the function## Multiple Plots
Matplotlib allows us to create multiple plots within a single figure. Let’s create multiple line plots in a single figure using Matplotlib.
import matplotlib.pyplot as plt

# Data
x = [1, 2, 3, 4, 5]
y1 = [2, 4, 6, 8, 10]
y2 = [1, 3, 5, 7, 9]

# Create multiple plots
plt.plot(x, y1, label='Line 1')
plt.plot(x, y2, label='Line 2')
plt.xlabel('X-axis')
plt.ylabel('Y-axis')
plt.title('Multiple Line Plots')
plt.legend()
plt.show()
Output:
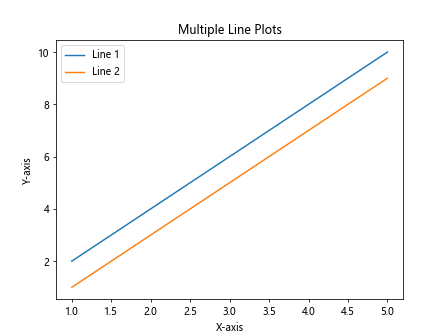
The above code will generate a figure with two line plots in the same graph.
Subplots
Matplotlib can create subplots with different layouts. Let’s create multiple subplots with different layouts using Matplotlib.
import matplotlib.pyplot as plt

# Data
x = [1, 2, 3, 4, 5]
y1 = [2, 4, 6, 8, 10]
y2 = [1, 3, 5, 7, 9]

# Create subplots with different layouts
plt.figure(figsize=(10, 5))

plt.subplot(2, 1, 1)
plt.plot(x, y1)
plt.title('Subplot 1')

plt.subplot(2, 2, 3)
plt.plot(x, y2)
plt.title('Subplot 2')

plt.subplot(2, 2, 4)
plt.scatter(x, y2)
plt.title('Subplot 3')

plt.show()
Output:
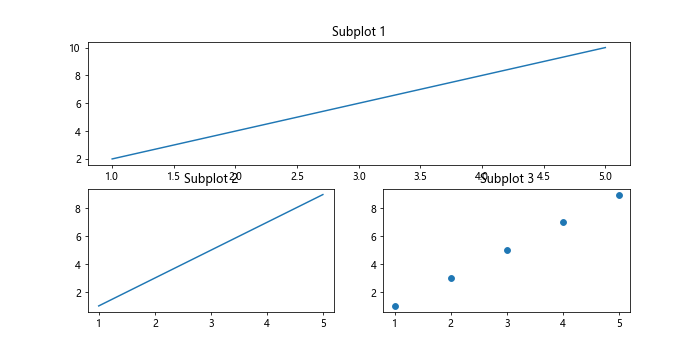
The above code will generate multiple subplots with different layouts within a single figure.
Polar Plot
Matplotlib can create polar plots for visualizing data in a circular coordinate system. Let’s create a simple polar plot using Matplotlib.
import matplotlib.pyplot as plt
import numpy as np

# Data
r = np.linspace(0, 2*np.pi, 100)
theta = np.sin(2*r)**2

# Create a polar plot
plt.figure()
ax = plt.subplot(111, projection='polar')
ax.plot(r, theta)
plt.title('Polar Plot')
plt.show()
Output:
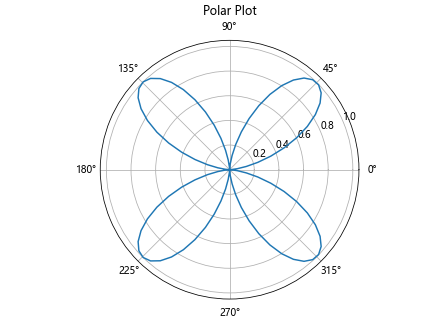
The above code will generate a polar plot of the function sin(2r)^2.
Heatmap
Heatmaps are used to visualize data in a matrix form. Let’s create a simple heatmap using Matplotlib.
import matplotlib.pyplot as plt
import numpy as np

# Data
data = np.random.rand(10, 10)

# Create a heatmap
plt.imshow(data, cmap='hot', interpolation='nearest')
plt.colorbar()
plt.title('Heatmap')
plt.show()
Output:
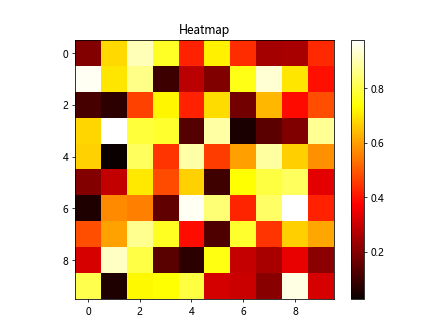
The above code will generate a heatmap of random data using the ‘hot’ colormap.
Contour Plot
Contour plots are used to represent three-dimensional data on a two-dimensional graph. Let’s create a simple contour plot using Matplotlib.
import matplotlib.pyplot as plt
import numpy as np

# Data
x = np.linspace(-5, 5, 100)
y = np.linspace(-5, 5, 100)
x, y = np.meshgrid(x, y)
z = np.sin(np.sqrt(x**2 + y**2))

# Create a contour plot
plt.contourf(x, y, z, levels=20, cmap='RdGy')
plt.colorbar()
plt.title('Contour Plot')
plt.show()
Output:
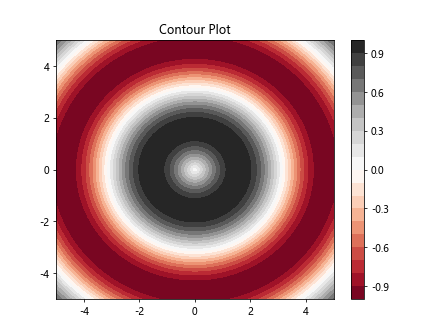
The above code will generate a contour plot of the function sin(sqrt(x^2 + y^2)).
Boxplot
Boxplots are used to visualize the distribution of a dataset as well as identify outliers. Let’s create a simple boxplot using Matplotlib.
import matplotlib.pyplot as plt
import numpy as np

# Data
data = [np.random.normal(0, std, 100) for std in range(1, 4)]

# Create a boxplot
plt.boxplot(data)
plt.xticks([1, 2, 3], ['A', 'B', 'C'])
plt.xlabel('Groups')
plt.ylabel('Values')
plt.title('Boxplot')
plt.show()
Output:
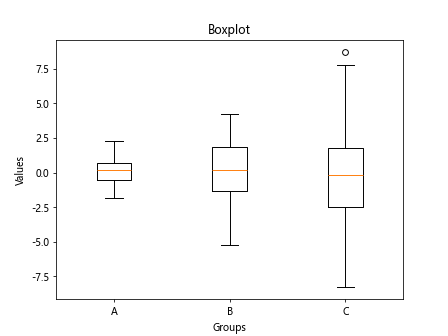
The above code will generate a boxplot for three groups of data.
3D Scatter Plot
Matplotlib can also create 3D scatter plots to visualize three-dimensional data. Let’s create a simple 3D scatter plot using Matplotlib.
import matplotlib.pyplot as plt
from mpl_toolkits.mplot3d import Axes3D
import numpy as np

# Data
x = np.random.rand(100)
y = np.random.rand(100)
z = np.random.rand(100)

# Create a 3D scatter plot
fig = plt.figure()
ax = fig.add_subplot(111, projection='3d')
ax.scatter(x, y, z)
ax.set_xlabel('X-axis')
ax.set_ylabel('Y-axis')
ax.set_zlabel('Z-axis')
plt.title('3D Scatter Plot')
plt.show()
Output:
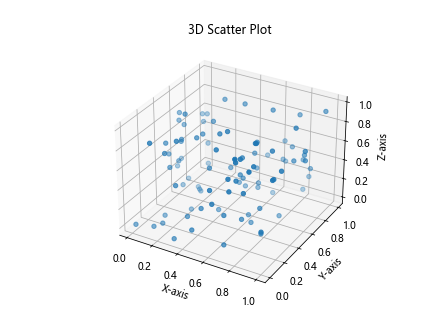
The above code will generate a 3D scatter plot of random data.
Matplotlib Plot Conclusion
In this article, we have explored various types of plots that can be created using Matplotlib in Python. We have covered line plots, scatter plots, bar plots, pie charts, histograms, subplots, customization, annotations, logarithmic scale, error bars, 3D plots, multiple plots, subplots, polar plots, heatmaps, contour plots, boxplots, and 3D scatter plots. Matplotlib provides extensive customization options to create visually appealing and informative plots for data visualization. Experiment with the provided examples and explore the full potential of Matplotlib for your plotting needs.