Matplotlib Plot Line
Matplotlib is a popular data visualization library in Python, used to create high-quality plots, charts, and figures. One common type of plot that can be created using Matplotlib is a line plot. In this article, we will explore how to create line plots using Matplotlib.
Basic Line Plot
The simplest way to create a line plot in Matplotlib is to use the plot function. Let’s start by creating a basic line plot with some random data.
import matplotlib.pyplot as plt
import numpy as np
# Generate some random data
x = np.linspace(0, 10, 100)
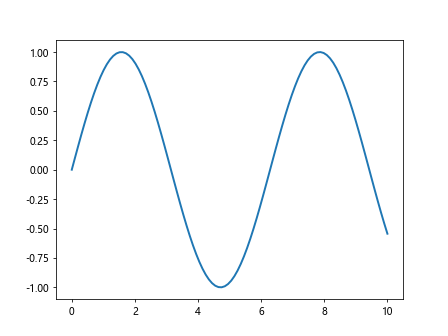
y = np.sin(x)
# Create a line plot
plt.plot(x, y)
plt.show()
Output:
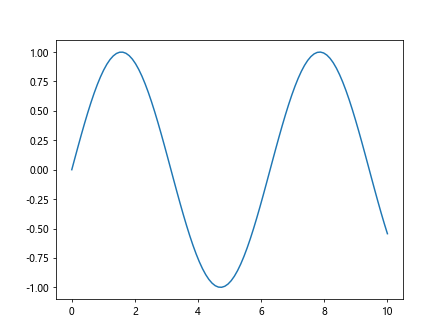
In this example, we generated an array x from 0 to 10 with 100 evenly spaced points, and then calculated the sine of x to get the array y. We then plotted x against y using the plot function and displayed the plot using plt.show().
Customizing Line Plots
Matplotlib allows for a high degree of customization when it comes to line plots. You can change the color, style, and thickness of the lines, as well as add markers to data points. Let’s look at some examples:
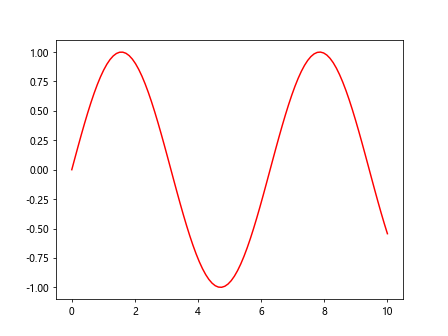
Changing Line Color
You can specify the color of the line using the color parameter in the plot function.
import matplotlib.pyplot as plt
import numpy as np

# Generate some random data
x = np.linspace(0, 10, 100)
y = np.sin(x)

# Create a line plot with a red line
plt.plot(x, y, color='red')
plt.show()
Output:
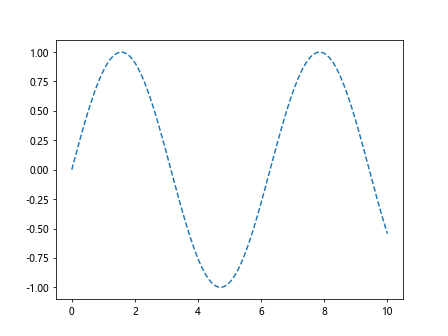
Changing Line Style
You can specify the style of the line using the linestyle parameter in the plot function.
import matplotlib.pyplot as plt
import numpy as np

# Generate some random data
x = np.linspace(0, 10, 100)
y = np.sin(x)

# Create a line plot with a dashed line
plt.plot(x, y, linestyle='dashed')
plt.show()
Output:
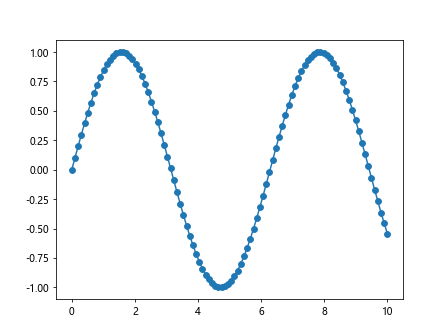
Adding Markers
You can add markers to data points using the marker parameter in the plot function.
import matplotlib.pyplot as plt
import numpy as np

# Generate some random data
x = np.linspace(0, 10, 100)
y = np.sin(x)

# Create a line plot with circular markers
plt.plot(x, y, marker='o')
plt.show()
Output:
Changing Line Thickness
You can specify the thickness of the line using the linewidth parameter in the plot function.
import matplotlib.pyplot as plt
import numpy as np

# Generate some random data
x = np.linspace(0, 10, 100)
y = np.sin(x)

# Create a line plot with a thicker line
plt.plot(x, y, linewidth=2)
plt.show()
Output:
Multiple Line Plots
You can plot multiple lines on the same plot by calling the plot function multiple times.
import matplotlib.pyplot as plt
import numpy as np

# Generate some random data
x = np.linspace(0, 10, 100)
y = np.sin(x)

# Generate some more random data
y2 = np.cos(x)

# Create a plot with two lines
plt.plot(x, y, label='sin(x)')
plt.plot(x, y2, label='cos(x)')
plt.legend()
plt.show()
Output:
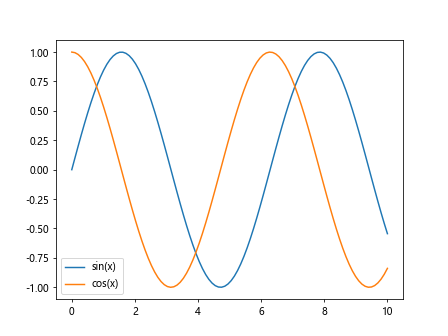
In this example, we generated the cosine of x and plotted it on the same plot with the sine of x. We also added a legend to differentiate between the two lines.
Subplots
You can create multiple subplots within the same figure using the subplot function.
import matplotlib.pyplot as plt
import numpy as np

# Generate some random data
x = np.linspace(0, 10, 100)
y = np.sin(x)

# Create a figure with two subplots
plt.subplot(2, 1, 1)
plt.plot(x, y)

plt.subplot(2, 1, 2)
plt.plot(x, y2)
plt.show()
In this example, we created a figure with two subplots arranged vertically. We plotted the sine of x on the first subplot and the cosine of x on the second subplot.
Adding Labels and Titles
You can add labels to the x-axis, y-axis, and a title to your plot using the xlabel, ylabel, and title functions, respectively.
import matplotlib.pyplot as plt
import numpy as np
# Generate some random data
x = np.linspace(0, 10, 100)
y = np.sin(x)
# Add labels and a title to the plot
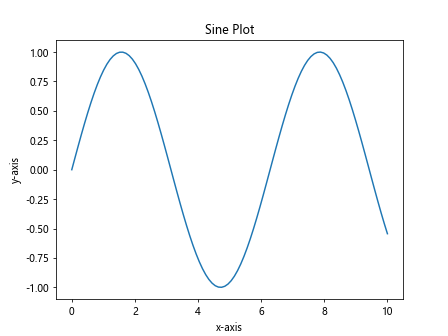
plt.plot(x, y)
plt.xlabel('x-axis')
plt.ylabel('y-axis')
plt.title('Sine Plot')
plt.show()
Output:
Saving Plots
You can save your plots as image files using the savefig function.
import matplotlib.pyplot as plt
import numpy as np

# Generate some random data
x = np.linspace(0, 10, 100)
y = np.sin(x)

# Save the plot as a PNG file
plt.plot(x, y)
plt.savefig('sine_plot.png')
Matplotlib Plot Line Conclusion
In this article, we have explored how to create line plots using Matplotlib. We have covered the basics of creating line plots, customizing them, plotting multiple lines, creating subplots, adding labels and titles, and saving plots as image files. With the knowledge gained from this article, you should be able to create a wide variety of line plots using Matplotlib.