Setting Plot Size in Matplotlib
Matplotlib is a powerful visualization library in Python that allows you to create a wide range of plots and charts. One important aspect of creating visually appealing plots is setting the size of the plot. In this article, we will explore different ways to set the plot size in Matplotlib.
Method 1: Using figure(figsize)
The figure(figsize) method in Matplotlib allows you to specify the width and height of the figure in inches. Here’s an example:
import matplotlib.pyplot as plt

plt.figure(figsize=(10, 6))
plt.plot([1, 2, 3, 4], [1, 4, 9, 16])
plt.title("Plot with custom size using figure(figsize)")
plt.xlabel("X-axis")
plt.ylabel("Y-axis")
plt.show()
Output:
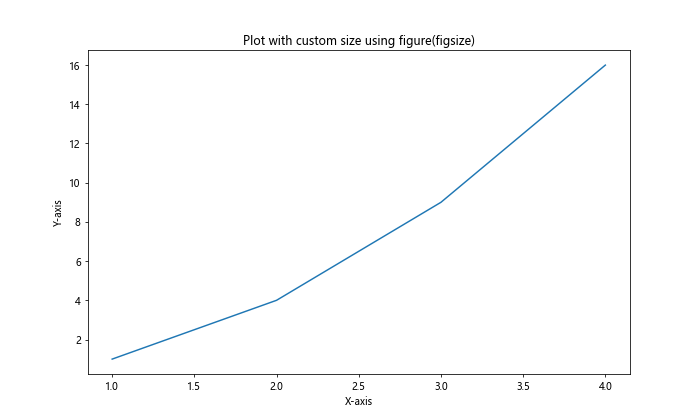
In this example, we are creating a plot with a width of 10 inches and a height of 6 inches. You can adjust the width and height values to customize the plot size.
Method 2: Using subplots_adjust
The subplots_adjust method in Matplotlib allows you to adjust the spacing around subplots. You can use this method to effectively control the size of the plot. Here’s an example:
import matplotlib.pyplot as plt

plt.subplots_adjust(left=0.1, right=0.9, top=0.9, bottom=0.1)
plt.plot([1, 2, 3, 4], [1, 4, 9, 16])
plt.title("Plot with custom size using subplots_adjust")
plt.xlabel("X-axis")
plt.ylabel("Y-axis")
plt.show()
Output:
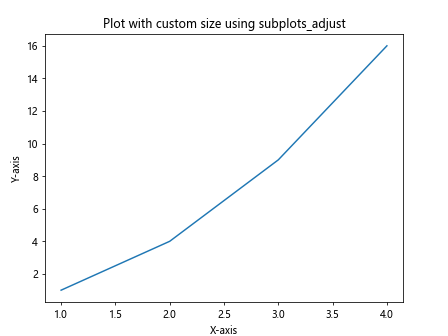
In this example, we are adjusting the spacing around the plot to control the size of the plot. You can modify the values of left, right, top, and bottom to customize the plot size.
Method 3: Using rcParams
You can also set the default figure size for all plots in Matplotlib by modifying the rcParams dictionary. Here’s an example:
import matplotlib.pyplot as plt
import matplotlib

matplotlib.rcParams['figure.figsize'] = (8, 6)
plt.plot([1, 2, 3, 4], [1, 4, 9, 16])
plt.title("Plot with default size using rcParams")
plt.xlabel("X-axis")
plt.ylabel("Y-axis")
plt.show()
Output:
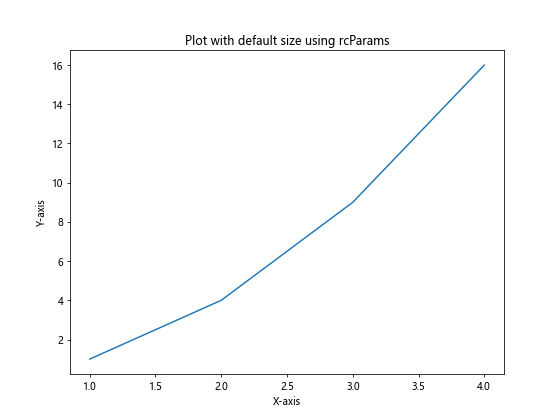
By setting the value of figure.figsize in the rcParams dictionary, you can change the default figure size for all plots in Matplotlib.
Method 4: Using set_size_inches
The set_size_inches method allows you to change the size of a plot after it has been created. Here’s an example:
import matplotlib.pyplot as plt

fig, ax = plt.subplots()
ax.plot([1, 2, 3, 4], [1, 4, 9, 16])
fig.set_size_inches(12, 8)
plt.title("Plot with custom size using set_size_inches")
plt.xlabel("X-axis")
plt.ylabel("Y-axis")
plt.show()
Output:
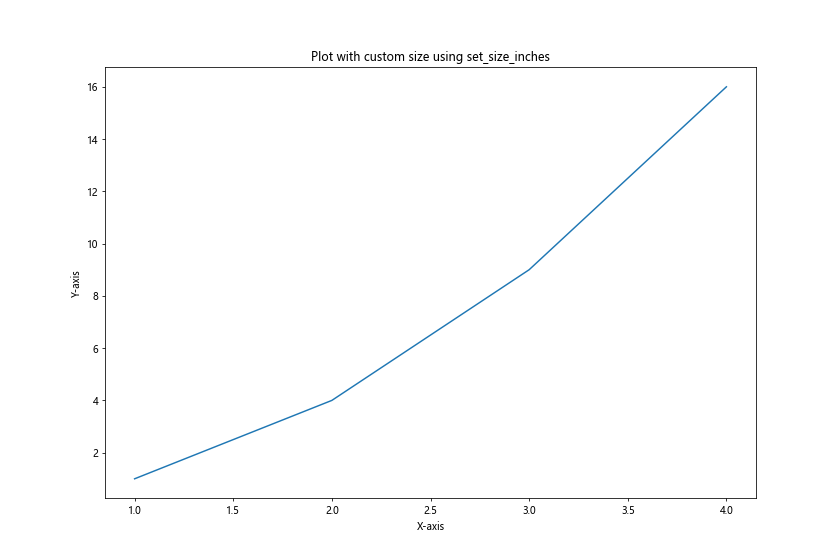
In this example, we are setting the size of the plot to 12 inches width and 8 inches height after creating the plot.
Method 5: Using figsize within subplots
You can also specify the figure size directly when creating subplots using the figsize parameter. Here’s an example:
import matplotlib.pyplot as plt

fig, ax = plt.subplots(figsize=(8, 4))
ax.plot([1, 2, 3, 4], [1, 4, 9, 16])
plt.title("Plot with custom size using figsize in subplots")
plt.xlabel("X-axis")
plt.ylabel("Y-axis")
plt.show()
Output:
By providing the figsize parameter when creating subplots, you can set the size of the plot at the same time.
Method 6: Using set_figure
The set_figure method allows you to change the figure size of an existing plot. Here’s an example:
import matplotlib.pyplot as plt

fig, ax = plt.subplots()
ax.plot([1, 2, 3, 4], [1, 4, 9, 16])
new_fig = plt.figure(figsize=(8, 6))
ax.set_figure(new_fig)
plt.title("Plot with custom size using set_figure")
plt.xlabel("X-axis")
plt.ylabel("Y-axis")
plt.show()
In this example, we are creating a new figure with a custom size and then setting it as the figure for the existing plot.
Method 7: Using gcf and gca
You can also change the figure size and plot size using the gcf() (get current figure) and gca() (get current axis) methods. Here’s an example:
import matplotlib.pyplot as plt

plt.plot([1, 2, 3, 4], [1, 4, 9, 16])
plt.gcf().set_size_inches(9, 6)
plt.title("Plot with custom size using gcf")
plt.xlabel("X-axis")
plt.ylabel("Y-axis")
plt.show()
Output:

By using gcf() to get the current figure and set_size_inches to set the figure size, you can customize the size of the plot.
Method 8: Using set_figsize
The set_figsize method provided by matplotlib_inlineextension in Jupyter notebooks allows you to set the size of the figure. Here’s an example:
%matplotlib inline
import matplotlib.pyplot as plt

plt.figure().set_figsize([10, 8])
plt.plot([1, 2, 3, 4], [1, 4, 9, 16])
plt.title("Plot with custom size using set_figsize")
plt.xlabel("X-axis")
plt.ylabel("Y-axis")
plt.show()
By using set_figsize in a Jupyter notebook with the matplotlib_inline extension, you can easily set the size of the figure.
Method 9: Using rcParams in Jupyter
You can also set the default figure size for all plots in Jupyter notebooks by modifying the rcParams dictionary. Here’s an example:
%matplotlib inline
import matplotlib.pyplot as plt
import matplotlib

matplotlib.rcParams['figure.figsize'] = (10, 6)
plt.plot([1, 2, 3, 4], [1, 4, 9, 16])
plt.title("Plot with default size using rcParams in Jupyter")
plt.xlabel("X-axis")
plt.ylabel("Y-axis")
plt.show()
By changing the value of figure.figsize in the rcParams dictionary, you can set the default figure size for all plots in Jupyter notebooks.
Method 10: Using set_size
The set_size method provided by the IPython.core.display module in Jupyter notebooks allows you to set the size of the output figure. Here’s an example:
from IPython.core.display import display
import matplotlib.pyplot as plt
import matplotlib

fig, ax = plt.subplots()
ax.plot([1, 2, 3, 4], [1, 4, 9, 16])
display(fig.set_size(10, 7))
plt.title("Plot with custom size using set_size")
plt.xlabel("X-axis")
plt.ylabel("Y-axis")
plt.show()
By using set_size from IPython.core.display, you can set the size of the output figure in a Jupyter notebook.
These are some of the methods you can use to set the plot size in Matplotlib. Experiment with these methods and customize the plot size according to your needs to create visually appealing and informative plots.