Setting Title in Matplotlib Figures
In Matplotlib, the title of a figure provides important context to the data being displayed. In this article, we will explore different ways to set titles in Matplotlib figures, including setting the main title, subtitle, and individual titles for each subplot.
Set Main Title for a Figure
To set the main title for a figure in Matplotlib, you can use the suptitle() method. This allows you to specify the title text and customize its appearance. Here is an example:
import matplotlib.pyplot as plt

plt.figure()
plt.plot([1, 2, 3, 4], [1, 4, 9, 16])
plt.suptitle('Main Title: How2matplotlib.com')
plt.show()
Output:
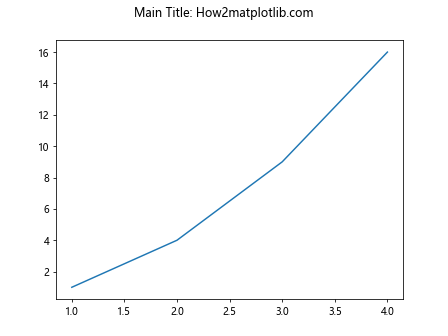
In this code snippet, plt.suptitle('Main Title: How2matplotlib.com') sets the main title of the figure to “Main Title: How2matplotlib.com”.
Set Subtitle for a Figure
Although Matplotlib does not have a built-in method for setting subtitles, you can achieve this by adding a text annotation to the figure. Here is an example of how to add a subtitle to a figure:
import matplotlib.pyplot as plt

plt.figure()
plt.plot([1, 2, 3, 4], [1, 4, 9, 16])
plt.text(2, 10, 'Subtitle: How2matplotlib.com', fontsize=12, ha='center')
plt.show()
Output:
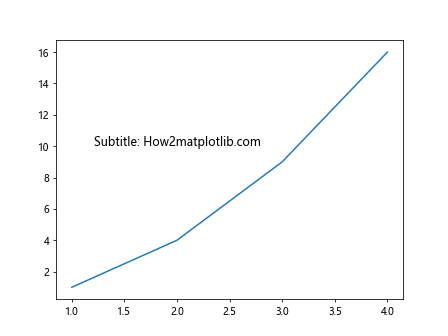
In this code snippet, plt.text(2, 10, 'Subtitle: How2matplotlib.com', fontsize=12, ha='center') adds a subtitle to the figure at coordinates (2, 10) with the text “Subtitle: How2matplotlib.com”.
Set Title for Subplots
When creating multiple subplots in Matplotlib, you can set individual titles for each subplot using the set_title() method of the Axes object. Here is an example:
import matplotlib.pyplot as plt

fig, axs = plt.subplots(2, 2)

axs[0, 0].plot([1, 2, 3, 4], [1, 4, 9, 16])
axs[0, 0].set_title('Subplot 1: How2matplotlib.com')
axs[0, 1].plot([1, 2, 3, 4], [1, 4, 9, 16])
axs[0, 1].set_title('Subplot 2: How2matplotlib.com')
axs[1, 0].plot([1, 2, 3, 4], [1, 4, 9, 16])
axs[1, 0].set_title('Subplot 3: How2matplotlib.com')
axs[1, 1].plot([1, 2, 3, 4], [1, 4, 9, 16])
axs[1, 1].set_title('Subplot 4: How2matplotlib.com')

plt.tight_layout()
plt.show()
Output:
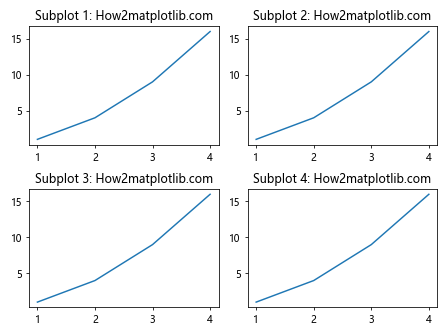
In this code snippet, axs[0, 0].set_title('Subplot 1: How2matplotlib.com') sets the title for the first subplot to “Subplot 1: How2matplotlib.com”.
Customizing Title Appearance
Matplotlib allows you to customize the appearance of titles by specifying parameters such as font size, font weight, font style, color, and alignment. Here is an example that demonstrates different title customization options:
import matplotlib.pyplot as plt

plt.figure()
plt.plot([1, 2, 3, 4], [1, 4, 9, 16])
plt.title('Customized Title: How2matplotlib.com', fontsize=20, fontweight='bold', fontstyle='italic', color='red', loc='right', pad=20)
plt.show()
Output:
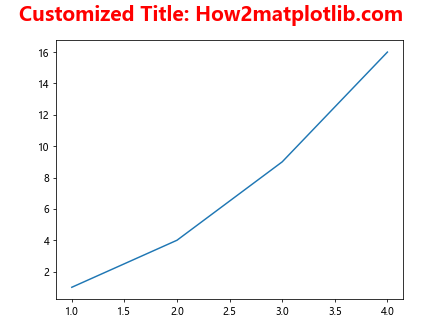
In this code snippet, we use the fontsize, fontweight, fontstyle, color, loc, and pad parameters of the title() method to customize the appearance of the title.
Using LaTeX in Titles
Matplotlib also supports LaTeX formatting in titles, allowing you to include complex mathematical expressions and symbols. Here is an example that demonstrates the use of LaTeX in titles:
import matplotlib.pyplot as plt

plt.figure()
plt.plot([1, 2, 3, 4], [1, 4, 9, 16])
plt.title(r'$\int_0^{\infty} e^{-x^2} \, dx$', fontsize=16)
plt.show()
Output:
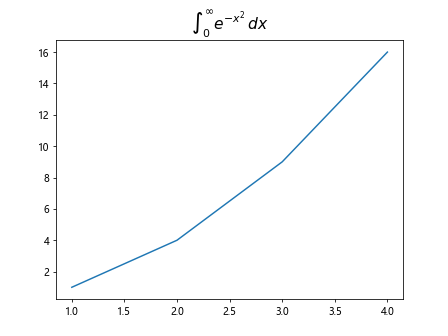
In this code snippet, plt.title(r'$\int_0^{\infty} e^{-x^2} \, dx$', fontsize=16) includes a LaTeX expression for the integral of the Gaussian function in the title.
Dynamic Titles with Variables
You can dynamically update titles in Matplotlib by using variables to hold the title text. This allows you to programmatically change the title based on data or user input. Here is an example:
import matplotlib.pyplot as plt

title_text = 'Dynamic Title: How2matplotlib.com'

plt.figure()
plt.plot([1, 2, 3, 4], [1, 4, 9, 16])
plt.title(title_text)
plt.show()
Output:
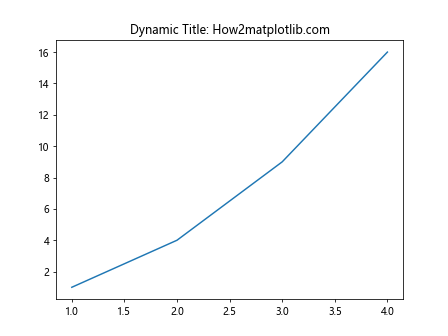
In this code snippet, the title text is stored in the variable title_text, allowing you to easily update the title by changing the value of the variable.
Multi-Line Titles
Matplotlib also supports multi-line titles, where you can display titles on multiple lines for better readability. Here is an example that demonstrates how to create a multi-line title:
import matplotlib.pyplot as plt

plt.figure()
plt.plot([1, 2, 3, 4], [1, 4, 9, 16])
plt.title('Multi-Line\nTitle: How2matplotlib.com', fontsize=16)
plt.show()
Output:
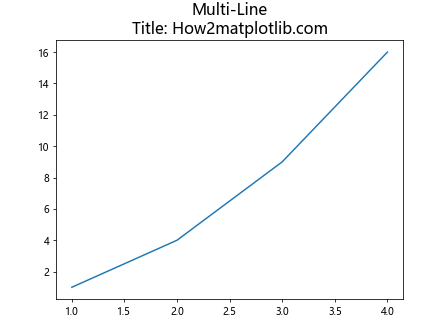
In this code snippet, plt.title('Multi-Line\nTitle: How2matplotlib.com', fontsize=16) creates a multi-line title with the text “Multi-Line” on the first line and “Title: How2matplotlib.com” on the second line.
Setting Title Position
By default, the title in Matplotlib is centered at the top of the figure. However, you can adjust the title position using the loc parameter to align the title to the left, right, or center. Here is an example:
import matplotlib.pyplot as plt

plt.figure()
plt.plot([1, 2, 3, 4], [1, 4, 9, 16])
plt.title('Title: How2matplotlib.com', loc='left', fontsize=16)
plt.show()
Output:
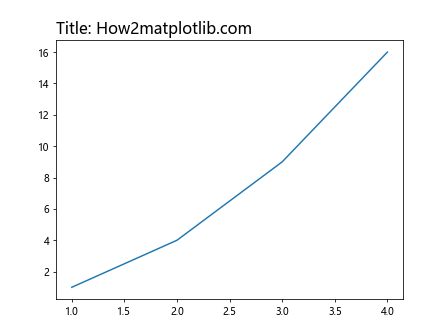
In this code snippet, plt.title('Title: How2matplotlib.com', loc='left', fontsize=16) aligns the title to the left of the figure.
Adding a Background Color to Titles
You can enhance the visibility of titles in Matplotlib figures by adding a background color to them. This can help differentiate titles from the rest of the plot. Here is an example that demonstrates how to add a background color to a title:
import matplotlib.pyplot as plt

plt.figure()
plt.plot([1, 2, 3, 4], [1, 4, 9, 16])
plt.title('Title: How2matplotlib.com', fontsize=16, backgroundcolor='lightblue')
plt.show()
Output:
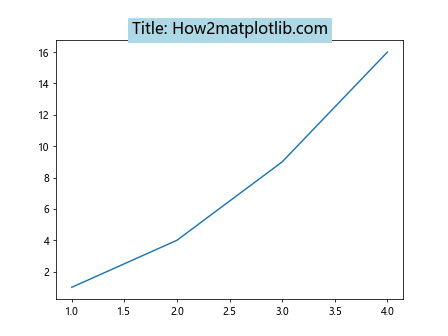
In this code snippet, plt.title('Title: How2matplotlib.com', fontsize=16, backgroundcolor='lightblue') adds a light blue background color to the title.
Rotating Titles
To rotate titles in Matplotlib, you can use the rotation parameter to specify the angle of rotation in degrees. This can be useful when you have long titles that need to be displayed vertically or diagonally. Here is an example:
import matplotlib.pyplot as plt

plt.figure()
plt.plot([1, 2, 3, 4], [1, 4, 9, 16])
plt.title('Rotated Title: How2matplotlib.com', fontsize=16, rotation=45)
plt.show()
Output:
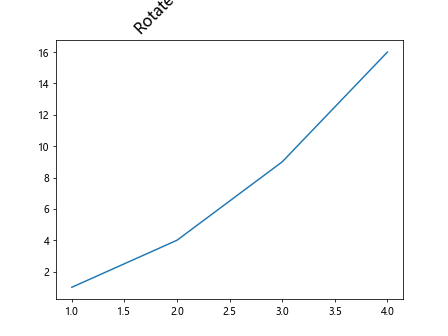
In this code snippet, plt.title('Rotated Title: How2matplotlib.com', fontsize=16, rotation=45) rotates the title by 45 degrees.
Controlling Title Padding
You can adjust the padding around titles in Matplotlib using the pad parameter. Thisallows you to control the spacing between the title text and the surrounding elements of the plot. Here is an example that demonstrates how to adjust the title padding:
import matplotlib.pyplot as plt

plt.figure()
plt.plot([1, 2, 3, 4], [1, 4, 9, 16])
plt.title('Title with Padding: How2matplotlib.com', fontsize=16, pad=20)
plt.show()
Output:
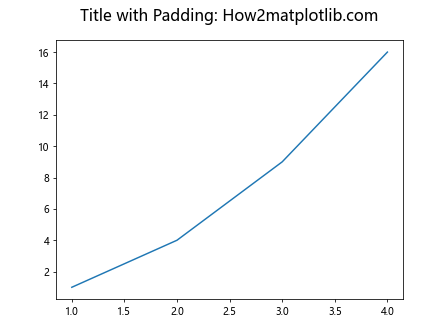
In this code snippet, plt.title('Title with Padding: How2matplotlib.com', fontsize=16, pad=20) sets the padding around the title to 20 points.
Using Math Text in Titles
Matplotlib supports the use of Math text in titles, allowing you to include mathematical symbols, equations, and expressions. This feature is particularly useful when working with scientific data visualizations. Here is an example that demonstrates how to use Math text in titles:
import matplotlib.pyplot as plt

plt.figure()
plt.plot([1, 2, 3, 4], [1, 4, 9, 16])
plt.title(r'$\sum_{i=1}^n x_i$', fontsize=16)
plt.show()
Output:
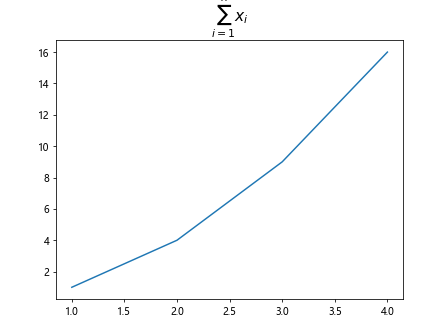
In this code snippet, plt.title(r'$\sum_{i=1}^n x_i$', fontsize=16) includes a Math text expression for the summation of x_i in the title.
Setting Titles for Different Elements
In Matplotlib, you can set titles for various elements, including the figure, subplots, axes, and legends. This allows you to provide context and descriptions for different parts of the plot. Here is an example that demonstrates setting titles for different elements:
import matplotlib.pyplot as plt

fig, axs = plt.subplots(1, 2)

fig.suptitle('Figure Title: How2matplotlib.com', fontsize=16)

for ax in axs:
    ax.plot([1, 2, 3, 4], [1, 4, 9, 16])
    ax.set_title('Subplot Title: How2matplotlib.com')

plt.show()
Output:
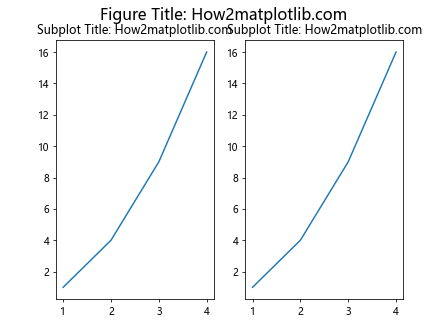
In this code snippet, fig.suptitle('Figure Title: How2matplotlib.com', fontsize=16) sets the title for the figure, while ax.set_title('Subplot Title: How2matplotlib.com') sets the title for each subplot.
Setting Title in Matplotlib Figures Conclusion
Setting titles in Matplotlib figures is a crucial aspect of data visualization, as it provides important context and descriptions for the displayed data. By using the techniques and examples provided in this article, you can effectively set main titles, subtitles, and individual titles for subplots in your Matplotlib figures. Experiment with different customization options, such as font size, style, alignment, and rotation, to create visually appealing and informative titles for your plots. By incorporating Math text, dynamic titles, and multi-line titles, you can enhance the readability and clarity of your visualizations. Remember to explore the various title settings for different elements, such as figures, subplots, axes, and legends, to fully customize your Matplotlib plots.