Errorbar Style in Matplotlib
Error bars are a useful tool in data visualization to display the variability or uncertainty in a measurement. Matplotlib provides the errorbar function that allows you to easily add error bars to your plots. In this article, we will explore various styles and customization options for error bars in Matplotlib.
Basic Errorbar Plot
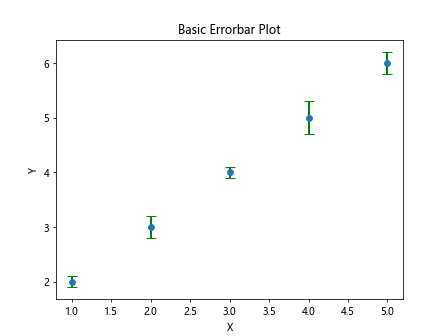
Let’s start by creating a basic errorbar plot using Matplotlib. We will plot a simple line graph with error bars representing the uncertainty in the data points.
import matplotlib.pyplot as plt

# Data
x = [1, 2, 3, 4, 5]
y = [2, 3, 4, 5, 6]
yerr = [0.1, 0.2, 0.1, 0.3, 0.2]

# Plot
plt.errorbar(x, y, yerr=yerr, fmt='o')
plt.xlabel('X')
plt.ylabel('Y')
plt.title('Basic Errorbar Plot')
plt.show()
Output:
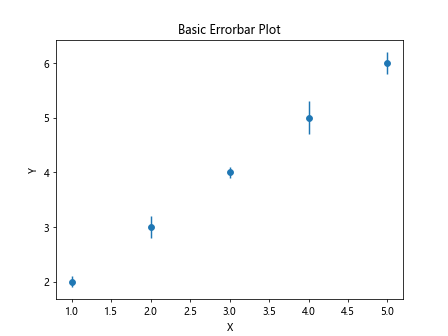
In this example, we use the fmt='o' parameter to specify the marker style for the data points. The yerr parameter is used to specify the error bars.
Customizing Errorbar Style
You can customize the style of error bars in Matplotlib by changing various parameters such as line width, color, cap size, and more. Let’s look at some examples of how to customize the error bars.
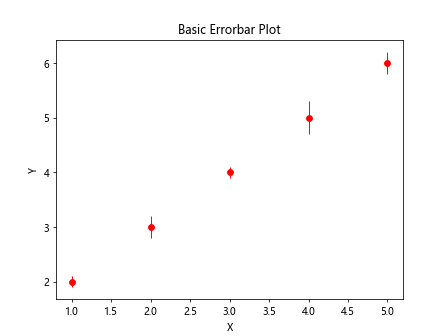
Changing Line Width and Color
import matplotlib.pyplot as plt

# Data
x = [1, 2, 3, 4, 5]
y = [2, 3, 4, 5, 6]
yerr = [0.1, 0.2, 0.1, 0.3, 0.2]

# Plot
plt.errorbar(x, y, yerr=yerr, fmt='o', linewidth=1, color='r')
plt.xlabel('X')
plt.ylabel('Y')
plt.title('Basic Errorbar Plot')
plt.show()
Output:
Changing Cap Size and Style
import matplotlib.pyplot as plt

# Data
x = [1, 2, 3, 4, 5]
y = [2, 3, 4, 5, 6]
yerr = [0.1, 0.2, 0.1, 0.3, 0.2]

# Plot
plt.errorbar(x, y, yerr=yerr, fmt='o', capsize=5, capthick=2, capstyle='round')
plt.xlabel('X')
plt.ylabel('Y')
plt.title('Basic Errorbar Plot')
plt.show()
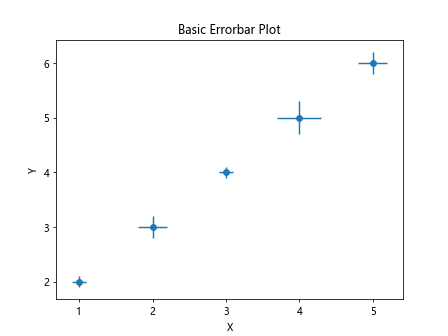
Adding Horizontal Error Bars
import matplotlib.pyplot as plt

# Data
x = [1, 2, 3, 4, 5]
y = [2, 3, 4, 5, 6]
yerr = [0.1, 0.2, 0.1, 0.3, 0.2]

# Plot
xerr = [0.1, 0.2, 0.1, 0.3, 0.2]
plt.errorbar(x, y, xerr=xerr, yerr=yerr, fmt='o')
plt.xlabel('X')
plt.ylabel('Y')
plt.title('Basic Errorbar Plot')
plt.show()
Output:
Customizing Error Bar Marker
import matplotlib.pyplot as plt

# Data
x = [1, 2, 3, 4, 5]
y = [2, 3, 4, 5, 6]
yerr = [0.1, 0.2, 0.1, 0.3, 0.2]

# Plot
xerr = [0.1, 0.2, 0.1, 0.3, 0.2]
plt.errorbar(x, y, yerr=yerr, fmt='o', marker='s', markersize=8)
plt.xlabel('X')
plt.ylabel('Y')
plt.title('Basic Errorbar Plot')
plt.show()
Errorbar Styles
Matplotlib provides different error bar styles that can be used to represent different types of data. Let’s explore some common error bar styles and when to use them.
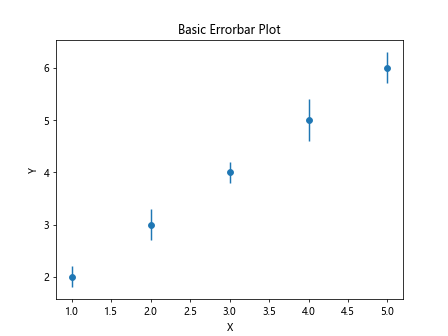
Standard Deviation Error Bars
import matplotlib.pyplot as plt

# Data
x = [1, 2, 3, 4, 5]
y = [2, 3, 4, 5, 6]
yerr = [0.1, 0.2, 0.1, 0.3, 0.2]

# Plot
xerr = [0.1, 0.2, 0.1, 0.3, 0.2]
stddev = [0.2, 0.3, 0.2, 0.4, 0.3]
plt.errorbar(x, y, yerr=stddev, fmt='o', label='Std Deviation')
plt.xlabel('X')
plt.ylabel('Y')
plt.title('Basic Errorbar Plot')
plt.show()
Output:
Confidence Interval Error Bars
import matplotlib.pyplot as plt

# Data
x = [1, 2, 3, 4, 5]
y = [2, 3, 4, 5, 6]
yerr = [0.1, 0.2, 0.1, 0.3, 0.2]

# Plot
xerr = [0.1, 0.2, 0.1, 0.3, 0.2]
ci_low = [1.8, 2.7, 3.8, 4.6, 5.5]
ci_high = [2.2, 3.3, 4.2, 5.4, 6.3]
plt.errorbar(x, y, yerr=[y-ci_low, ci_high-y], fmt='o', label='Confidence Interval')
plt.xlabel('X')
plt.ylabel('Y')
plt.title('Basic Errorbar Plot')
plt.show()
Custom Errorbar Style
You can also create custom error bar styles in Matplotlib by specifying individual properties for each error bar.
import matplotlib.pyplot as plt

# Data
x = [1, 2, 3, 4, 5]
y = [2, 3, 4, 5, 6]
yerr = [0.1, 0.2, 0.1, 0.3, 0.2]

# Plot
xerr = [0.1, 0.2, 0.1, 0.3, 0.2]
plt.errorbar(x, y, yerr=[0.1, 0.2, 0.1, 0.3, 0.2], fmt='o', elinewidth=2, ecolor='g', capsize=5)
plt.xlabel('X')
plt.ylabel('Y')
plt.title('Basic Errorbar Plot')
plt.show()
Output:
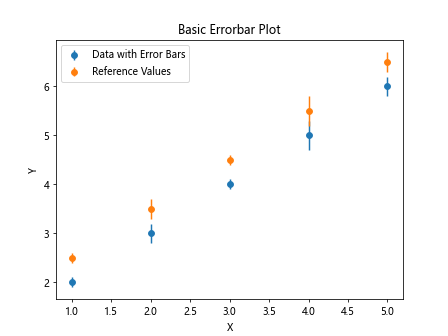
Adding Errorbar Labels
You can add labels to the error bars to provide additional information about the uncertainty in the data. Let’s see how to add labels to the error bars.
import matplotlib.pyplot as plt

# Data
x = [1, 2, 3, 4, 5]
y = [2, 3, 4, 5, 6]
yerr = [0.1, 0.2, 0.1, 0.3, 0.2]

# Plot
xerr = [0.1, 0.2, 0.1, 0.3, 0.2]
plt.errorbar(x, y, yerr=yerr, fmt='o', label='Data with Error Bars')
plt.errorbar(x, [2.5, 3.5, 4.5, 5.5, 6.5], yerr=[0.1, 0.2, 0.1, 0.3, 0.2], fmt='o', label='Reference Values')
plt.legend()
plt.xlabel('X')
plt.ylabel('Y')
plt.title('Basic Errorbar Plot')
plt.show()
Output:
Advanced Errorbar Customization
Matplotlib provides advanced customization options for error bars, such as adjusting the error bar line style, shadow effect, and more. Let’s explore some advanced customization options for error bars.
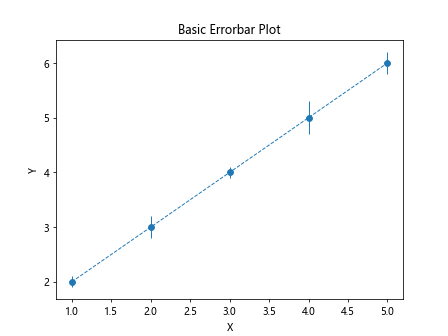
Changing Error Bar Line Style
import matplotlib.pyplot as plt

# Data
x = [1, 2, 3, 4, 5]
y = [2, 3, 4, 5, 6]
yerr = [0.1, 0.2, 0.1, 0.3, 0.2]

# Plot
xerr = [0.1, 0.2, 0.1, 0.3, 0.2]
plt.errorbar(x, y, yerr=yerr, fmt='o', linestyle='--', linewidth=1)
plt.xlabel('X')
plt.ylabel('Y')
plt.title('Basic Errorbar Plot')
plt.show()
Output:
Adding Error Bar Shadow Effect
import matplotlib.pyplot as plt

# Data
x = [1, 2, 3, 4, 5]
y = [2, 3, 4, 5, 6]
yerr = [0.1, 0.2, 0.1, 0.3, 0.2]

# Plot
xerr = [0.1, 0.2, 0.1, 0.3, 0.2]
plt.errorbar(x, y, yerr=yerr, fmt='o', capsize=5, error_kw={'elinewidth': 2, 'ecolor': 'k', 'alpha': 0.5})
plt.xlabel('X')
plt.ylabel('Y')
plt.title('Basic Errorbar Plot')
plt.show()
Advanced Marker Styles
import matplotlib.pyplot as plt

# Data
x = [1, 2, 3, 4, 5]
y = [2, 3, 4, 5, 6]
yerr = [0.1, 0.2, 0.1, 0.3, 0.2]

# Plot
xerr = [0.1, 0.2, 0.1, 0.3, 0.2]
plt.errorbar(x, y, yerr=yerr, fmt='o', marker='s', markersize=8, markerfacecolor='b', markeredgewidth=2, markeredgecolor='r')
plt.xlabel('X')
plt.ylabel('Y')
plt.title('Basic Errorbar Plot')
plt.show()
errorbar style matplotlib Conclusion
In this article, we have explored different errorbar styles and customization options in Matplotlib. By experimenting with various error bar styles and properties, you can create visually appealing and informative plots that effectively communicate the uncertainty in your data. Experiment with the examples provided to create error bar plots that suit your specific data visualization needs.