Errorbar in Matplotlib
Errorbars in Matplotlib are used to visually represent the uncertainty or variability in your data. They are commonly used in scientific and statistical plots to show the confidence intervals or standard deviations of the data points.
In this article, we will explore how to create errorbars in Matplotlib. We will cover different types of errorbars, customization options, and various examples to help you understand and implement errorbars effectively in your plots.
Basic Errorbars
Let’s start with the basics of creating errorbars in Matplotlib. We will generate a simple line plot with errorbars to demonstrate how they appear on the plot.
import matplotlib.pyplot as plt
import numpy as np

x = np.linspace(0, 10, 10)
y = np.sin(x)

# Define the error values
yerr = 0.1

plt.errorbar(x, y, yerr=yerr, fmt='o', color='b')
plt.show()
Output:
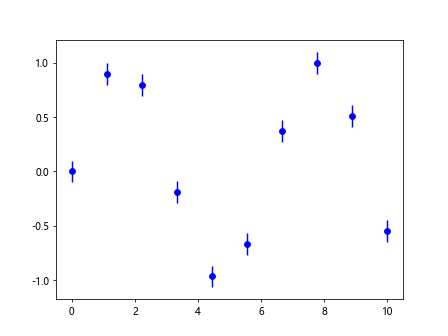
In this example, we have created a line plot with errorbars using the errorbar function. The yerr parameter specifies the length of the errorbars in the y-direction, and fmt specifies the format of the data points.
Different Errorbar Styles
Matplotlib provides various options to customize the appearance of errorbars. You can change the style, color, width, and capsize of the errorbars to make them more visually appealing.
Line Style
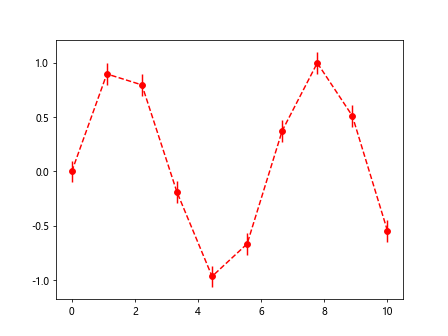
You can specify different line styles for the errorbars using the ls parameter. Let’s create errorbars with a dashed line style.
import matplotlib.pyplot as plt
import numpy as np

x = np.linspace(0, 10, 10)
y = np.sin(x)

# Define the error values
yerr = 0.1

plt.errorbar(x, y, yerr=yerr, fmt='o', ls='dashed', color='r')
plt.show()
Output:
Errorbar Color
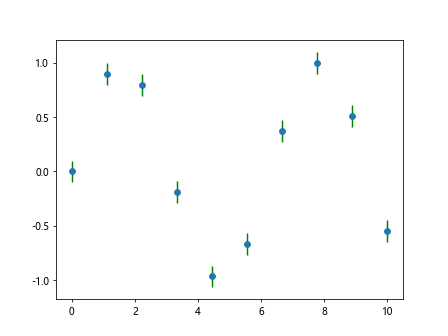
You can customize the color of the errorbars using the ecolor parameter. Let’s create errorbars with green color.
import matplotlib.pyplot as plt
import numpy as np

x = np.linspace(0, 10, 10)
y = np.sin(x)

# Define the error values
yerr = 0.1

plt.errorbar(x, y, yerr=yerr, fmt='o', ecolor='g')
plt.show()
Output:
Line Width
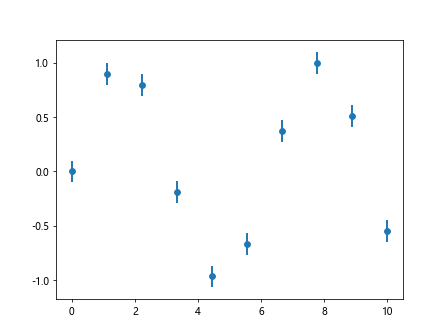
You can adjust the width of the errorbars using the linewidth parameter. Let’s create thicker errorbars.
import matplotlib.pyplot as plt
import numpy as np

x = np.linspace(0, 10, 10)
y = np.sin(x)

# Define the error values
yerr = 0.1

plt.errorbar(x, y, yerr=yerr, fmt='o', linewidth=2)
plt.show()
Output:
Capsize
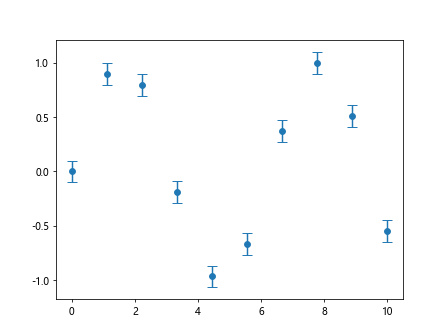
You can change the length of the errorbar caps using the capsize parameter. Let’s increase the capsize of the errorbars.
import matplotlib.pyplot as plt
import numpy as np

x = np.linspace(0, 10, 10)
y = np.sin(x)

# Define the error values
yerr = 0.1

plt.errorbar(x, y, yerr=yerr, fmt='o', capsize=5)
plt.show()
Output:
Vertical Errorbars
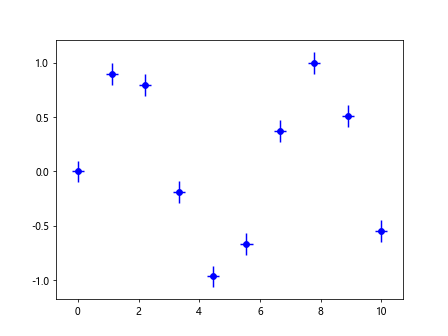
Errorbars can be specified separately for the x and y directions. Let’s create vertical errorbars by providing different error values for x and y.
import matplotlib.pyplot as plt
import numpy as np

x = np.linspace(0, 10, 10)
y = np.sin(x)

# Define the error values
yerr = 0.1
xerr = 0.2
plt.errorbar(x, y, xerr=xerr, yerr=yerr, fmt='o', color='b')
plt.show()
Output:
Horizontal Errorbars
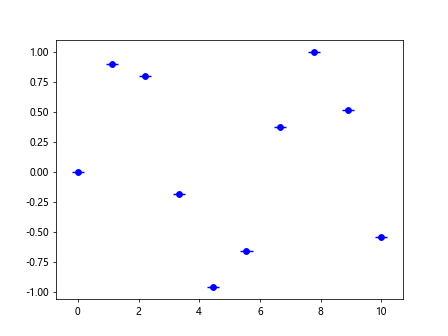
Similarly, you can create horizontal errorbars by providing error values for the x-axis only.
import matplotlib.pyplot as plt
import numpy as np

x = np.linspace(0, 10, 10)
y = np.sin(x)

# Define the error values
yerr = 0.1
xerr = 0.2

plt.errorbar(x, y, xerr=xerr, fmt='o', color='b')
plt.show()
Output:
Multiple Errorbars
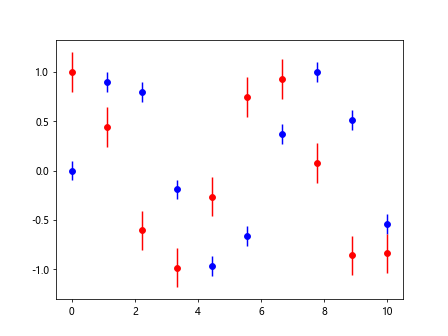
You can plot multiple datasets with different errorbars on the same plot. Let’s create two datasets with different error values and plot them together.
import matplotlib.pyplot as plt
import numpy as np

x = np.linspace(0, 10, 10)
y = np.sin(x)

# Define the error values
yerr = 0.1
xerr = 0.2
y2 = np.cos(x)
yerr2 = 0.2
plt.errorbar(x, y, yerr=yerr, fmt='o', color='b')
plt.errorbar(x, y2, yerr=yerr2, fmt='o', color='r')
plt.show()
Output:
Custom Errorbar Markers
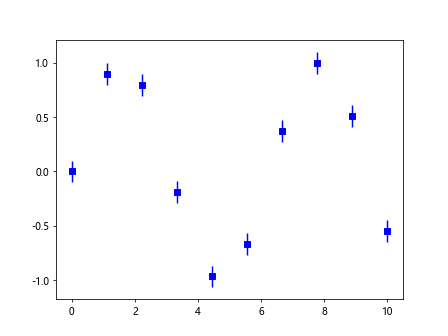
You can use different markers for the data points and errorbars to distinguish them visually. Let’s create errorbars with square markers.
import matplotlib.pyplot as plt
import numpy as np

x = np.linspace(0, 10, 10)
y = np.sin(x)

# Define the error values
yerr = 0.1
xerr = 0.2
y2 = np.cos(x)
yerr2 = 0.2

plt.errorbar(x, y, yerr=yerr, fmt='s', color='b')
plt.show()
Output:
Errorbar Caps
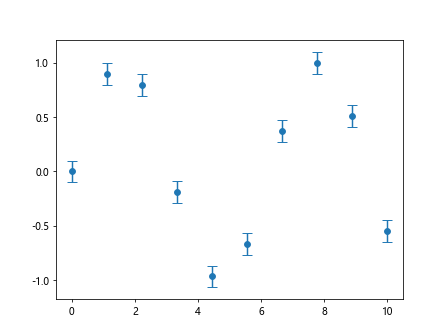
You can customize the appearance of the caps on the errorbars using the errorevery parameter. Let’s increase the cap width and show them for every data point.
import matplotlib.pyplot as plt
import numpy as np

x = np.linspace(0, 10, 10)
y = np.sin(x)

# Define the error values
yerr = 0.1
xerr = 0.2
y2 = np.cos(x)
yerr2 = 0.2

plt.errorbar(x, y, yerr=yerr, fmt='o', errorevery=1, capsize=5)
plt.show()
Output:
Filled Errorbars
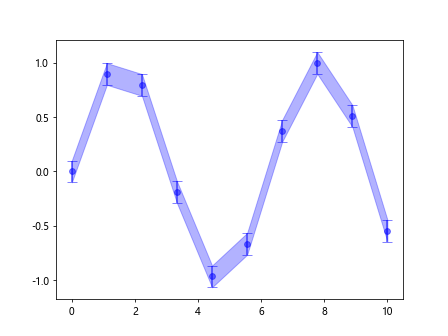
You can fill the space between the errorbars to visually represent the uncertainty in the data. Let’s create filled errorbars for the plot.
import matplotlib.pyplot as plt
import numpy as np

x = np.linspace(0, 10, 10)
y = np.sin(x)

# Define the error values
yerr = 0.1
xerr = 0.2
y2 = np.cos(x)
yerr2 = 0.2

plt.errorbar(x, y, yerr=yerr, fmt='o', color='b', alpha=0.5, capsize=5, elinewidth=2)
plt.fill_between(x, y-yerr, y+yerr, color='b', alpha=0.3)
plt.show()
Output:
Log Scale Errorbars
You can plot errorbars on a logarithmic scale using the log parameter. Let’s create log-scale errorbars for the plot.
import matplotlib.pyplot as plt
import numpy as np

x = np.linspace(0, 10, 10)
y = np.sin(x)

# Define the error values
yerr = 0.1
xerr = 0.2
y2 = np.cos(x)
yerr2 = 0.2

plt.errorbar(x, y, yerr=yerr, fmt='o', color='b', log=True)
plt.yscale('log')
plt.show()
Errorbar with Labels and Legends
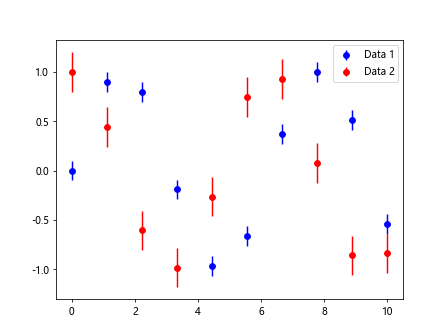
You can add labels and legends to your plot to provide additional information about the data. Let’s add labels for the data points and legends for the errorbars.
import matplotlib.pyplot as plt
import numpy as np

x = np.linspace(0, 10, 10)
y = np.sin(x)

# Define the error values
yerr = 0.1
xerr = 0.2
y2 = np.cos(x)
yerr2 = 0.2

plt.errorbar(x, y, yerr=yerr, fmt='o', color='b', label='Data 1')
plt.errorbar(x, y2, yerr=yerr2, fmt='o', color='r', label='Data 2')
plt.legend()
plt.show()
Output:
errorbar matplotlib Conclusion
In this article, we have covered the basics of creating errorbars in Matplotlib. We have explored different types of errorbars, customization options, and various examples to help you understand and implement errorbars effectively in your plots. By using errorbars, you can visually represent the uncertainty in your data and make your plots more informative and visually appealing. Experiment with the examples provided here and explore the many possibilities of errorbar plots in Matplotlib.